4009
Optimizing aCompCor denoising in task fMRI: using WM as noise source area1Radiology, UZ Brussel (VUB), Brussels, Belgium
Synopsis
Since neural BOLD responses were found in the white matter (WM), we hypothesized that using CSF and non-brain areas (NBA) as noise source areas, rather than WM and CSF, to denoise fMRI data with aCompCor, will positively affect the results of task fMRI studies. This hypothesis was tested by comparing the results of processing 2 task fMRI datasets once denoised with WM and CSF and once with CSF and NBA as noise source areas. Our results showed that denoising with aCompCor using CSF and NBA leads to higher effect sizes and a better overlap between individual activation maps.
Introduction
In a recent poster1, we showed the advantage of including a denoising step using aCompCor2, in the processing of task fMRI data. These analyses were done using the default implementation in CONN3. The noise signal components were determined from source areas assumed to have no neural BOLD responses: white matter (WM) and CSF. However, recent studies4,5 showed the occurrence of neural BOLD responses in WM related to BOLD responses in gray matter (GM). In an attempt to optimize the aCompCor denoising step, we hypothesized that using CSF and non-brain areas (NBA), rather than WM and CSF, as noise source areas will positively affect the results of task fMRI studies.Methodlogy
From the OpenNeuro database6, we selected the data from a motor7 (9 subjects) and a Flanker8 (26 subjects) experiments. Both done on healthy volunteers at a 3T scanner using a GE EPI sequence.All individual datasets were realigned, slice time corrected, normalized and smoothed in SPM12. Thereafter, the data were denoised using aCompCor once with WM and CSF and once with CSF and NBA as noise source areas. A GLM with the task conditions (finger, foot and lip movements for the motor task and congruent and incongruent trials for the Flanker task) as regressors was fitted to the denoised data. To find the significant activations, statistical t-tests at the individual and group levels, were performed for all contrasts (12 for the motor task, 6 for the Flanker task). The individual activation maps were thresholded at p<0.001 and the group activation maps at p<0.005.
For all activation results, we determined the effect size (ES) of the significant findings as the ratio of the contrast and the residual, we created the individual activation count maps (IACM) by overlapping the individual activation maps to determine the mutual overlap between the individual results and we masked these IACM with the respective group results to determine the overlap between the individual and group results (IGACM). At last, the mean ES, IACM and IGACM were calculated for the voxels in the GM, WM, CSF and NBA and in the main regions-of-interests (ROIS) per task: supplementary motor cortex and the precentral, postcentral, paracentral and supramarginal gyri for the motor task and the superior frontal, medial superior frontal, middle frontal, inferior frontal, anterior and posterior cingulate and the inferior parietal cortexes for the Flanker task. All left and right.
To compare the results of both processing pipelines, paired t-tests were performed.
Results
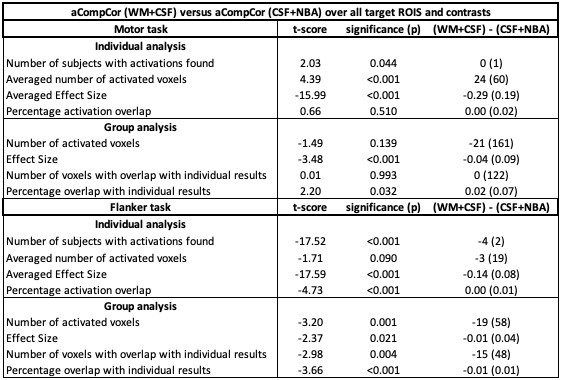
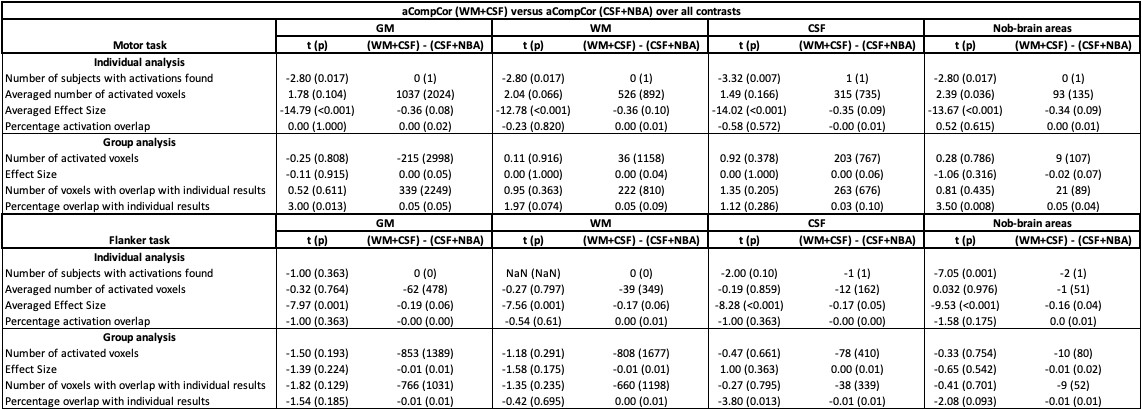
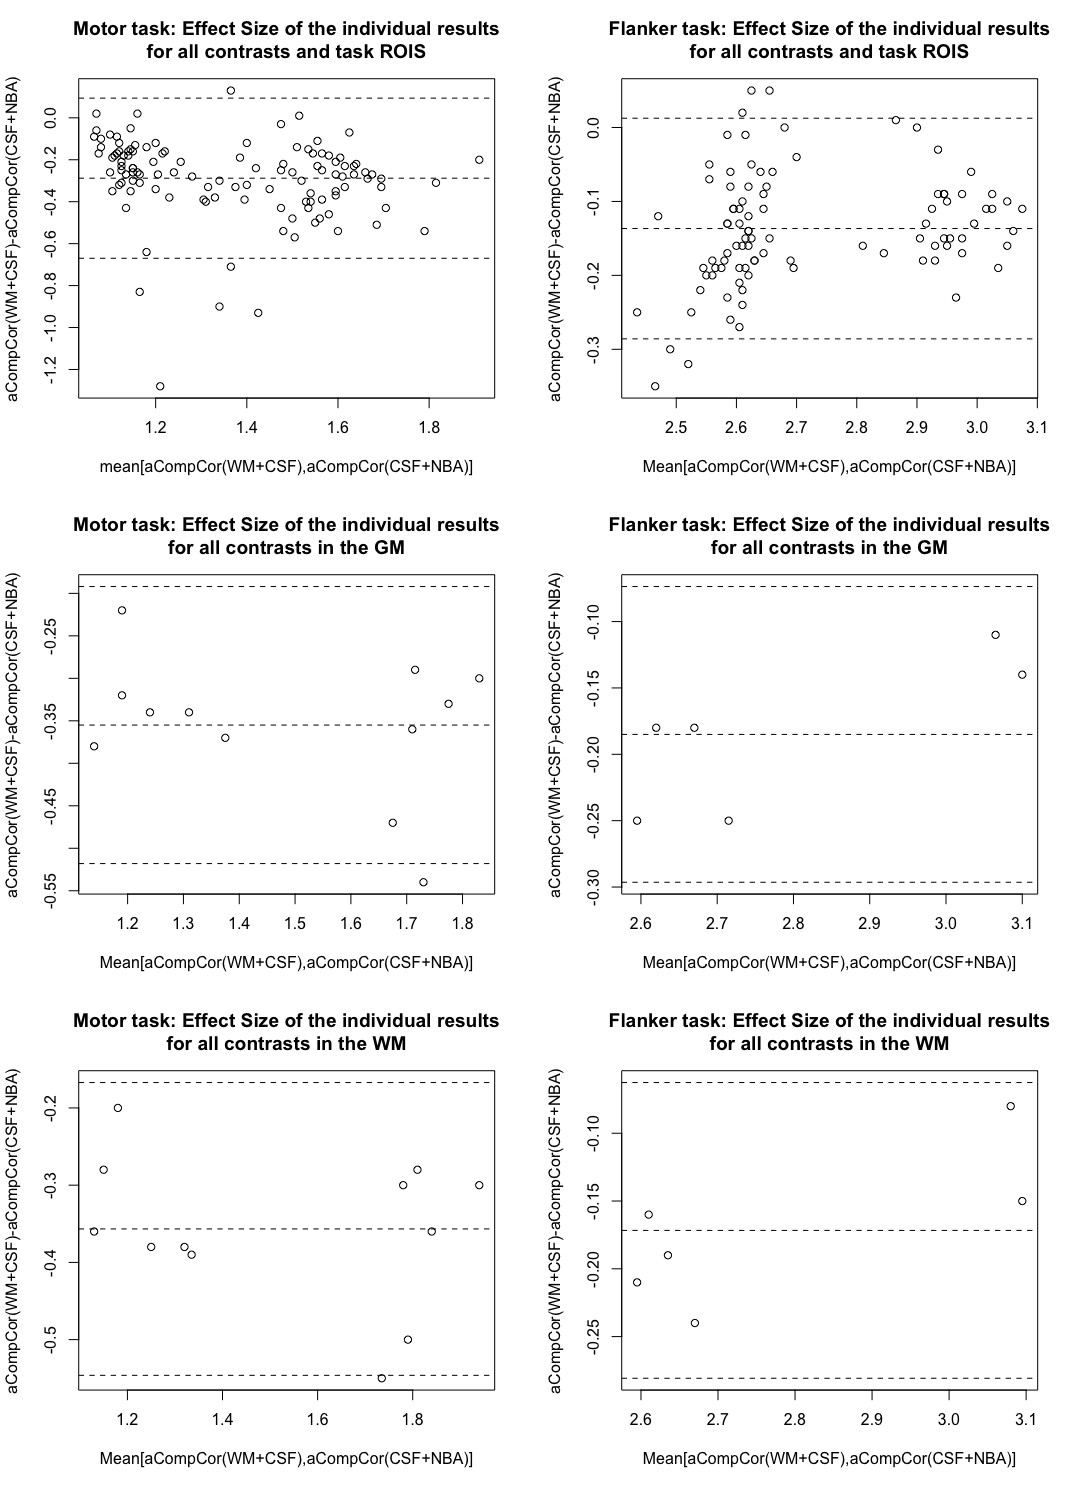
In table 1, the results of the comparison tests per task, done over all contrasts and main task ROIS are summarized. The results of the pairwise comparison tests for the activations found in the GM, WM, CSF and NBA are summarized in table 2.Figure 1 shows the Bland-Altman plots for the mean effect sizes found for the individual results for the main task ROIS, the GM and the WM.
Discussion
For the tested tasks, denoising using aCompCor with CSF and NBA as noise source areas seems to increase the effect sizes of the found activations. Additionally, in the main task ROIS, we found a better overlap between the individual and group activation maps. Moreover, in the more complex Flanker task, also the individual activation maps showed a significant higher mutual overlap. For the motor task, a better overlap between the individual activations was not found. This is possibly due to the fact that motor tasks mostly give good repeatable individual results, even after processing with less optimal pipelines using no denoising at all.The finding of larger effect sizes is of interest since higher effect sizes increase the power to detect the task related activations of interest. A better overlap between individual results is of interest, since this means that these results are more repeatable at the individual level and repeatable results have a smaller chance to be accidental (false positive) findings.
The activations observed in the CSF and NBA in all analyses, were due to smoothing of activations found in the nearby GM and WM.
Conclussion
Our results support our hypothesis that using CSF and NBA as noise source areas in aCompCor, to denoise task fMRI data, has a positive impact on the found activation maps.Acknowledgements
No acknowledgement found.References
1. Van Schuerbeek P. Denoising in task fMRI. ISMRM 2019 Abstract 3954
2. Behzadi Y. Restom K. Liau J. et al. A component based noise correction method (CompCor) for BOLD and perfusion based fMRI. Neuroimage 2007, 37(1), 90-101
3. CONN toolbox (www.nitrc.org/projects/conn, RRID:SCR_009550)
4. Gawryluk J.R. Mazerolle E.L., D’Arcy R.C.N. Does functional MRI detect activation in white matter? A review of emerging evidence, issues, and future directions. Front. Neurosci. 2014, 8:239
5. Li m. Newton A.T., Anderson A.W. et al. Characterization of the hemodynamic response function in white matter tracts for event-related fMRI. Nature Communications 2019, 10, 1140
6. OpenNeuro.org
7. Gorgolewski K.J., Storkey A., Bastin M.E. et all, A test-retest fMRI dataset for motor, language and spatial attention functions. Gigascience 2013: 2:6
8. This data was obtained from the OpenfMRI database. Its accession number is ds000102
Figures