4008
Optimum window-size in sliding-window dynamic functional connectivity analysis1Lou Ruvo Center for Brain Health, Cleveland Clinic, Las Vegas, NV, United States, 2University of Colorado, Boulder, Boulder, CO, United States
Synopsis
In this abstract, we proposed an optimum window-size in a sliding-window approach for dynamic functional connectivity analysis. The proposed window-size was derived from the instantaneous period and energy of each intrinsic mode functions (IMF) obtained from empirical mode decomposition. IMFs track local periodic changes of non-stationary time series and therefore can capture subtle temporal variations. Using dynamic functional connectivity matrix computed with the proposed window-size as features, a higher accuracy was obtained in classifying cognitively impaired fighters from cognitively normal ones; and a larger behavioral variance was found in HCP data.
Introduction.
The sliding-window approach has been widely used in dynamic functional connectivity (FC) analysis in fMRI to uncover temporal dynamics of brain’s intrinsic functions1,2. There has been no consensus yet on the choice of the window-size, which is required to be both small enough to catch existing temporal transients, and large enough to avoid unstable results3. In this study, we propose a method that determines an optimum window-size at every time point based on frequency content of time series in a sliding-window approach. We validated the proposed method with both a regression analysis using Human Connectome Project (HCP)4 data with a high sampling rate and a classification analysis using Professional Fighters Brain Health Study (PFBHS)5 data with a conventional sampling rate.Methods.
Computation of an optimum window-size. Fig.1 illustrates steps to compute the proposed optimum window-size. Briefly, the optimum window-size was calculated from the instantaneous period and energy of each intrinsic mode function (IMF) obtained from empirical mode decomposition (EMD) of the time series6,7. After intensity normalization, the fMRI time series was first decomposed into different IMFs using EMD. The Hilbert transform was then used on each IMF to compute the instantaneous period and energy density at each time point. The final instantaneous period was computed as the average of instantaneous periods over all IMFs, weighted by the corresponding instantaneous energy density. In a dynamic functional connectivity analysis, the optimum window-size for two regions of interest (ROI) time series at a specific time point was then selected to be the maximum of the two periods. Validation with regression analysis. 78 male subjects from HCP 1200 Subject Release (https://www.humanconnectome.org/study/hcp-young-adult/document/1200-subjects-data-release), and their first resting-state fMRI session in two days, were included in this analysis. Functional MRI were acquired at a fast sampling rate (TR=0.72s) and 1200 time points were collected. After preprocessing steps, static FC were computed as the Pearson’s correlation between each regions of interest (ROI) pair defined in the automated anatomical labeling (AAL) atlas. Dynamic FC were estimated using the sliding-window approach with both proposed optimum window-size, and conventional fixed window-sizes. Specifically, the window was slided over 4 time points (3 seconds) and FC was estimated within each window. The temporal standard deviation over all windows was used to quantify the dynamic FC. 57 behavioral measures covering social, emotional, cognitive, and personality traits were used in this analysis, with age and handedness as covariates. Linear regression analysis was performed to test how much variance of these 57 behavioral measures could be explained by the static and dynamic FC features. Validation with classification analysis. 65 cognitively normal fighters and 68 cognitively impaired fighters from PFBHS were included in this analysis. The cognitive impairment status was predefined using neuropsychological tests5. Resting-state fMRI data were collected at a conventional sampling rate (TR=2.8s) and 137 time frames were collected. Additional T1 data were collected with a standard MPRAGE sequence and input into FreeSurfer8 to generate a subject-specific cortical and subcortical parcellation. After preprocessing steps, average time series of each ROI were obtained from this parcellation. Both static and dynamic FC were estimated using the same methods as for the HCP data. The window was slided over 1 TR (2.8seconds) in this case. Both static and dynamic FC were used as features to classify cognitive impairment status of fighters. Classification framework includes an automated feature selection step and a radial basis functional classifier9. A ten-fold cross validation was used to determine the classification accuracy and the ten-fold division was repeated 100 times to avoid division bias.Results.
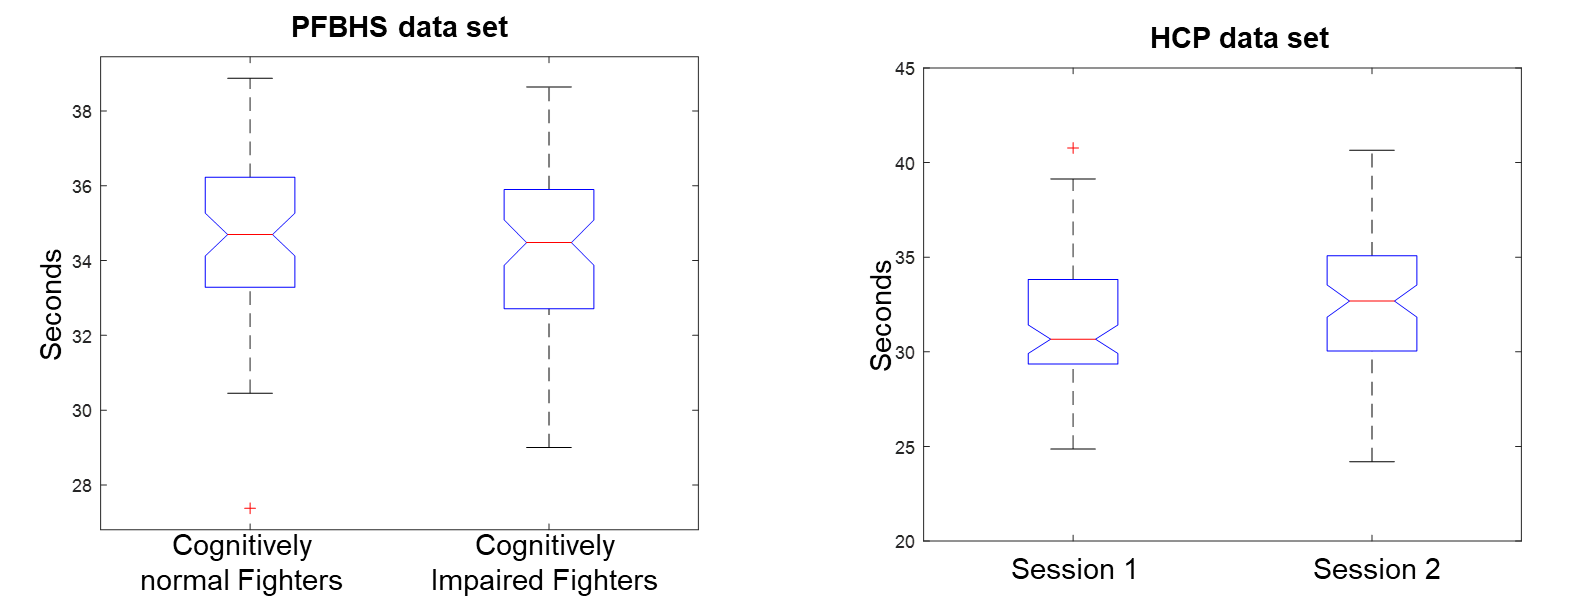
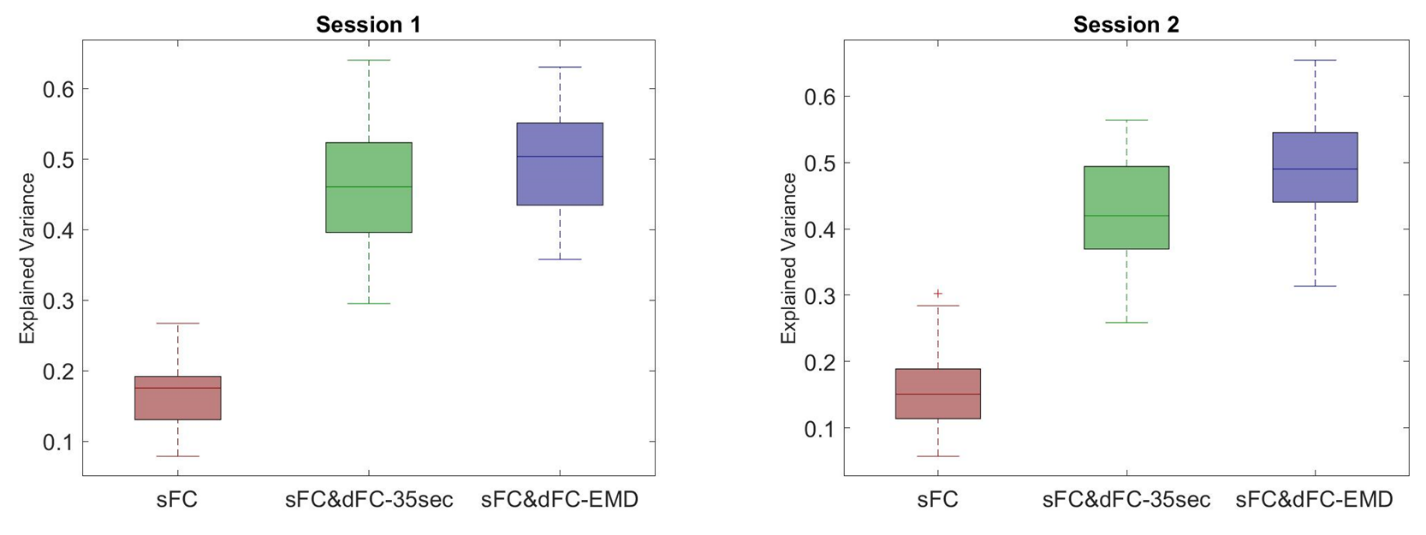
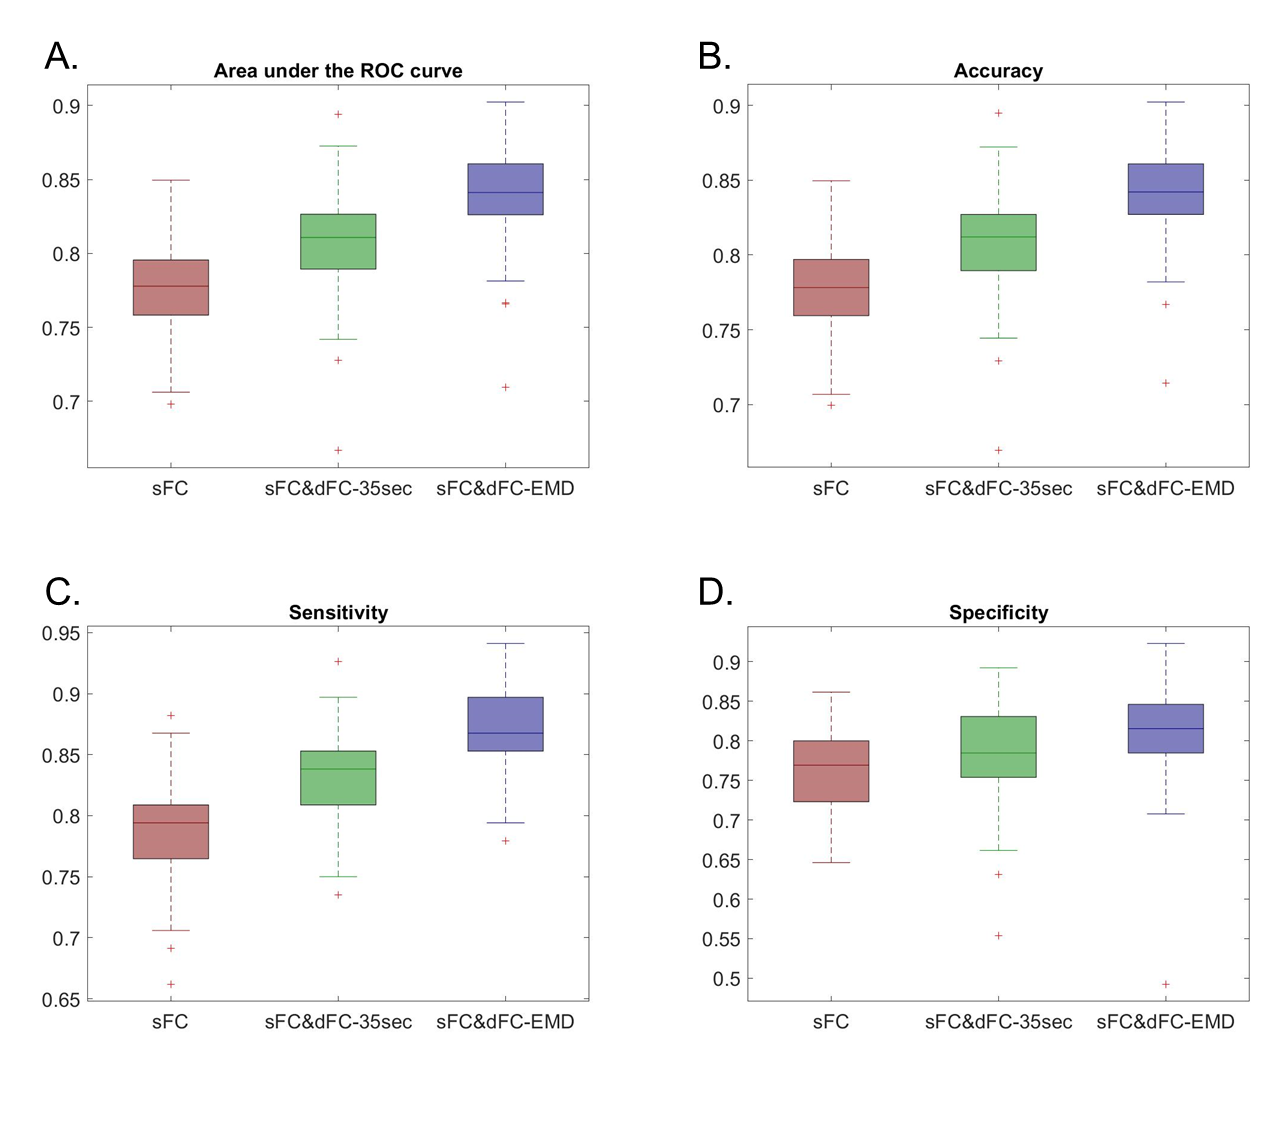
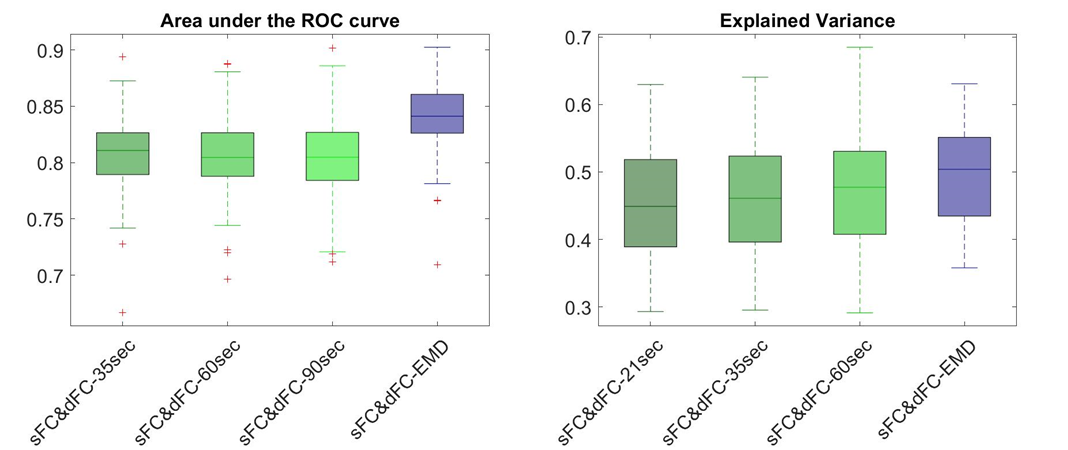
Fig.1 lists detailed preprocessing steps for PFBHS data (top right panel) and HCP data (top left panel), and steps to compute the proposed optimum window-size (middle and bottom panel). In both data, the average optimum window-size is around 35 seconds (Fig.2), regardless of the fMRI sampling rate. Therefore, the main fixed window-size for comparison was chosen to be 35 seconds. Fig.3 plots the explained behavioral variance of HCP data and Fig.4 shows the classifier performance of PFBHS data, with static FC, static and dynamic FC with fixed window-size, and static and dynamic FC with optimum window-size as feature sets, respectively. Fig.5 further compares the performance of the proposed optimum window-size with multiple fixed window-sizes in both classification (left) and regression (right) analysis.Discussion.
Both largest explained variance and highest classification accuracy demonstrate that the proposed window-size is able to capture more detailed temporal variations in a sliding-window approach for dynamic FC analysis, as compared to conventional fixed window-sizes. The proposed optimum window-size is determined from IMFs, which track the local periodic changes of non-stationary time series and therefore can be used to compute an optimum window-size at each time-point.Acknowledgements
This research project was supported by the NIH (grant 1R01EB014284 and COBRE grant 5P20GM109025), Young scientist award from Cleveland Clinic, a private grant from Peter and Angela Dal Pezzo, a private grant from Lynn and William Weidner, and a private grant from Stacie and Chuck Matthewson.References
1. Allen EA, Damaraju E, Plis SM, Erhardt EB, Eichele T, Calhoun VD. Tracking whole-brain connectivity dynamics in the resting state. Cereb Cortex. 2014;24(3):663-676. doi:10.1093/cercor/bhs352
2. Damaraju E, Allen EA, Belger A, et al. Dynamic functional connectivity analysis reveals transient states of dysconnectivity in schizophrenia. NeuroImage Clin. 2014;5(July):298-308. doi:10.1016/j.nicl.2014.07.003
3. Hutchison RM, Womelsdorf T, Allen EA, et al. Dynamic functional connectivity: Promise, issues, and interpretations. Neuroimage. 2013;80:360-378. doi:10.1016/j.neuroimage.2013.05.079
4. Human Connectome Project. WU-Minn HCP 1200 Subjects Release: Reference Manual Appendix I-Protocol Guidance and HCP Session Protocols. 2017;(March). http://www.cmrr.umn.edu/multiband/.
5. Bernick C, Banks S, Phillips M, et al. Professional fighters brain health study: Rationale and methods. Am J Epidemiol. 2013;178(2):280-286. doi:10.1093/aje/kws456
6. Huang, N.E., Shen, Z.S., Long, R.M., Wu, C., Shih, H.-H., Zheng, Q., Yen, N.-C., Tung, C.-C., Liu H-H, Huang NE, Shen Z, et al. The empirical mode decomposition and the Hilbert spectrum for nonlinear and non-stationary time series analysis. Proc R Soc A Math Phys Eng Sci. 1998;454(1971):903-995. doi:10.1098/rspa.1998.0193
7. CHEN X, WU Z, HUANG NE. The Time-Dependent Intrinsic Correlation Based on the Empirical Mode Decomposition. Vol 02.; 2010. doi:10.1142/S1793536910000471
8. Fischl B. FreeSurfer. Neuroimage. 2012;62(2):774-781. doi:10.1016/j.neuroimage.2012.01.021
9. Mishra VR, Zhuang X, Sreenivasan KR, et al. Multimodal MR Imaging Signatures of Cognitive Impairment in Active Professional Fighters. Radiology. 2017;0(0):Ryan, J. O., Pakhomov, S. V. S., Marino, S., Berni. doi:10.1148/radiol.2017162403
Figures