4007
Correcting respiratory-related noise in brainstem fMRI using regressors derived from phase data
David Bancelin1, Pedro Lima Cardoso1, Beata Bachrata1,2, Andreas Ehrmann1, Siegfried Trattnig1,2, and Simon D. Robinson1,3,4
1High-Field MR Centre, Medical University of Vienna, Vienna, Austria, 2Christian Doppler Laboratory for Clinical Molecular MR Imaging, Vienna, Austria, 3Department of Neurology, Medical University of Graz, Graz, Austria, 4Centre for Advanced Imaging, University of Queensland, Queensland, Australia
1High-Field MR Centre, Medical University of Vienna, Vienna, Austria, 2Christian Doppler Laboratory for Clinical Molecular MR Imaging, Vienna, Austria, 3Department of Neurology, Medical University of Graz, Graz, Austria, 4Centre for Advanced Imaging, University of Queensland, Queensland, Australia
Synopsis
Respiratory and cardiac data are generally used to properly account for the presence of physiological noise in fMRI data. Pneumatic belts can be unreliable, but we show that EPI phase data can be used to generate a reliable respiratory time series from which regressors are used in a GLM procedure to correct magnitude data. The efficacy of our method is compared with respect to (i) uncorrected magnitude data and (ii) magnitude data corrected using respiratory belt-derived regressors.
Introduction
The proximity of the brainstem to the fourth ventricle and arteries generates physiological noise (respiration and cardiac fluctuations) in BOLD fMRI data due to changes in B0 and flow effects. These reduce BOLD sensitivity to activation in the small grey matter nuclei in that region. To remove these perturbations, respiratory and cardiac time series are generally derived from measurements with peripheral devices (respiratory bellows and pulse oximeters) and then regressed out using e.g. RETROICOR(1), a process that is generally effective in reducing signal variance in the brainstem, as shown by Harvey et al(2) .As respiratory measurements can be unreliable, we attempt to derive respiratory time series from phase data from the fMRI time series. Indeed, it has been shown by Zahneisen et al(3) that phase variations in the brainstem are closely related to the respiration cycle.
In this work, we propose to derive a respiratory signal from phase data in order to derive slice-wise respiratory regressors for correcting magnitude data. We compare our results with those obtained with respiratory belt-derived regressors from the PhysIO Toolbox(4).
Methods
Three healthy volunteers were scanned with a Siemens PRISMA 3T using a multiband EPI sequence(5) (TE/TR = 28/1000 ms, 128x128 matrix, 1.7x1.7x2.0 mm voxel size, 12 sagittal slices, 300 volumes, multiband factor 2). Parallel measurements were made with a respiratory belt.The phase data were combined using the Virtual Receiver Coil method(6), unwrapped with SEGUE(7) and filtered in the range of typical respiration frequencies 0.08-0.5 Hz. After averaging the phase in each slice, phase variations were removed from the averaged phase $$$\phi_{j,t}$$$ in slice j at each time point t, such that: $$$\phi_{j,t} = \phi_{j,t} - \left (\phi_{j,\scriptscriptstyle{1}} - \phi_{i,\scriptscriptstyle{1}} \right)$$$ where the index i refers to a reference slice.
The slice TR-sampled respiratory time series was then obtained by reordering each slice in a single scalar time series according to the slice timing acquisition. This was used to calculate a scalar then a slice-wise respiratory phase.
To correct the magnitude data using the GLM, we considered a similar respiratory Fourier order expansion of four (as suggested by Harvey et al(2)) to generate slice-wise cosines and sines respiratory regressors and model the respiratory noise with RETROICOR.
To evaluate the efficacy of our method, we generated temporal SNR (tSNR) maps in the middle slice from the magnitude data corrected with respiratory regressors from phase data and belt measurements.
In order to represent the magnitude of the respiratory correction for each voxel, we calculated the square root of the sum of the squares of the t-scores of all respiratory cosines and sines Fourier coefficients.
All results were compared with those obtained via the respiratory belt measurements.
Results
Figure 1 shows, for each subject, a comparison between (a) the variance normalized phase-derived (blue continuous line) and belt-derived (red dashed line) respiration time series zoomed on the first 60 s of the experiment (left columns), and (b) the associated power spectra (right columns). Both correlation values in time series and power spectra show that our model is in a good agreement with the measurements.A similar comparison between the slice TR-sampled respiration phase obtained using the respiratory belt and phase-derived signal are displayed on the left column in Fig. 2 where the phase-derived time series correlates well with the one from the respiratory belt, with a correlation above 0.5 for each subject. The two first regressors (right columns) are also in a good agreement, with a mean correlation (averaged over the 12 slices) above 0.4.
Figure 3 compares the gain in tSNR with our method. Not only results are in a good agreement with the tSNR obtained with the respiratory belt, but they even exhibit a slight gain: up to 4% more variance reduction in the brainstem area (subject 3).
We display in Fig. 4 spatial t-maps in the middle slice (t>2.3) of the respiratory regressors from phase data (left columns) and from the respiratory belt (middle columns), and a gain map (in percent) between both (right columns). Although the area in the spinal cord exhibits negative gains, our method can reproduce t-maps from the measurements and enable t-scores improvement of voxels located in the pons and midbrain.
Discussion
Our study demonstrates that it is possible to extract a reliable respiratory signal by means of the phase data. The approach we propose to removing slice dependency in the phase allows the derivation of signals which are sampled at the slice TR rather than the volume TR, offering the possibility to identify cardiac-related fluctuations, which are generally subcritically sampled. As seen in Fig. 3, using 4D phase data seems more effective in reducing signal variance because our respiratory regressors are directly derived from voxels carrying respiratory information. Our method has the advantage of not depending on respiratory measurements, which require additional patient preparation to set up, are fragile and not always trivial to correlate with the fMRI time series.Conclusion
We have successfully demonstrated in this study that not only respiratory noise correction can be achieved without performing parallel measurements by using phase data, but also that variance in voxels can be better reduced.Acknowledgements
This study was funded by the Austrian Science Fund project FWF31452. SDR is supported by Marie Sklodowska-Curie Action MS-fMRI-QSM 794298.References
- Glover GH, Li TQ, Ress D. Image-based method for retrospective correction of physiological motion effects in fMRI: RETROICOR. Magnetic Resonance in Medicine. 2004;44:162-167.
- Harvey AK, Pattinson TS, Brooks JCW, Jenkinson M, Wise RG. Brainstem Functional Magnetic Resonance Imaging: Disentangling Signal From Physiological Noise. Journal of Magnetic Resonance Imaging. 2008;28:1337-1344.
- Zahneisen B, Assländer J, Le Van P, Hugger T, Reisert M, Ernst T, Hennig J. Quantification and Correction of Respiration Induced Dynamic Field Map Changes in fMRI Using 3D Single Shot techniques. Magnetic Resonance in Medicine. 2014;71:1093-1102.
- Kasper L, Bollman S, Diaconescu AO, Hutton C, Heinzle J, Iglesias S, Hauser TU, Sebold M, Manjaly ZM, Pruessmann K, Stephan KE. The PhysIO Toolbox for Modeling Physiological Noise in fMRI Data. Journal of Magnetic Resonance Imaging. 2017;276:56-72.
- Xu J, Moeller S, Auerbach EJ, Strupp J, Smith SM, Feinberg DA, Yacoub E, Uğurbil K. Evaluation of slice accelerations using multiband echo planar imaging at 3 T. Neuroimage. 2013;83(0):991-1001.
- Parker DL, Payne A, Todd N, Hadley JR. Phase Reconstruction from Multiple Coil Data Using a Virtual Coil. Magnetic Resonance in Medicine. 2014;72(2):563-569.
- Karsa A, Shmueli K. A Speedy rEgion-Growing Algorithm for Unwrapping Estimated phase. IEEE Transactions on Medical Imaging. 2019;38:1347-157.
Figures
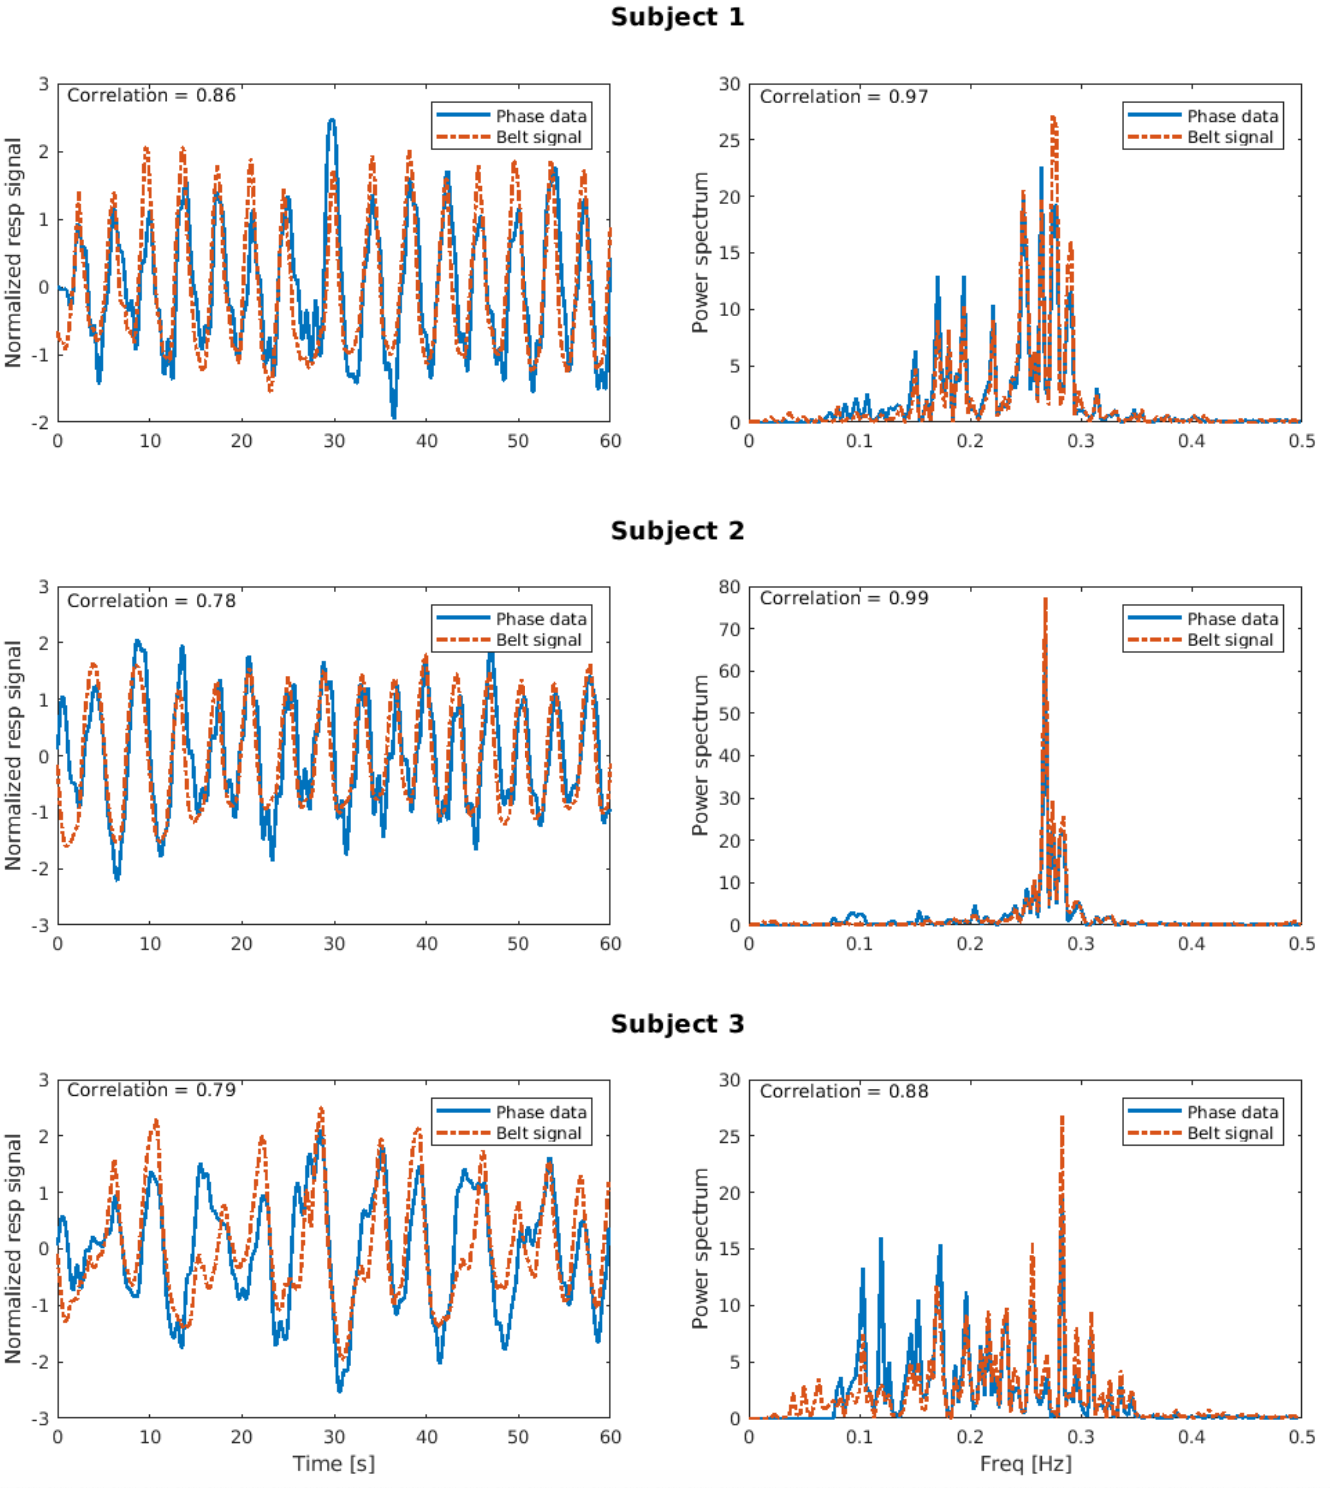
Figure 1: Left columns: comparison, for each subject, between the slice TR-sampled respiratory time series derived from phase data (blue continuous line) and the respiratory belt (dashed red line). Right columns: comparison between the power spectrum of each respiratory time series. Both graphs show a high correlation.
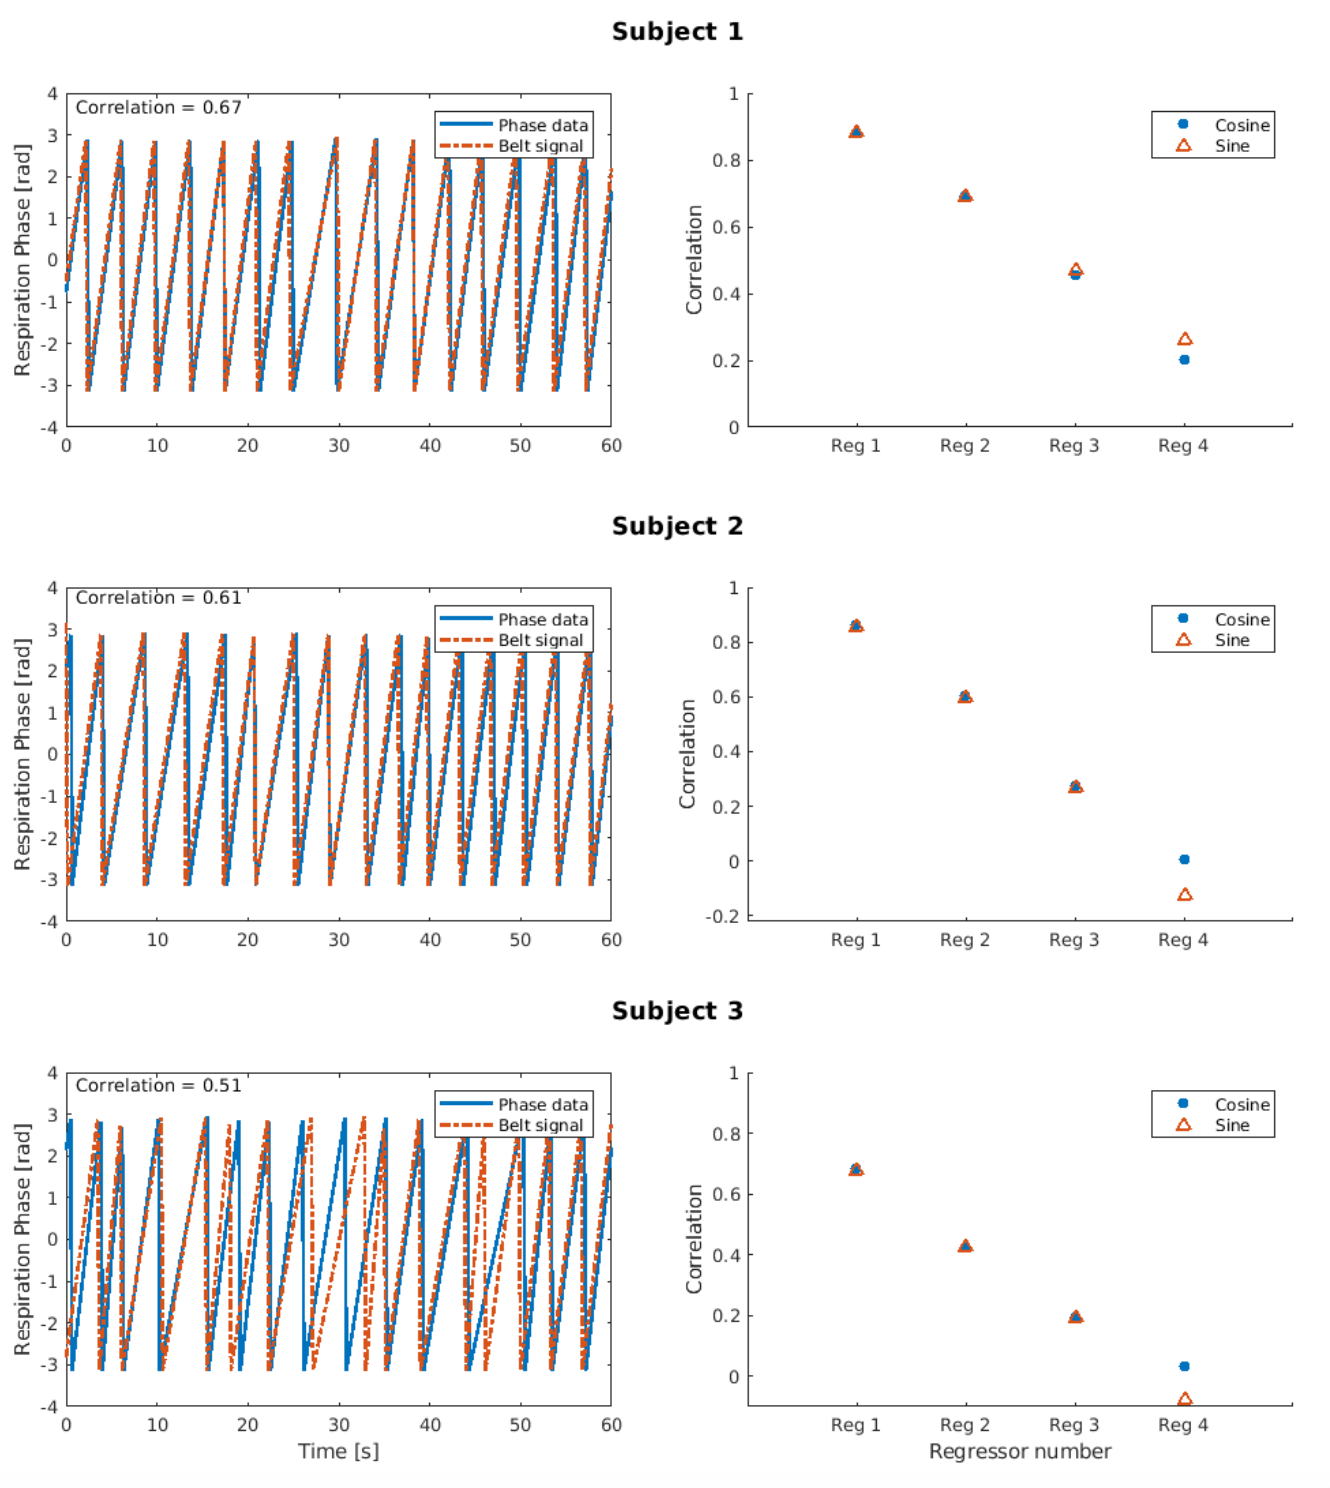
Figure 2: Left columns: correlation between the slice TR-sampled scalar respiratory phase time series (similar
colour code as in Fig. 1). Right columns: mean correlation over the 12 slices between each cosine (blue filled circles)
and sine (red open triangle) regressors (up to the Fourier order expansion 4) obtained either from phase data or the
respiratory belt.
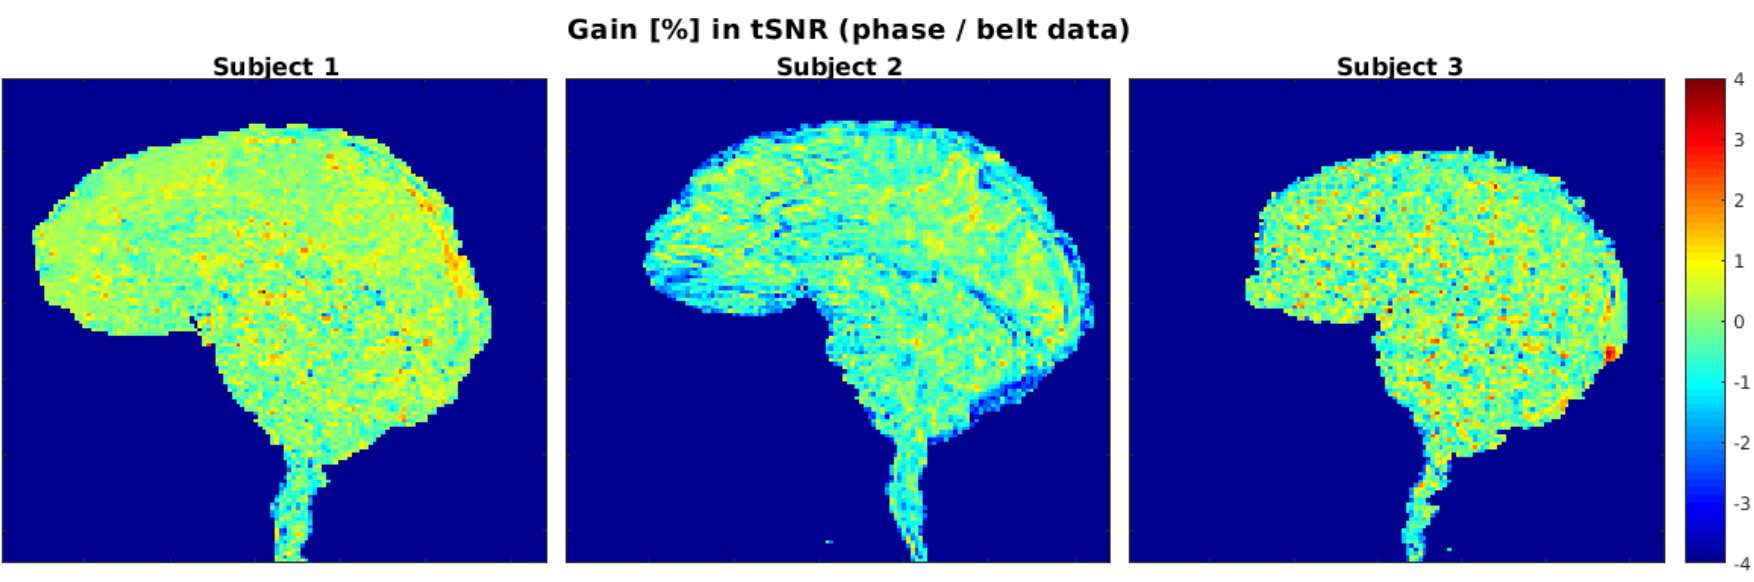
Figure 3: Gain in tSNR (in percent) compared to the respiratory belt-derived regressors where a non-negligible gain
of 4% in the brainstem can be observed for subject 3
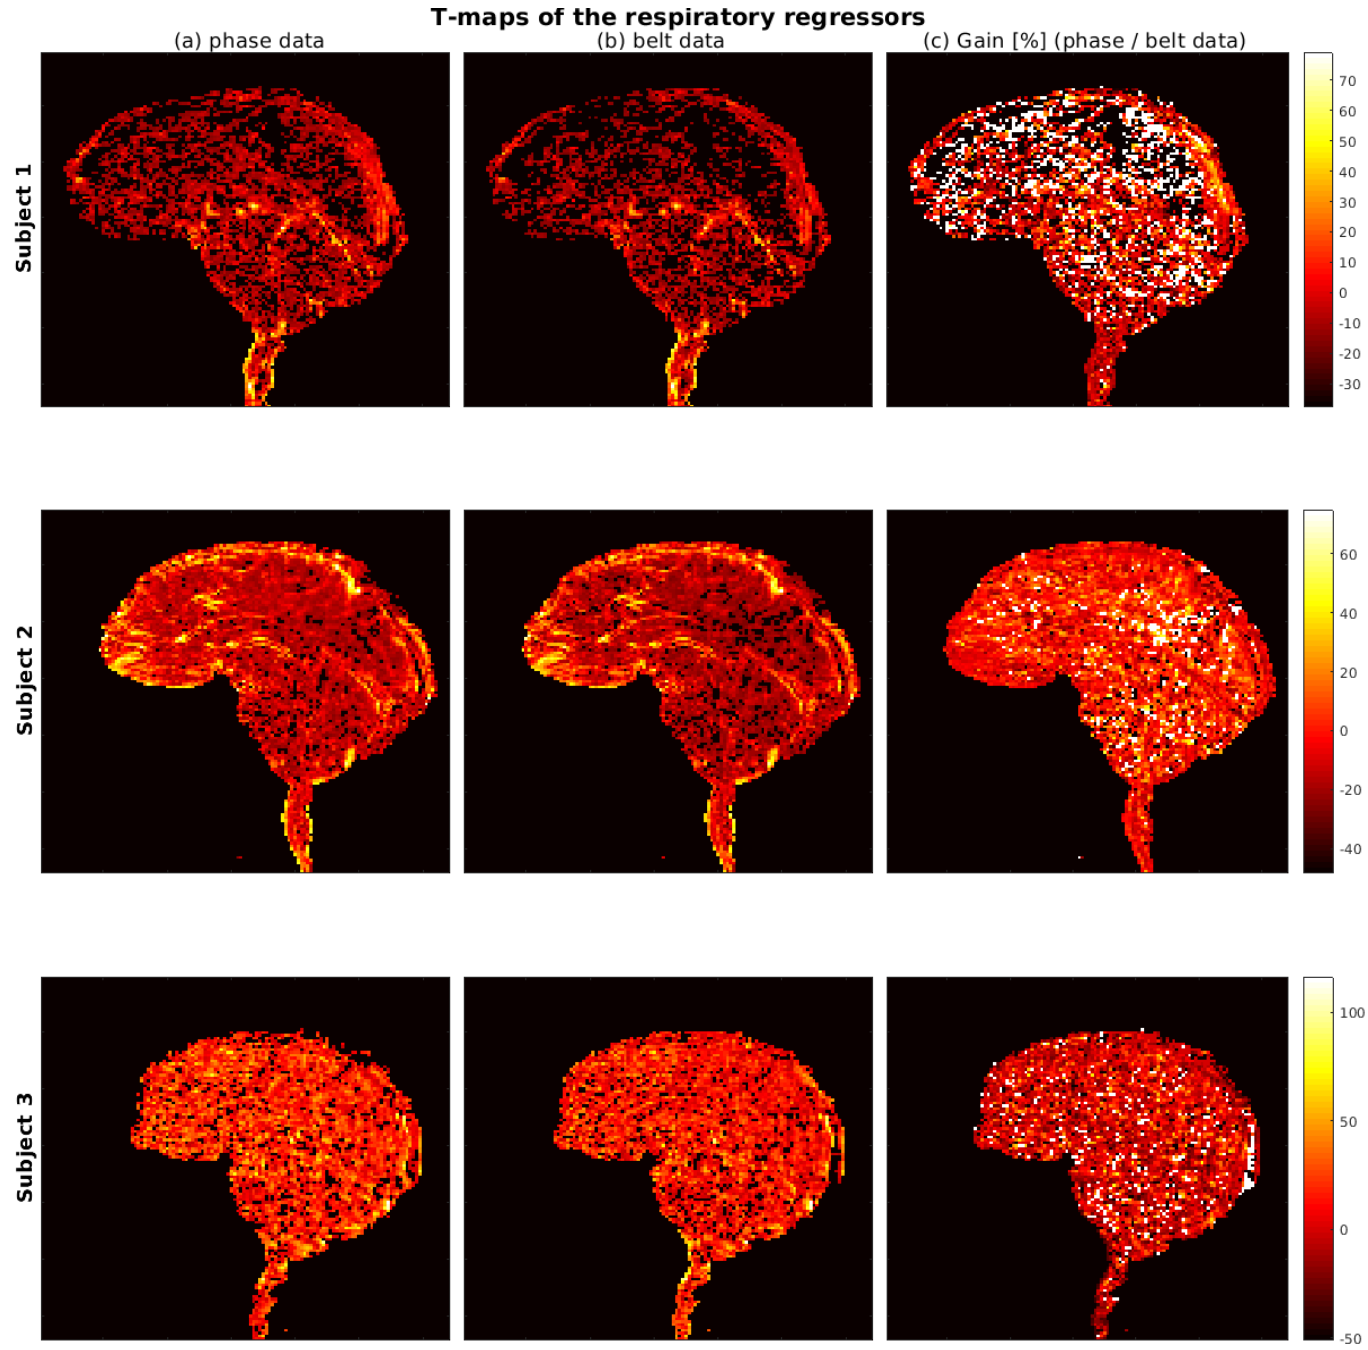
Figure 4: Spatial t-maps (t>2.3) of respiratory regressors derived with our method (left columns) and with the respiratory belt (middle columns). Both maps agree in the location of respiration-corrected voxels in the brainstem. Apart
in the spinal cord, the right columns show in addition positive gains in t-scores in the upper part of the brainstem with
our method compared to the measurements.