4006
Physiologic noise correction for phase shifted cardiac fluctuation with the quality assurance of measured and estimated physiologic noise.1Radiology, Cleveland Clinic, Cleveland, OH, United States
Synopsis
We have previously developed and publicly shared the physiologic noise estimation and removal software package, PESTICA (www.nitrc.org/projects/pestica). We present a new version of the PESTICA/RETROICOR software package, correcting cardiac phase shift and generating the goodness of fit with modeled physiologic noise and quality assurance of external physiologic signals based AFNI and Matlab. This study describes the updates, validation and demonstrate its usage.
Introduction
In a previous study, we showed that the cardiac response function is time-delayed while the respiratory response function has fixed polarity shifts. Based on this, we proposed a cardiac phase shift corrected physiologic noise estimator by temporal ICA, or cPESTICA1, 2. In this study, we present the updated cPESTCIA package , which also supports RETROICOR3. The released package will support either physiology signal estimation and removal with PESTICA, or directly from provided external physiologic signal recording. A new version of cPESTICA/RETROICOR provides the quality assurance of measured and estimated physiologic noise and the statistical fitting result of measured/estimated cardiac and respiratory noises in EPI data.RETROICOR Usage: with external physiologic signal recording.
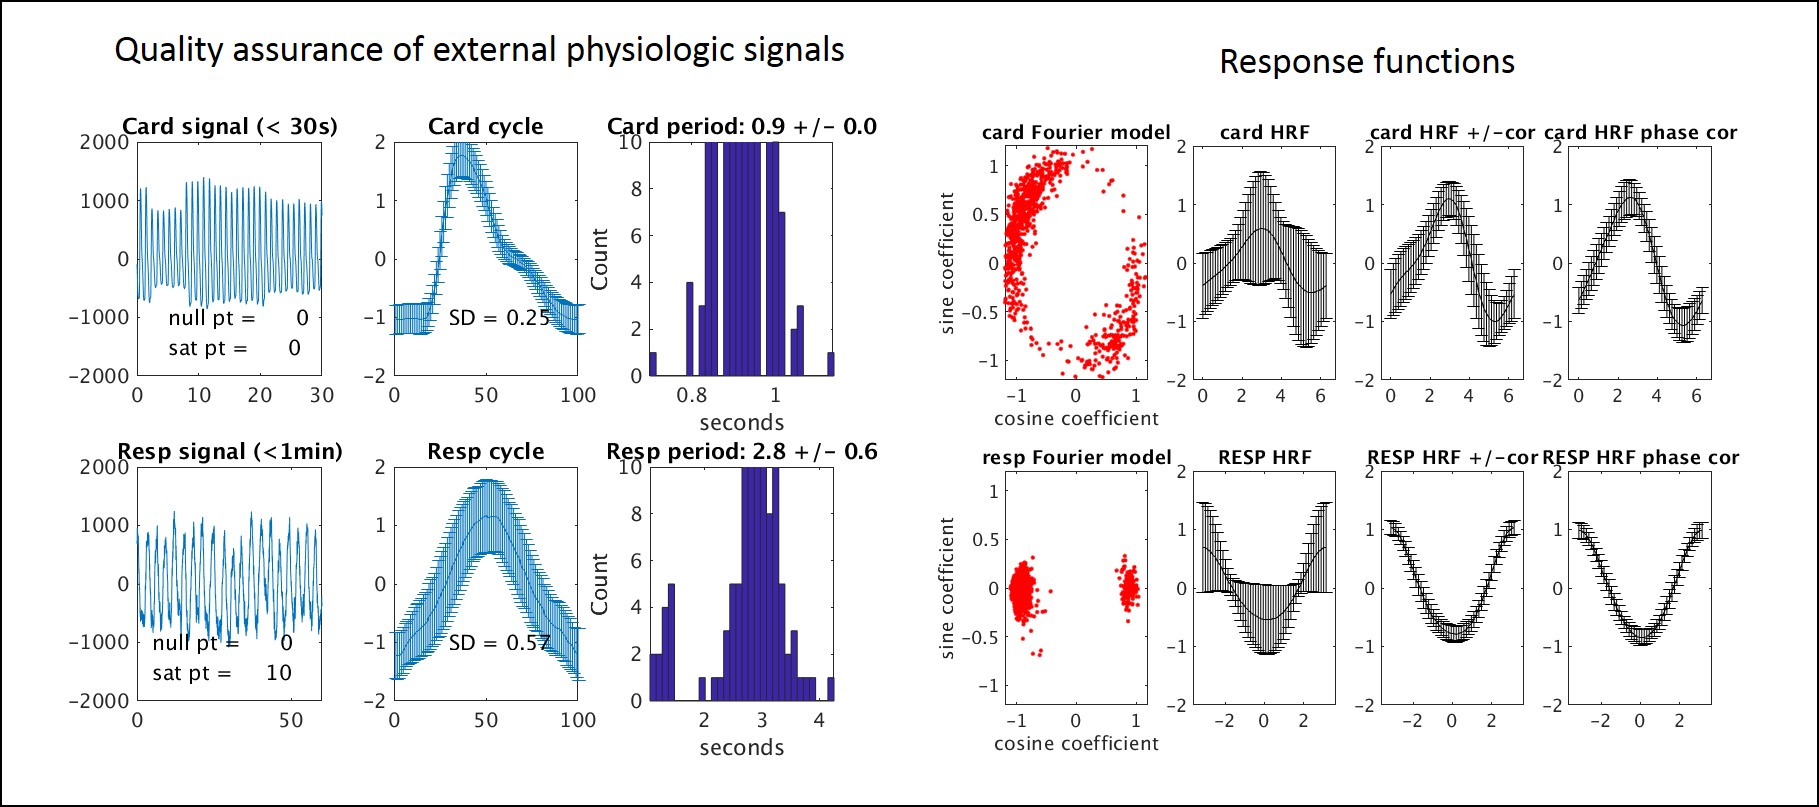
EPI data and external physiologic signals are required as inputs. EPI data should be the file format of NIFTI or NIFTI PAIR or BRIK. Compressed NIFTI is also supported, e.g. .hdr, +orig.BRIK, .nii, and .nii.gz. The supported external physiologic signal and EPI trigger files formats are on Siemens platform, e.g. .resp, .puls and .ext. HCP format (_RESP, _PULS, and _Info) is also supported. Low frequency of cardiac and respiratory fluctuation correction, RVHR is implemented as option4.For the quality assurance purpose, the external physiologic signals are tested. Signals variations over cycles and the periods of mean/standard deviation are calculated. From the top 5% of highest F value voxels of RETROICOR fitting, cardiac and respiratory response functions are calculated, and the results are generated as outputs. Fig 1. shows the example of pmu_qualitycheck.png and pmu_M2_HRFcheck.png files.
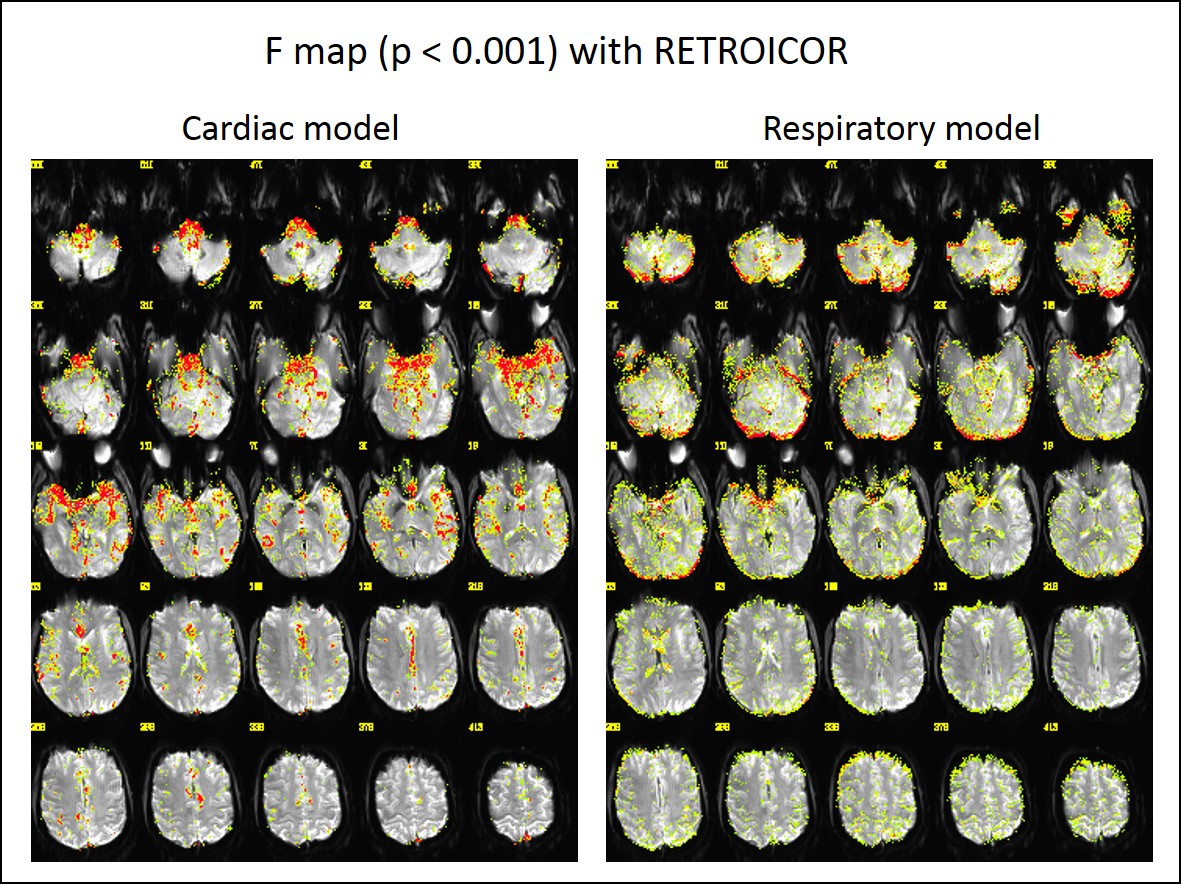
F-value maps are generated from RETROICOR fitting. Fig2 visualize the generated F-value maps of cardiac and respiratory RETROICOR fitting (p<0.001). Coupling_retroicor_pmu_card/resp files are produced to capture F value maps in representative slices, and statistic BRIK file is also generated, including F-values of each model and student t-maps of each coefficient term.
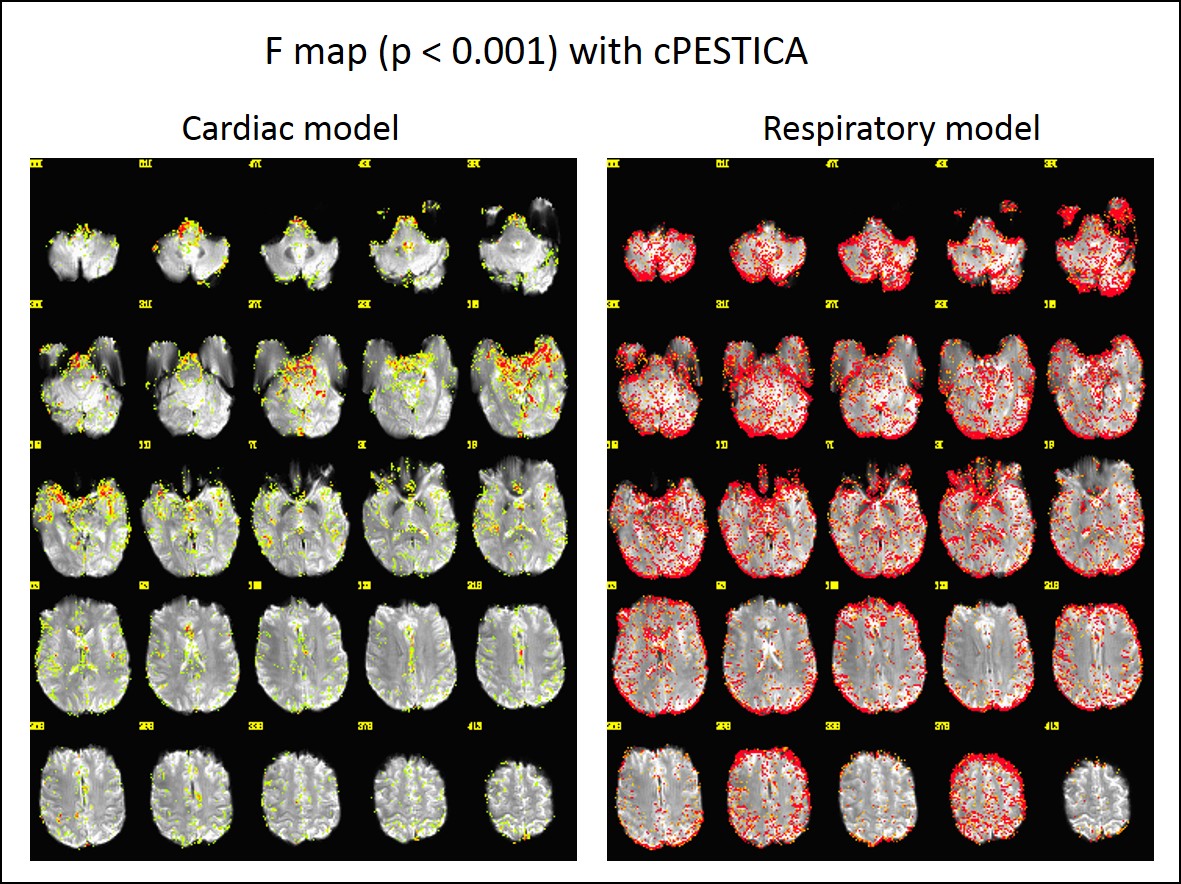
cPESTICA Usage: without external physiologic signal recording
cPESTICA generates 4 cardiac regressors and 1 respiratory regressor 2. After applying slicewise temporal ICA, cardiac and respiratory noises components were selected based on the maximum coherence between the spatial maps of individual and templates 1. The selected slicewse noise componets were concatenated to generates high sampling rates of noise components (slices /TR). To correct phase shift of cardiac regressors, Fourier series is modeled as RETROICOR, and respiratory noise component is used as single regerssor since respiratory fluctuation has fixed phase.Fig 3 shows F maps (p <0.001) from cPESTICA fitting result of the same subject shown in Fig2. Note that F values of estimated respiratory noise is relative high, shown as all reds ( > 10) to be compared with F value of RETROICOR respiratory fitting because cPESTICA has single respiratory regressor while RETROICOR has 4.
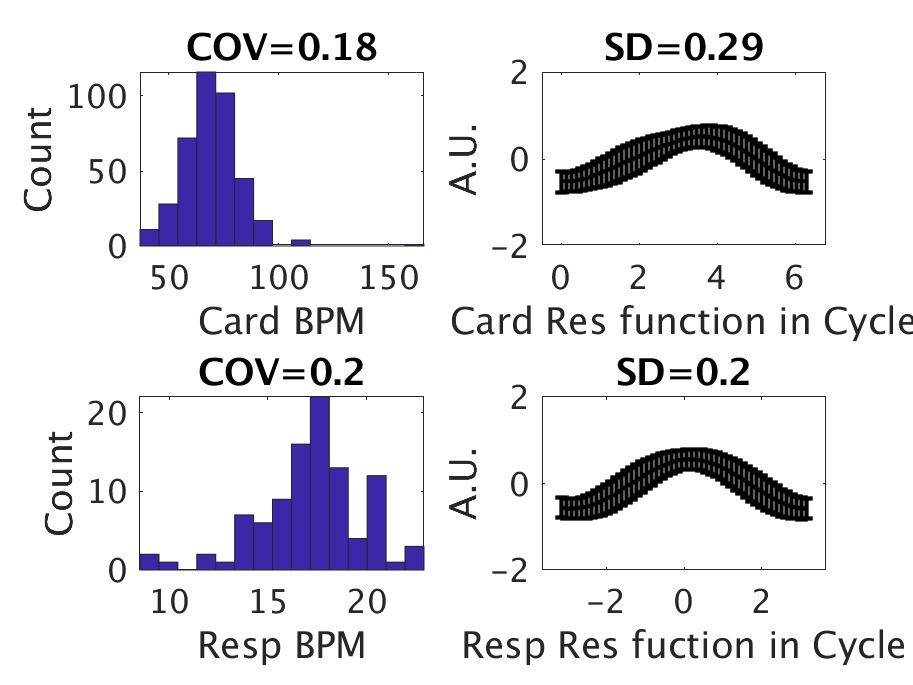
Fig 4 presents the calculated response function from estimated physiologic noise fluctuation. The smaller coefficient of variation and standard deviation in cycles indicates the consistent estimated period and fluctuation within cycles.
Discussion/Conclusion
The quality assurance of external physiologic signal is important, and corrupted physiologic data could result in imperfect physiologic noise correction5. While we do not provide guidance on the threshold for quality for a given study, the software generates the goodness of fitting (Fig2,3) and the index to represent the consistency of physiologic data (Fig1,4), from which the user determines picking up the outliers based on the sampled studies. Software is found in www.nitrc.org/projects/pesticaAcknowledgements
No acknowledgement found.References
1. Beall EB, Lowe MJ. Isolating physiologic noise sources with independently determined spatial measures. Neuroimage 2007;37:1286-1300.
2. Shin W, Lowe MJ. Time variant cardiac noise correction in resting state fMRI without physiologic noise measures. Proceeding of the 27th Meeting of the Society for Magnetic Resonance in Medicine; 2019; Montreal, Canada: 3937.
3. Glover GH, Li TQ, Ress D. Image-based method for retrospective correction of physiological motion effects in fMRI: RETROICOR. Magn Reson Med 2000;44:162-167.
4. Chang C, Cunningham JP, Glover GH. Influence of heart rate on the BOLD signal: the cardiac response function. Neuroimage 2009;44:857-869.
5. Shin W, Lowe MJ. Qualilty of Physiologic Signal Measures in HCP Resting State FMRI Data. Proceeding of the 26th Meeting of the Society for Magnetic Resonance in Medicine; 2018; Paris, France: 2876.
Figures