4005
Fully automated fBIRN-like stability assessment: follow-up and case report at 7T
Franck Mauconduit1, Evelyn Eger2, Chantal Ginisty3, Valérie Berland3, Yann Lecomte3, Lionel Allirol3, Lucie Hertz-Pannier3, and Alexandre Vignaud1
1NeuroSpin (UNIRS) & Université Paris-Saclay, CEA, Gif-sur-Yvette, France, 2NeuroSpin (UNICOG) & Université Paris-Saclay, CEA, Gif-sur-Yvette, France, 3NeuroSpin (UNIACT) & Université Paris-Saclay, CEA, Gif-sur-Yvette, France
1NeuroSpin (UNIRS) & Université Paris-Saclay, CEA, Gif-sur-Yvette, France, 2NeuroSpin (UNICOG) & Université Paris-Saclay, CEA, Gif-sur-Yvette, France, 3NeuroSpin (UNIACT) & Université Paris-Saclay, CEA, Gif-sur-Yvette, France
Synopsis
Functional Magnetic Resonance Imaging relies on weak blood oxygen level dependent signal variations. Therefore, it is extremely sensitive to MR scanner instabilities. A regular assessment of the device was shown to help preserving a good quality of fMRI data. It is also a powerful tool to compare systems. Here, we integrated a Quality Assessment based on fBIRN recommendations that can be automatically launched and reconstructed online to be able to immediately monitor system performances. We report cases where abnormal situations leading to suboptimal fMRI data were revealed which would have been missed if only relying on the manufacturer’s test service.
Introduction
Functional Magnetic Resonance Imaging (fMRI) relies on weak blood oxygen level dependent (BOLD) signal variations. Therefore, it is extremely sensitive to MR scanner instabilities. A regular assessment of the device was shown to help preserving a good quality of fMRI data[1]. It is also a powerful tool to compare systems. Here, we integrated a Quality Assessment (QA) based on Functional Biomedical Informatics Research Network (fBIRN) recommendations that can be automatically launched and reconstructed online to be able to immediately monitor system performances. We report cases where abnormal situations leading to suboptimal fMRI data were revealed which would have been missed if only relying on the manufacturer’s test service.Methods
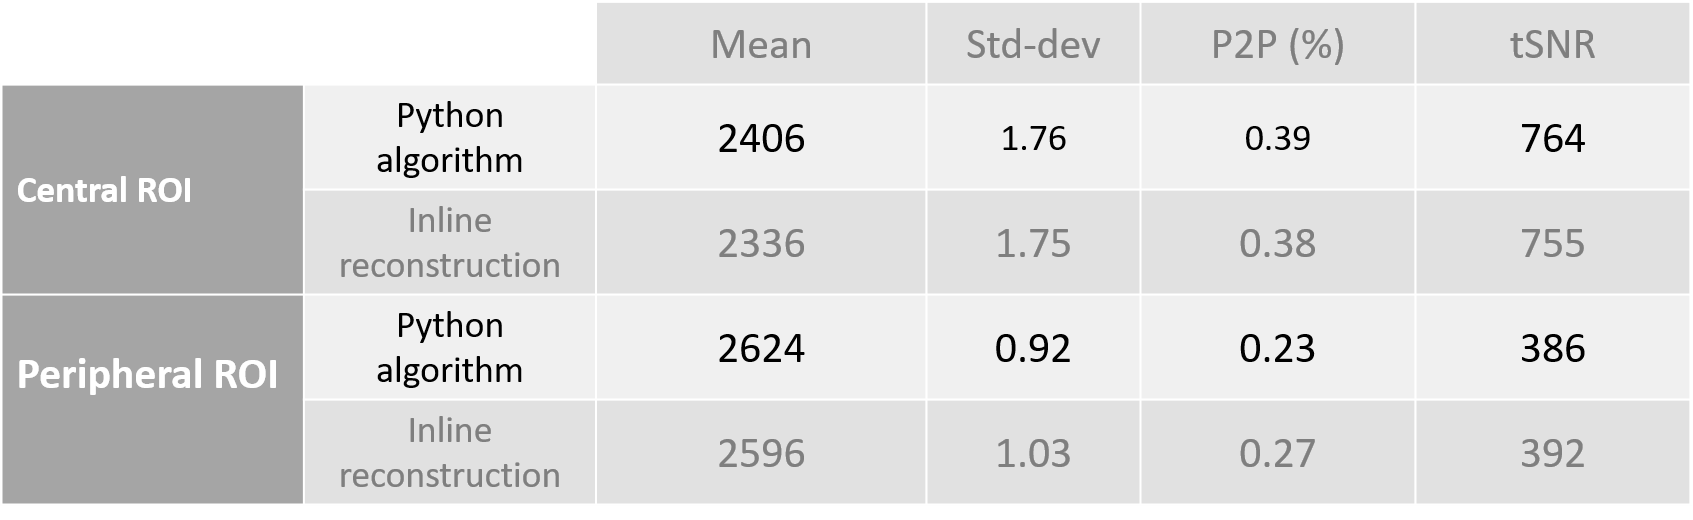
Acquisition setup: fBIRN-like QA measurements were performed once a week for three years on an investigational 7T MRI system (Siemens Healthineers, Germany, VB17) using a 1Tx/32Rx head coil (Nova Medical, Wilmington, MA, USA). A homemade agar phantom based on the recipe described in[1] was used. The phantom was carefully placed inside the coil using the coil manufacturer’s holder in order to position the phantom in a reproducible manner. A first echo-planar imaging (EPI) acquisition was performed to let the system (gradient coil, transmit–receive coil) reach a temperature equilibrium. The same EPI acquisition was repeated and all statistics were computed. Acquisition parameters were TR=2s, TE=26ms, resolution=(3.44mm)^2 with an in-plane matrix size of 64x64, 27 slices of 4mm with 25% gap, 200 repetitions and TA=6min44s. Fully automated post-processing: Two regions of interest were automatically segmented in the central slice of the spherical phantom to compute statistical values: a centered 10x10 pixels ROI and a peripheral doughnut-like ROI (Figure 1). Mean values were extracted from both ROIs along the temporal series. A detrending process was applied using a second order fit to eliminate signal drift. Detrended temporal SNR and peak-to-peak values were extracted. EPI ghosting artefact was evaluated using the centered ROI and a corresponding ROI shifted by FOV/2 in the phase direction. Follow-up results: After each QA measurement, all statistics were saved in a database. This step allowed to retrieve previous measurements and display the different statistics available over time. This follow-up information was generated in a graphical format within DICOM images. Along with the original series such as magnitude images, an additional series was generated with all QA results to easily evaluate the current system state. Another series contained the ROI masks to ensure the robustness of automatic ROI segmentations. All analyses were integrated into the Siemens Image Calculation Environment (ICE) so that no additional steps were required to perform QA post-processing apart from the acquisition procedure. Comparisons were done between our online software and the fBIRN python post-processing[2] for validation purposes (table 1).Results
Figure 2 displays results obtained for tSNR values in both centered and peripheral ROIs as well as peak-to-peak values and ghosting artefact level. During the period of QA measurements, the system underwent major hardware changes during the first semester of 2018. The head gradient insert (AC84) was replaced with a whole body gradient (SC72). During a second upgrade step, the manual table was replaced by a motorized table and the Nova coil adapted to AC84 head gradient was replaced by a standard 1Tx/32Rx Nova coil. With the help of fBIRN QA, we were able to characterize changes affecting the system performance and demonstrate the utility of the long-term follow-up QA to analyze system evolutions. In February 2019, a gradient failure occurred which required its replacement. Following the installation of an identical whole body gradient, QA results showed very similar performance in terms of stability. It can also be noted that no abnormal values were observed prior to the gradient failure with this metric. On August 29 2019, an important decrease in tSNR was measured whereas the long-term stability procedure performed by Siemens was within system specifications. Some component replacements restored a normal situation both on transmission and reception paths.Discussion & Conclusion
The QA follow-up was useful to determine whether the scanner could be used with confidence for scanning volunteers. Any abnormal results could raise attention to the system state and initiate investigations on image quality. A severe decrease in tSNR and increase in peak-to-peak value (figure 2) required hardware changes by the service engineer to recover a normal situation. Moreover, hardware changes resulted to be slightly advantageous in terms of tSNR, although a clear determination of the reason is not practically feasible. We believe that the new motorized table, less prone to vibrations, and the new coil may have affected positively tSNR. It is interesting to note that SNR measurements[3] are another important feature to characterize in a QA and is very complementary to stability assessment. Depending on the hardware malfunction, both QA types are not always able to detect at the same time an abnormal situation. MR manufacturers have their own system QA to detect abnormal situations. Having a homemade fBIRN-like QA setup showed that we could detect more accurately failures of hardware affecting system stability compared to Siemens procedures. Such a regular homemade QA can highlight possible complications earlier and facilitate initiatives for investigations. Overall, such procedures should lead to an improved quality of data acquired for fMRI.Acknowledgements
This work has received funding from the Agence Nationale pour La Recherche through the CODENUM project (ANR-14-CE13-0020). It is also supported by the Leducq Foundation (large equipment ERPT program, NEUROVASC7T project).References
[1] L. Friedman and G. H. Glover. Report on a Multicenter fMRI Quality Assurance Protocol. Journal of Magnetic Resonance Imaging, 23 :827–839, 2006. [2] Blaise F. 2011, stabilitycalc (python). https://github.com/bbfrederick/stabilitycalc.git [3] Mauconduit et al., Proc. Intl. Soc. Mag. Reson. Med. 27 (2018), 4221Figures

Figure 1: Central slice of the phantom containing the central ROI
(left), the peripheral ROI (center) and detrended tSNR map computed on a
pixel-by-pixel basis.
Table
1 – Comparison of QA results obtained using a python script [2] and our
homemade online QA. Both central and peripheral ROIs give very similar results
in terms of mean value, standard deviation, peak-to-peak value and temporal
SNR.

Figure
2: QA follow-up shows different statistical values in a timeline obtained since January
2017. Displayed quantities are: detendred tSNR values extracted from centered
ROI (A), peripheral ROI (B), peak-to-peak values for both ROIs (C) and level of
ghost artifact (D - only performed since February 2019).
Three
major hardware events are highlighted -
blue
arrow : period of important hardware change (a whole body gradient, a motorized
table and a new coil).
red
arrow : a gradient failure that required its replacement.
yellow
arrow : degraded statistics not detected by Siemens QA.