4003
Estimating the complexity of fMRI-based brain networks1Department of Radiology, University of Calgary, Calgary, AB, Canada
Synopsis
Current measures of network complexity fail to capture the structural and functional diversity of brain networks. Here we use random walks processes to obtain a time series reflecting the complex structure of functional brain networks and use this time series to construct measures of local and global complexity. We found that complexity is significantly correlated to the strength of the connections in the network. For the positively correlated network this correlation is significantly weaker at the local scale compared to the global scale, whereas for the anticorrelation network the link is stronger at the local scale.
Introduction
The complexity of brain activity has been observed at many spatial scales and there exists increasing evidence supporting its use in differentiating between mental states and disorders. However, current measures of network complexity fail to capture this structural and functional diversity of brain networks, where hierarchies of linked communities span across several spatial scales, from cortical minicolumns to large-scale networks. Here we proposed a new measure of complexity for fMRI-based networks (global complexity) that is constructed as the sum of the complexities of its nodes (i.e, local complexity).Methods
A resting-state fMRI dataset of 89 subjects from the HCP) (https://https://db.humanconnectome.org) (Van Essen et al., 2013) was used. The peak voxel in each brain region, that is, the voxel of maximal activation, was selected by computing the Root Mean Square (RMS) for each voxel's fMRI signal over all time. The peak voxel in each region is determined using previously published Talairach coordinates (after conversion to MNI coordinates and using AAL 116 atlas) (M. D. Fox et al., 2005). The resulting signal was filtered to keep only low frequency fluctuations (0.01–0.08 Hz) (Yan & Zang, 2010). Finally, the global signal (i.e., the average of the fMRI signals over the whole brain (Michael D. Fox et al., 2009)) was regressed out. We then computed the Pearson correlation between all possible pairs of time series creating a 116x116 functional connectivity matrix for each subject. Three different networks were obtained from this matrix. A network consisting of the absolute value of all connections (denoted as abs) which is the most commonly used in fMRI connectivity studies (Meier et al., 2016; Meszlényi, Hermann, Buza, Gál, & Vidnyánszky, 2017; Salvador et al., 2005), a network consisting of only the positive connections (denoted as pos), and a network comprising the absolute value of only the negative connections (denoted as neg). In all cases p-values were corrected by means of a multiple comparison analysis based on the false discovery rate (FDR) (Benjamini & Hochberg, 1995). The complexity of each node in a network (i.e, local complexity) was computed using an index that compares the sample entropy of the time series generated by the movement of a random walker on the network resulting from removing the node and its connections, to the sample entropy of the time series obtained from a regular lattice (the ordered state) and an Erdos-renyi network (disordered state). Then, the network (global) complexity was constructed as the sum of the complexities of its nodes.Results
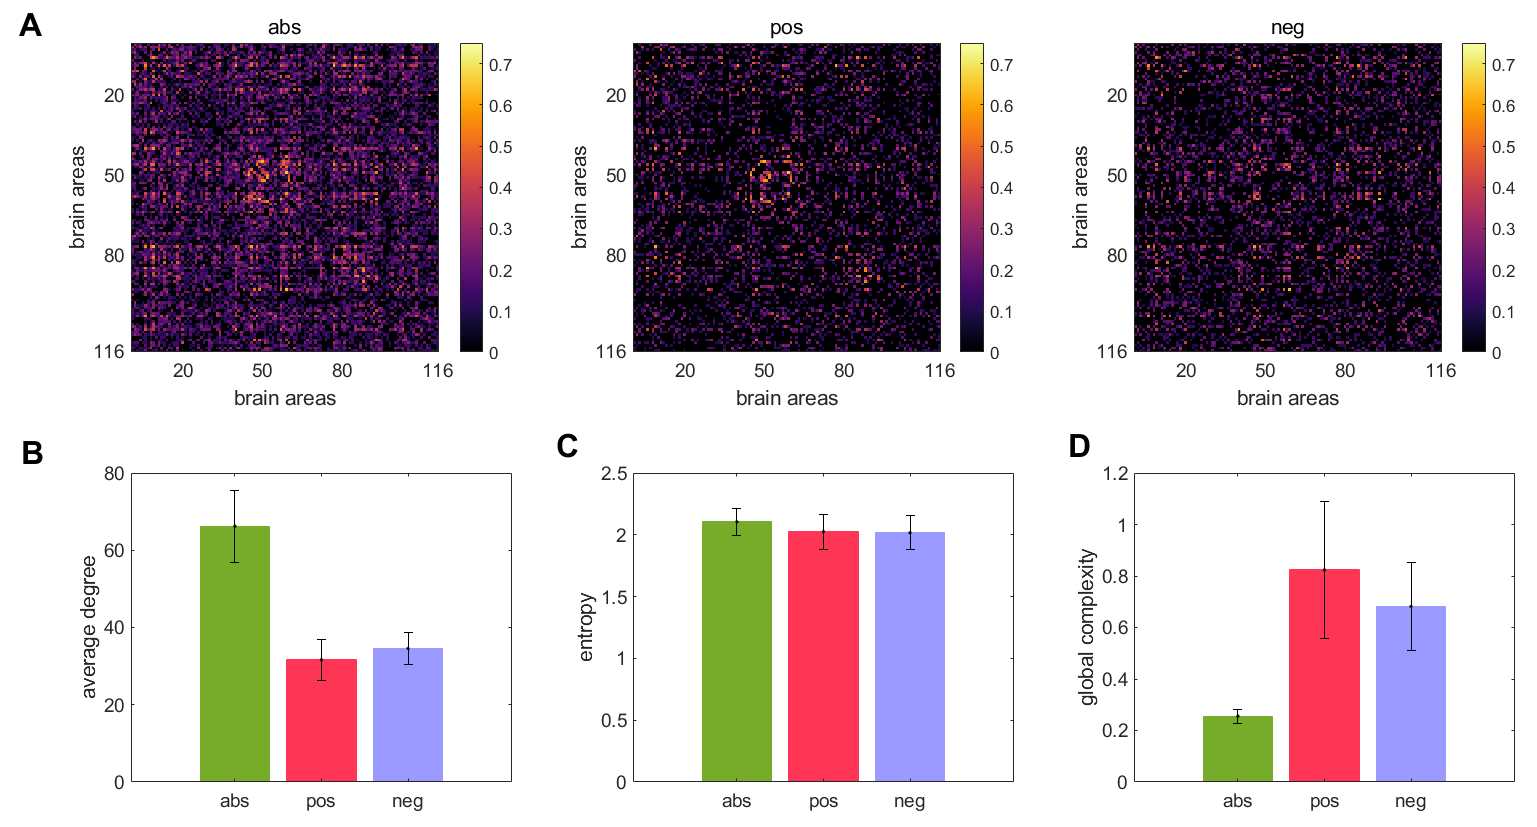
Figure 1A displays the abs, pos, and neg matrices for one subject. Figure 1B shows the node degree of the three matrices average across all subjects, figure 1C shows their entropy, and figure 1D their global complexity. Our results show that the pos matrices are sparser than the neg matrices but have approximately the same entropy. This results in the pos network having a higher global complexity than the neg matrices. The abs matrices presented the lowest global complexity of the three cases. Figure 2A shows the linear fits between the global complexity and the sum of the functional connectivity strengths (SFCS) of the entire brain network for the abs, pos, and neg cases. We found that for the pos case, there is a strong correlation (r=0.62, p=9.5e-11) between global complexity and SFCS, followed by the abs case (r=0.28, p=0.0077). The anticorrelation or neg network was not significantly correlated with SFCS (r=0.11, p=0.29). We also computed the linear fits between local complexities and the SFCS of each brain area (figure 2B). We found that for the pos case the link between complexity and functional connectivity was significantly weaker at the local scale compared to the global scale (r=0.22, p=2.0e-11). For the anticorrelation network the link was stronger at the local than at the global scale, but still weaker than for the pos case (r=0.18, p=9.5e-21). The correlation between complexity and connectivity was essentially the same at the global and local scales for the abs case (figure 2).Discussion and Conclusions
Our study of brain complexity also found interhemispheric asymmetry, where the left hemisphere was significantly more complex than the right hemisphere. Previous studies have also found interhemispheric asymmetry in brain connectivity during resting-state. For instance, a recent study used near-infrared spectroscopy (NIRS) signals to estimated functional connectivity matrices (Medvedev, 2014). Their results revealed significantly stronger and denser connectivity patterns in the right hemisphere in most subjects. This denser pattern of connections in the right hemisphere compared to the left hemisphere can lead to a lower structural complexity if it is not accompanied by a significant increase in the entropy of the network. Thus, the balance between the entropy of the network and its density determines the network’s complexity. Our results suggest that the pos network is related to the information processing in the brain and should be used for functional connectivity analysis instead of the abs network as is commonly done.Acknowledgements
This work was partially supported by grant RGPIN-2015-05966 from Natural Sciences and Engineering Research Council of Canada. Data were provided [in part] by the Human Connectome Project, WU-Minn Consortium (Principal Investigators: David Van Essen and Kamil Ugurbil; 1U54MH091657) funded by the 16 NIH Institutes and Centers that support the NIH Blueprint for Neuroscience Research; and by the McDonnell Center for Systems Neuroscience at Washington University.References
Benjamini, Y., & Hochberg, Y. (1995). Controlling the False Discovery Rate: A Practical and Powerful Approach to Multiple Testing. Source: Journal of the Royal Statistical Society. Series B (Methodological) (Vol. 57).
Medvedev, A. V. (2014). Does the resting state connectivity have hemispheric asymmetry? A near-infrared spectroscopy study. NeuroImage, 85 Pt 1(0 1), 400–407. https://doi.org/10.1016/j.neuroimage.2013.05.092
Meier, J., Tewarie, P., Hillebrand, A., Douw, L., van Dijk, B. W., Stufflebeam, S. M., & Van Mieghem, P. (2016). A Mapping Between Structural and Functional Brain Networks. Brain Connectivity, 6(4), 298–311. https://doi.org/10.1089/brain.2015.0408
Meszlényi, R. J., Hermann, P., Buza, K., Gál, V., & Vidnyánszky, Z. (2017). Resting State fMRI Functional Connectivity Analysis Using Dynamic Time Warping. Frontiers in Neuroscience, 11, 75. https://doi.org/10.3389/fnins.2017.00075
Fox, M. D., Snyder, A. Z., Vincent, J. L., Corbetta, M., Van Essen, D. C., & Raichle, M. E. (2005). The human brain is intrinsically organized into dynamic, anticorrelated functional networks. Proceedings of the National Academy of Sciences, 102(27), 9673–9678. https://doi.org/10.1073/pnas.0504136102
Fox, Michael D., Zhang, D., Snyder, A. Z., & Raichle, M. E. (2009). The Global Signal and Observed Anticorrelated Resting State Brain Networks. Journal of Neurophysiology, 101(6), 3270–3283. https://doi.org/10.1152/jn.90777.2008
Salvador, R., Suckling, J., Coleman, M. R., Pickard, J. D., Menon, D., & Bullmore, E. (2005). Neurophysiological Architecture of Functional Magnetic Resonance Images of Human Brain. Cerebral Cortex, 15(9), 1332–1342. https://doi.org/10.1093/cercor/bhi016
Van Essen, D. C., Smith, S. M., Barch, D. M., Behrens, T. E. J., Yacoub, E., Ugurbil, K., & WU-Minn HCP Consortium. (2013). The WU-Minn Human Connectome Project: An overview. NeuroImage, 80, 62–79. https://doi.org/10.1016/j.neuroimage.2013.05.041
Yan, C., & Zang, Y. (2010). DPARSF: a MATLAB toolbox for “pipeline” data analysis of resting-state fMRI. Frontiers in System Neuroscience, 4, 13. https://doi.org/10.3389/fnsys.2010.00013
Figures