3995
Investigating Mechanisms Underlying Autism Spectrum Disorders with Resting State fMRI Signal Complexity Metrics1Emory University, Atlanta, GA, United States
Synopsis
Autism spectrum disorders (ASD) are characterized by impairments in social cognition, and oxytocin (OXT) system dysregulation. In this study, we employed resting state fMRI to examine brain function impairments in adult ASD, and the effects of OXT treatment. ASD patients exhibited increased fMRI signal complexity in social cognition and reward networks compared to healthy controls: indicating increased synaptic noise as a putative mechanism underlying ASD. Intranasal administration of OXT decreased synaptic noise in these regions, while increasing excitability of prefrontal cortex (PFC); thus indicating increased inhibitory control mediated through PFC as the mechanism underlying OXT induced brain rehabilitation in ASD.
INTRODUCTION
Autism spectrum disorder (ASD) is a neurodevelopmental disorder characterized by impairments in social interactions and communication, as well as repetitive behaviors and restricted interests 1. ASD is characterized by deficits in social cognition, face processing, theory of mind (ToM), and emotional regulation functions 1-3. Dysregulation of endogenous oxytocin (OXT) function has been reported in ASD 4, and its exogenous application was shown to enhance social functioning in ASD 5. ASD is considered to be caused by disruptions in the brain’s excitation/inhibition (E/I) balance 6. OXT is also thought to enhance social cognition through its effects on GABA mediated control of E/I balance 6. Recently, an fMRI time-series signal complexity metric, multi-scale entropy (MSE) has been proposed as a potential biomarker of E/I balance and neural activity 7-9. In this study, we employed MSE of resting state fMRI (rsfMRI) data to examine brain function impairments in ASD, and the effects of oxytocin treatment on ASD.METHODS
Thirty adult males with ASD (mean age ~ 29 years) were administered OXT and placebo intranasally in separate MR imaging sessions, in a double-blind study. The ASD patients and 17 age matched healthy controls (not administered OXT or placebo) were scanned in a Siemens 3T MRI Prisma-Fit scanner using a 64-channel Rx head+neck coil. Written informed consent was obtained from all participants in the protocol approved by the local Institutional Review Board. RsMRI data were acquired with a 8-min whole-brain gradient echo EPI (TR/TE/FA = 3000ms/25ms/90°, resolution = 1.5mm x 1.5mm x 2.4mm). RsfMRI preprocessing steps included attenuation of signal related to subject-motion and physiological responses, using the AROMA technique 10, spatial normalization to MNI152 space, and spatial smoothing with FWHM = 6mm isotropic Gaussian kernel. Voxelwise sample entropy (SE) maps were evaluated at 10 temporal scales using the Complexity toolbox 7,8. The window-length (m) for MSE calculations was set to 2. In order to find the optimal distance threshold (r), MSE was evaluated at m=2, and r = 0.1 x SD to 1.0 x SD, in steps of 0.1 x SD (where SD was the standard deviation of the rsfMRI time-series) for all the healthy control subjects (HC) rsfMRI datasets. Voxel MSEs were averaged across all grey matter voxels of all HCs. The plot of AUC of the resultant average MSE as a function of r, exhibited a maximum at r = 0.3 x SD, which was set as the optimal distance threshold for MSE calculations for all subjects. These MSE parameters are similar to those obtained in other equivalent rsfMRI studies 7,8. Between-group, and between-session differences in complexity were obtained with separate 2-sample (and paired) t-tests for each scale’s SE, as well as for AUC of SE over scales 4-10, and AUC of SE over scales 1-2 (see Results). The resultant t-statistic maps were clustered and the inferences were corrected for multiple comparisons (mcc) through Monte-Carlo simulations explicitly accounting for the spatial correlation of second-level analysis residuals 11.RESULTS & DISCUSSION
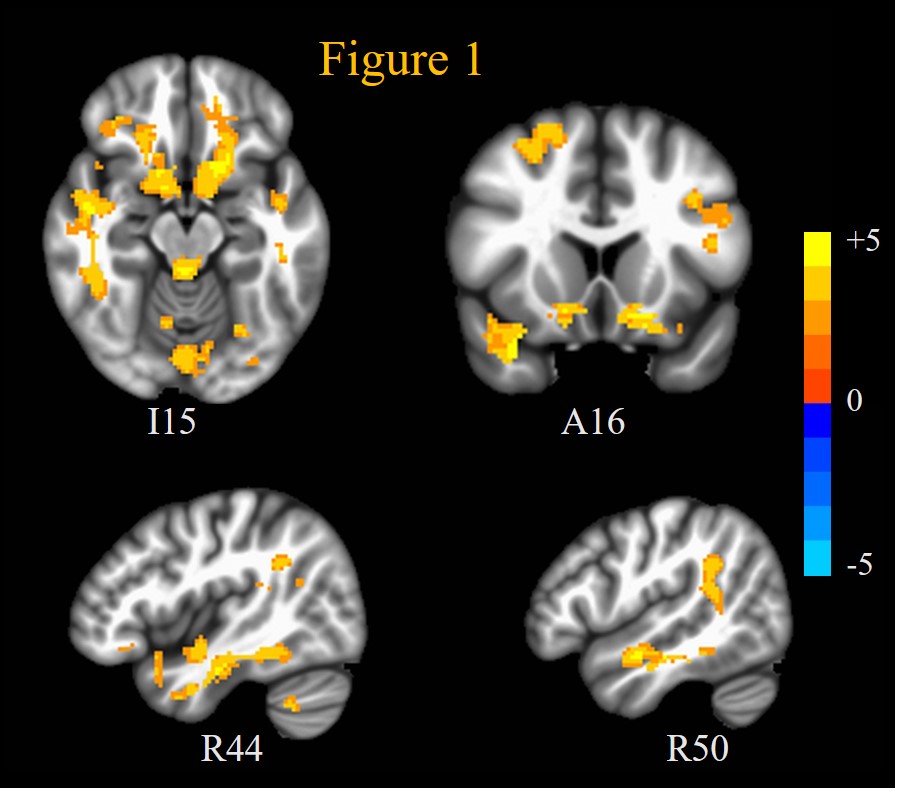
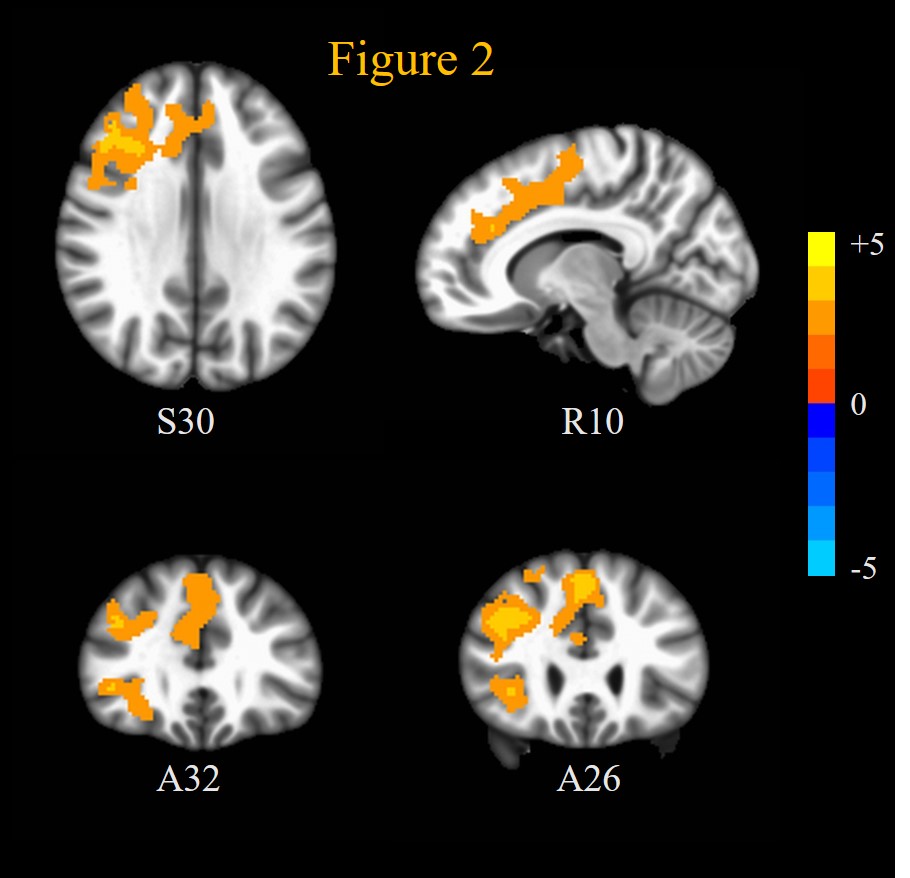
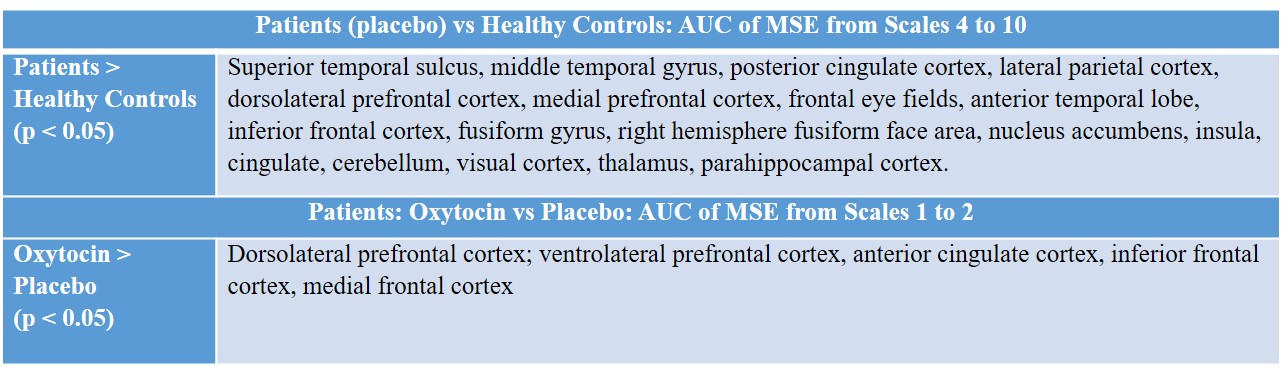
ASD patients exhibited significantly (mcc p < 0.05) increased SE compared to HC at scales 4 to 10 in a lot of brain regions implicated in ASD during placebo: including superior temporal sulcus, middle temporal gyrus, and posterior cingulate cortex in the ToM network; fusiform face area and inferior frontal cortex in face processing network; and ventral striatum and medial prefrontal cortex in reward processing network. This is displayed through the AUC of the MSE over scales 4 to 10 (AUCSE4-10) in Figure 1 and Table 1. OXT induced reduced (though not significant at p < 0.05) AUCSE4-10 compared to placebo in ASD patients in these regions (not shown). This increased fMRI signal complexity in ASD patients compared to HC in social cognition, ToM, face processing networks and reward circuits could reflect increased synaptic noise due to synaptic pruning deficits that are known to afflict ASD 12.On the other hand, OXT induced increased (mcc p < 0.05) SE at scales 1 and 2, and AUCSE1-2 compared to placebo in (Figure 2, Table 1) dorsolateral and ventrolateral prefrontal cortices, as well anterior cingulate cortex, frontal eye fields and medial frontal cortex. Interestingly, ASD patients’ rsfMRI signal complexity under OXT at short scales (AUCSE1-2) was higher (though not significant at p < 0.05) than that of HCs in these same regions. This indicates that the improvements in brain functional status in ASD in response to OXT 5 could arise from increased inhibitory control through alteration of E/I balance in PFC 13 which has been shown to alter MSE at short temporal scales 14. OXT has been shown to affect GABA-mediated E/I control 6.
CONCLUSION
The results from this study implicate disturbances in E/I balance (potentially caused by synaptic pruning deficits) in a number brain regions including those involved in social cognition and reward processing in ASD. OXT seems to attenuate this E/I imbalance through its action on frontal lobe regions. These results also indicate that fMRI signal complexity measures like MSE could act as diagnostic and therapeutic biomarkers of ASD. Future work will focus on examining the OXT dose response relationship on ASD brain function and E/I balance and how this is influenced by patient-specific OXT receptor epigenetics.Acknowledgements
This work was supported by NIH grants P50MH100023, ORIP/OD P51OD011132, and UL1TR002378; as well as a pilot grant from Emory University Center for Mind, Brain, and Culture.References
1. Arnold Anteraper S, Guell X, D'Mello A, Joshi N, Whitfield-Gabrieli S, Joshi G. Disrupted Cerebrocerebellar Intrinsic Functional Connectivity in Young Adults with High-Functioning Autism Spectrum Disorder: A Data-Driven, Whole-Brain, High-Temporal Resolution Functional Magnetic Resonance Imaging Study. Brain Connect 2019;9:48-59.
2. Yarkoni T, Poldrack RA, Nichols TE, Van Essen DC, Wager TD. Large-scale automated synthesis of human functional neuroimaging data. Nat Methods 2011;8:665-70.
3. Foss-Feig JH, Adkinson BD, Ji JL, et al. Searching for Cross-Diagnostic Convergence: Neural Mechanisms Governing Excitation and Inhibition Balance in Schizophrenia and Autism Spectrum Disorders. Biol Psychiatry 2017;81:848-61.
4. Yamasue H, Domes G. Oxytocin and Autism Spectrum Disorders. Curr Top Behav Neurosci 2018;35:449-65.
5. Ooi YP, Weng SJ, Kossowsky J, Gerger H, Sung M. Oxytocin and Autism Spectrum Disorders: A Systematic Review and Meta-Analysis of Randomized Controlled Trials. Pharmacopsychiatry 2017;50:5-13.
6. Lopatina OL, Komleva YK, Gorina YV, et al. Oxytocin and excitation/inhibition balance in social recognition. Neuropeptides 2018;72:1-11.
7. Wang DJJ, Jann K, Fan C, et al. Neurophysiological Basis of Multi-Scale Entropy of Brain Complexity and Its Relationship With Functional Connectivity. Front Neurosci 2018;12:352.
8. Smith RX, Yan L, Wang DJ. Multiple time scale complexity analysis of resting state FMRI. Brain Imaging Behav 2014;8:284-91.
9. McDonough IM, Nashiro K. Network complexity as a measure of information processing across resting-state networks: evidence from the Human Connectome Project. Front Hum Neurosci 2014;8:409. 10. Pruim RH, Mennes M, van Rooij D, Llera A, Buitelaar JK, Beckmann CF. ICA-AROMA: A robust ICA-based strategy for removing motion artifacts from fMRI data. Neuroimage 2015;112:267-77.
11. Gopinath K, Krishnamurthy V, Sathian K. Accounting for Non-Gaussian Sources of Spatial Correlation in Parametric Functional Magnetic Resonance Imaging Paradigms I: Revisiting Cluster-Based Inferences. Brain Connect 2018;8:1-9.
12. Tang G, Gudsnuk K, Kuo SH, et al. Loss of mTOR-dependent macroautophagy causes autistic-like synaptic pruning deficits. Neuron 2014;83:1131-43.
13. Homayoun H, Moghaddam B. NMDA receptor hypofunction produces opposite effects on prefrontal cortex interneurons and pyramidal neurons. J Neurosci 2007;27:11496-500.
14. Gopinath K, Maltbie E, Howell L, Sun P. Examining fMRI time-series Multi-Scale Entropy as a Biomarker for Excitation/Inhibition Balance in the Brain. Proc Intl Soc Mag Reson Med 2019;27:3693.
Figures