3994
An ICA-based approach to study altered resting state functional networks in brain tumors
Manuela Moretto1,2, Erica Silvestri1,2, Marco Castellaro1,2, Mariagiulia Anglani3, Silvia Facchini1,4, Elena Monai1,4, Domenico D'Avella1,4, Alessandro Della Puppa5, Diego Cecchin1,6, Maurizio Corbetta1,4,7, and Alessandra Bertoldo1,2
1Padova Neuroscience Center, University of Padova, Padova, Italy, 2Department of Information Engineering, University of Padova, Padova, Italy, 3Neuroradiology Unit, University of Padova, Padova, Italy, 4Department of Neuroscience, University of Padova, Padova, Italy, 5Department of Neurosurgery, Neuroscience, Psychology, Pharmacology, and Child Health, University of Firenze, Firenze, Italy, 6Department of Medicine, Unit of Nuclear Medicine, University of Padova, Padova, Italy, 7Department of Neurology, Radiology, Neuroscience, Washington University School of Medicine, St Louis, MO, United States
1Padova Neuroscience Center, University of Padova, Padova, Italy, 2Department of Information Engineering, University of Padova, Padova, Italy, 3Neuroradiology Unit, University of Padova, Padova, Italy, 4Department of Neuroscience, University of Padova, Padova, Italy, 5Department of Neurosurgery, Neuroscience, Psychology, Pharmacology, and Child Health, University of Firenze, Firenze, Italy, 6Department of Medicine, Unit of Nuclear Medicine, University of Padova, Padova, Italy, 7Department of Neurology, Radiology, Neuroscience, Washington University School of Medicine, St Louis, MO, United States
Synopsis
Brain tumors can
alter not only functions located in the perilesional area, but also the distal
ones. Thus, the possibility to inform preoperatively surgeons about the state
of preservation/alteration of a network could be a powerful aid for a better
patient outcome. In this work we used independent component analysis (ICA) to
map resting state networks (RSNs) at the single-subject level characterizing
their alterations in terms of cosine similarity spatial patterns. Comparing the
patient-specific spatial maps with those obtained for a group of healthy
controls, we defined the presence of an alteration for each of the 44 analyzed
RSNs.
INTRODUCTION
Brain tumors are considered an expansive source in terms of diagnostic and treatment technologies needed to treat them1. Gross total resection (GTR) is the gold standard in brain tumor therapy leading to a better patient outcome and a prolonged survival2. However, GTR needs to be balanced with brain functions deficits3. Recents studies4,5,6 have proposed resting state (rs) functional connectivity as a tool to map these functions, but unfortunately they restrict the mapping to eloquent functions located in the perilesional area, overlooking distal regions that could be altered by brain tumors7. Here we propose a whole brain approach, based on independent component analysis (ICA), to identify altered or preserved resting state networks (RSNs), without a priori localization of the lesion.METHODS
Pre-surgical data were collected from 18 patients (8F/10M; age 57.88±18.09y) diagnosed with brain tumors. Healthy controls (HC) consisted of 308 subjects (125F/183M; age 36.96±18.40y) of the publicly available MPI-Leipzig Mind-Brain-Body dataset8. Patients data were acquired on a 3T Siemens Biograph mMR scanner. The imaging protocol included a T1-weighted 3D-MPRAGE (TR/TE 2400/3.24ms; TI 1000ms; 1x1x1mm), a 3D-FLAIR (TR/TE 3200/535ms; 1x1x1mm), rs-fMRI scans acquired with EPI (TR/TE 1260/30ms; 3x3x3mm; 750 volumes; flip angle 68°; MBAccFactor 2; iPAT 0) and two spin echo-EPI acquisitions with opposed phase encoding (TR/TE 4200/70ms; 3x3x3mm). The HC data acquisition protocol is described in8. In brief, it included a T1-weighted 3D-MP2RAGE (TR/TE 5000/2.92ms; TI1/TI2 700/2500ms), rs-fMRI scans (TR/TE 1400/39.4ms; 2.3x2.3x2.3mm; 657 volumes; flip angle 69°; MBAccFactor 4) and two spin echo acquisitions (TR/TE 2200/52ms; 2.3x2.3x2.3mm). Imaging data of both groups underwent an analogous structural and functional pre-processing. For each patient, 3D-FLAIR image was employed to manually segment the tumor. Structural pre-processing was applied to the T1w image for the oncological dataset, and to a pseudo-T1w image, obtained by multiplying the T1w 3D-MP2RAGE image with its second inversion time, for the HC group. The following steps were performed: bias field correction (N4BiasFieldCorrection9), skull-stripping (MASS10), non-linear registration11 to the symmetric MNI 2009c atlas12 excluding the tumor mask as suggested in13. Functional pre-processing of rs-fMRI data included slice timing14, distortion (TOPUP15) and motion correction (MCFLIRT16) and non-linear registration to the symmetric MNI atlas17. Functional pre-processed data were then analyzed with the GIFT toolbox (http://trendscenter.org/software/gift/). To achieve a functional parcellation of the main RSNs, we performed a group-level spatial-ICA with a high number (180) of independent components (ICs) as in18 on a subset of 140 HC. We visually inspected the spatial maps and the power spectra of the group 180 ICs18,19 and selected 44 RSNs. The RSNs were then grouped into 9 categories according to their functional properties: visual (VIS), sensorimotor (SM), auditory (AUD), cingolo-opercularis (CO), dorsal-attention (DA), fronto-parietal (FP), default-mode (DMN), cognitive-control (CC), frontal (FR). Starting from the group ICs we computed RSNs subject-specific spatial maps using the group-information guided ICA (GIG-ICA) back-reconstruction algorithm20. For each patient/control and each RSN, the alteration was evaluated with the cosine similarity measure (CSM), computed between the group and the individual map within the RSN group mask thresholded with a z-score of 1. To assess the significance of the RSNs alteration, we performed a statistical test based on the generation of 50000 random permutations (H0: no difference between the HC group and patient, significance level=0.1). For each permutation we compared the CSM distribution of 130 out of 140 HC against the single-patient CSM value, using a 3 standard deviations threshold to reject H0. Furthermore, the spatial overlap between the tumor and the altered RSN maps was calculated normalizing them by the extension of each RSN separately.RESULTS AND DISCUSSION
For each patient, figure 2 shows which of the RSNs resulted to be altered. Globally, the VIS was altered in 66.67% of all patients, the SM in 0%, the AUD in 0%, the CO in 33.33%, the DA in 38.89%, the FP in 83.33%, the DMN in 44.44%, the CC in 83.33%, the FR in 44.44%. Figure 3 shows the spatial map of a representative RSN, obtainedin HC at the group level, and at the subject level for three patients with different alteration grades: patient 1 had no alteration, patient 3 a medium level and patient 18 a high level. Especially for patient 18, it is clear how the presence of the tumor alters the RSN spatial pattern also in distal areas. As reported in fig 4, the spatial overlap between the tumor and the RSNs resulted to be small (range: 0-0.44), confirming that the alteration is not only due to the presence of the lesion in the perilesional area but also at distance.CONCLUSION
The CSM resulted to be a sensitive index to highlight the variations in RSNs spatial patterns.The proposed ICA-based approach is able to detect these alterations to better characterize the functional connectivity at the whole brain level in brain tumors patients resulting in an additive aid in the pre-surgical planning.Acknowledgements
References
- GBD 2016 Brain and Other CNS Cancer Collaborators, A. P. et al. Global, regional, and national burden of brain and other CNS cancer, 1990-2016: a systematic analysis for the Global Burden of Disease Study 2016. Lancet. Neurol. 18, 376–393 (2019).
- Kreth, F.-W. et al. Gross total but not incomplete resection of glioblastoma prolongs survival in the era of radiochemotherapy†. Ann. Oncol. 24, 3117–3123 (2013).
- Ghinda, D. C., Wu, J. S., Duncan, N. W. & Northoff, G. How much is enough—Can resting state fMRI provide a demarcation for neurosurgical resection in glioma? Neurosci. Biobehav. Rev. 84, 245–261 (2018).
- Esposito, R. et al. Modifications of Default-Mode Network Connectivity in Patients with Cerebral Glioma. PLoS One 7, e40231 (2012).
- Zhang, D. et al. PREOPERATIVE SENSORIMOTOR MAPPING IN BRAIN TUMOR PATIENTS USING SPONTANEOUS FLUCTUATIONS IN NEURONAL ACTIVITY IMAGED WITH FUNCTIONAL MAGNETIC RESONANCE IMAGING. Oper. Neurosurg. 65, ons226-ons236 (2009).
- Ghumman, S., Fortin, D., Noel-Lamy, M., Cunnane, S. C. & Whittingstall, K. Exploratory study of the effect of brain tumors on the default mode network. J. Neurooncol. 128, 437–44 (2016).
- Harris, R. J. et al. Altered functional connectivity of the default mode network in diffuse gliomas measured with pseudo-resting state fMRI. J. Neurooncol. 116, 373–379 (2014).
- Mendes, N. et al. A functional connectome phenotyping dataset including cognitive state and personality measures. bioRxiv 164764 (2017). doi:10.1101/164764
- Tustison, N. J. et al. N4ITK: improved N3 bias correction. IEEE Trans. Med. Imaging 29, 1310–20 (2010).
- Doshi, J., Erus, G., Ou, Y., Gaonkar, B. & Davatzikos, C. Multi-atlas skull-stripping. Acad. Radiol. 20, 1566–76 (2013).
- Avants, B. B. et al. A reproducible evaluation of ANTs similarity metric performance in brain image registration. Neuroimage 54, 2033–44 (2011).
- Fonov, V. et al. Unbiased average age-appropriate atlases for pediatric studies. Neuroimage 54, 313–327 (2011).
- Andersen, S. M., Rapcsak, S. Z. & Beeson, P. M. Cost function masking during normalization of brains with focal lesions: Still a necessity? Neuroimage 53, 78–84 (2010).
- Smith, S. M. et al. Advances in functional and structural MR image analysis and implementation as FSL. in NeuroImage (2004). doi:10.1016/j.neuroimage.2004.07.051
- Andersson, J. L. R., Skare, S. & Ashburner, J. How to correct susceptibility distortions in spin-echo echo-planar images: Application to diffusion tensor imaging. Neuroimage 20, 870–888 (2003).
- Jenkinson, M. Improved Optimization for the Robust and Accurate Linear Registration and Motion Correction of Brain Images. Neuroimage 17, 825–841 (2002).
- Greve, D. N. & Fischl, B. Accurate and robust brain image alignment using boundary-based registration. Neuroimage 48, 63–72 (2009).
- Damaraju, E. et al. Dynamic functional connectivity analysis reveals transient states of dysconnectivity in schizophrenia. NeuroImage Clin. 5, 298–308 (2014).
- Griffanti, L. et al. ICA-based artefact removal and accelerated fMRI acquisition for improved resting state network imaging. Neuroimage 95, 232–47 (2014).
- Du, Y. & Fan, Y. Group information guided ICA for fMRI data analysis. Neuroimage 69, 157–197 (2013).
Figures

Figure 1: Scheme of the
processing pipeline: HC data underwent both structural and functional
pre-processing, spatial group-ICA with 180 ICs and GIG-ICA back-reconstruction
at the subject level from which the CSM was obtained both at subject level and
at the group level; patients data underwent both structural and functional
pre-processing and GIG-ICA back-reconstruction to obtain the CSM at the subject
level.
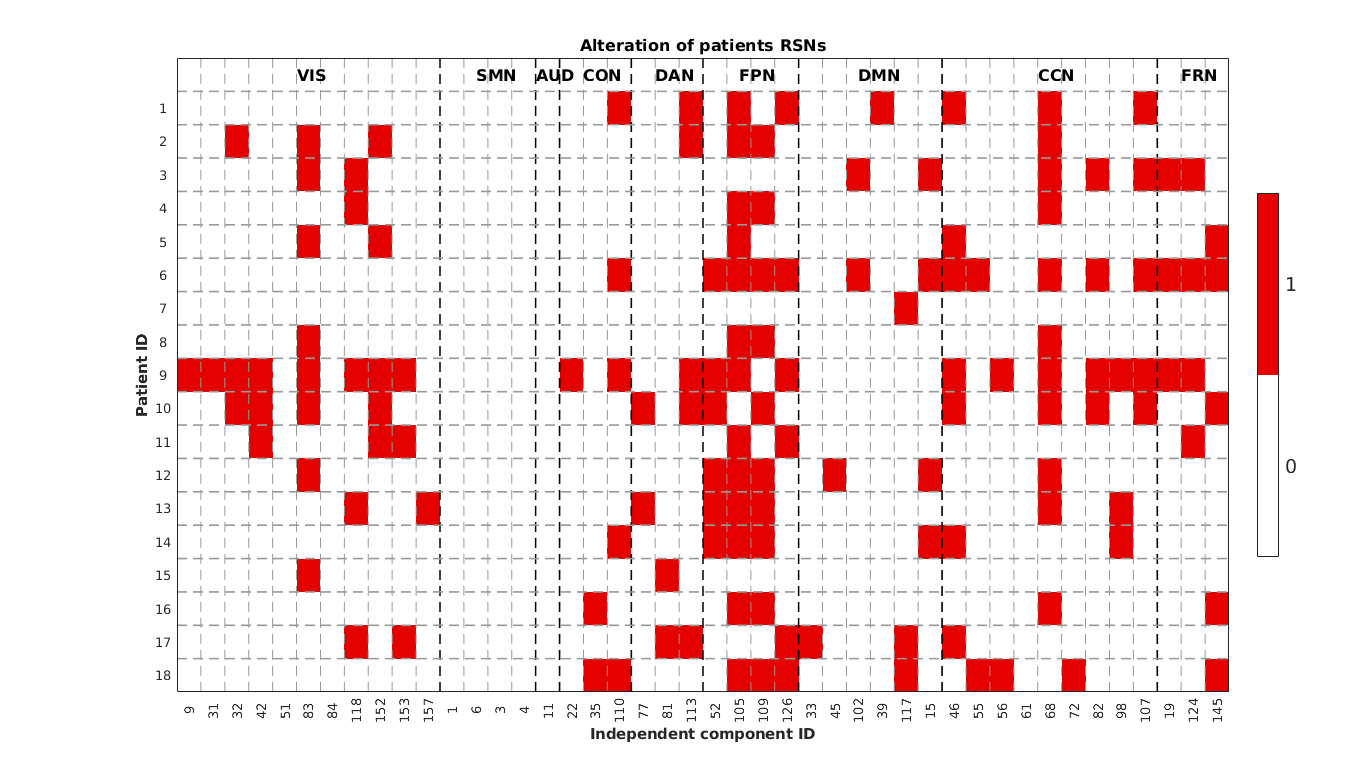
Figure 2: Table
showing on the x-axis the 44 ICs divided in the 9 categories (VIS, SMN, AUD,
CON, DAN, FPN, DMN, CCN, FRN) and on the y-axis the patient ID. The figure
shows the presence (in red) or not (in white) of the alteration for each
patient.
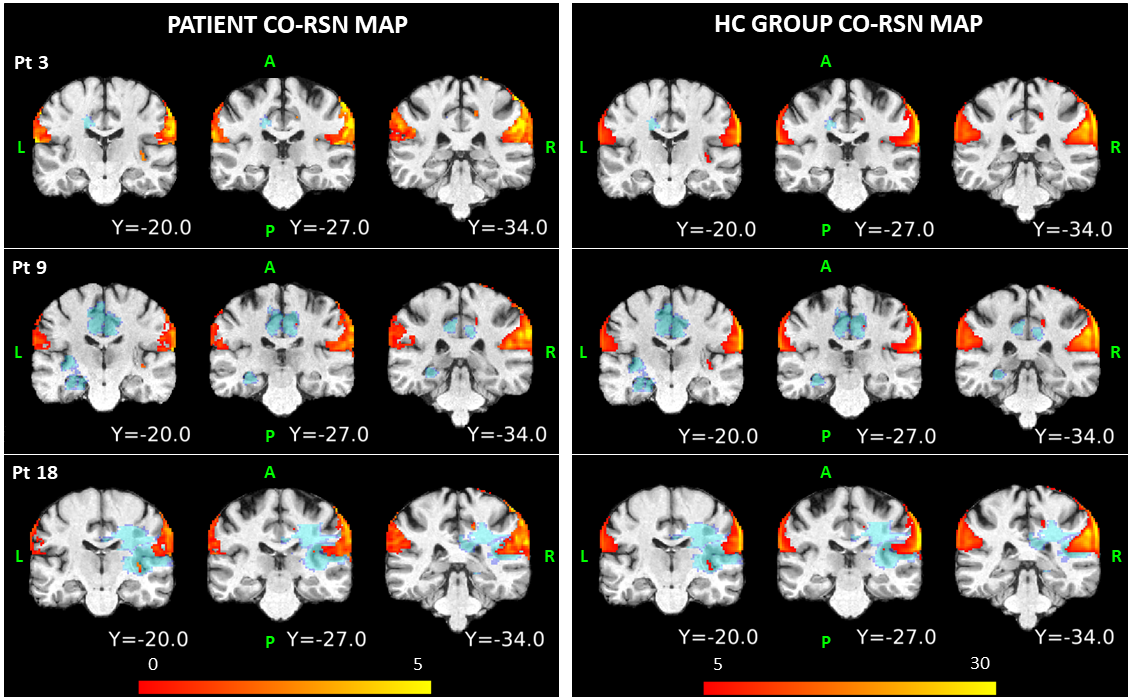
Figure 3: Coronal views of the
3D-FLAIR tumor mask (in blue) with the CSM spatial patterns (in hot scale) of
RSN 110 assigned to the CO category, superimposed on the T1w image in the MNI
space. The spatial maps are displayed for three different patients (first
column) and for the HC (second column). For visualization issues, z-score
values range from 0 to 5 for the patients and from 5 to 30 for the HC, even
though the analyses were carried out taking a z-score threshold for the HC maps
to 1.
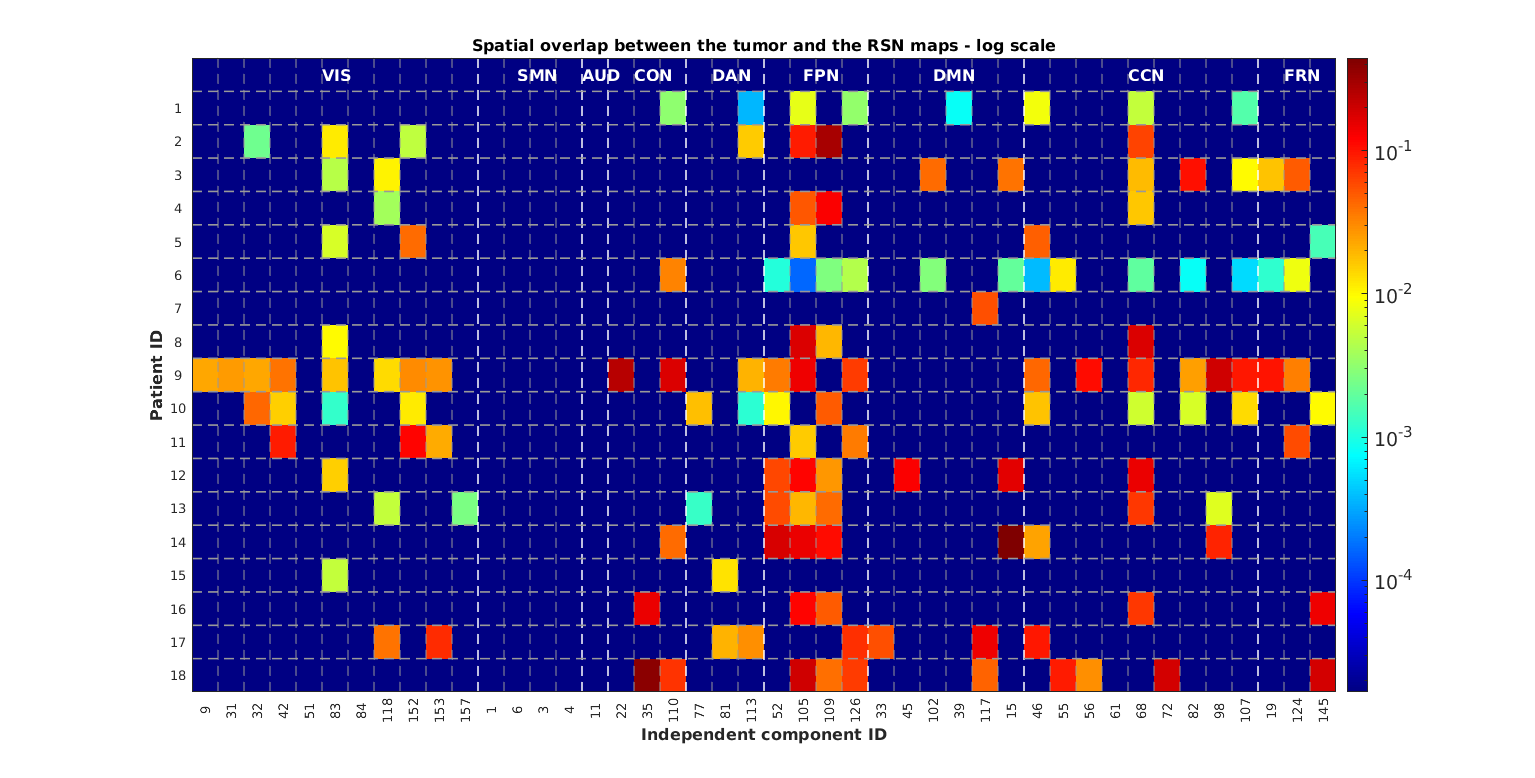
Figure 4: Table
showing on the x-axis the 44 ICs divided in the 9 categories (VIS, SMN, AUD,
CON, DAN, FPN, DMN, CCN, FRN) and on the y-axis the patient ID. The figure
shows the logarithmic values of the spatial overlap between the tumor and the
altered RSN maps, normalized by the extension of each RSN separately.