3991
Different States of Dynamic Changes in Brain Functional Network Connectivity in Patients with Obsessive-compulsive Disorder1Huaxi MR Research Center (HMRRC), Functional and molecular imaging Key Laboratory of Sichuan Province, Department of Radiology, West China Hospital, Sichuan University, Chengdu, China, 2Department of Psychiatry, West China Hospital of Sichuan University, Chengdu, China
Synopsis
This study explored the temporal variability of functional connectivity among the brain networks in obsessive-compulsive disorder (OCD) patients. First, dynamic analysis suggested four distinct connectivity states. Relative to controls, OCD patients showed more frequent and larger-scale within and between-network connectivity changes at state II, whereas less frequent and smaller-scale between-network connectivity alterations appeared at state I and IV. Second, this study suggested a new network dysconnectivity model between SMN, DMN, cerebellum and visual network for OCD patients. These findings demonstrated the dynamic changes of brain network connectivity patterns in OCD, providing a new insight into OCD-related brain functional network alterations.
Introduction
Obsessive-compulsive disorder (OCD), a debilitating and disabling disorder affects approximately 2-3% of the population1, is characterized by disruption among large-scale functional brain networks. Previous functional connectivity study provided evidence for general dysconnectivity within and between networks mainly focus on the default mode, salience and fronto-parietal networks in OCD patients2. However, evidence from many studies had supported the idea of temporal dynamic properties of functional connectivity in resting state3. The dynamic analysis holds the promise to reveal the temporal variability of intrinsic brain organization. Here, we aimed to explore the dynamic changes of whole-brain functional network connectivity (FNC) occurring in temporal succession using sliding window analysis method and combining independent component analysis (ICA) to evaluate the characteristic connectivity patterns in OCD patients.Materials and methods
A total of 87 OCD patients and 90 sex- and age- matched HCs participated in this study (Table.1). OCD patients were diagnoses on the basis of the Structured Clinical Interview for DSM-IV Axis I disorders(SCID).Resting-state fMRI was performed via a 3-Telsa GE MRI system. The images were obtained via a gradient-echo EPI sequence with the following parameters: time repetition = 2000ms, time echo = 30 ms, flip angle = 90°, slice thickness = 5mm with no slice gap, field of view = 240 × 240 mm2, 30 axial slices, 200 volumes in each run. The rs-fMRI data was preprocessed using Data Processing Assistant for Resting-State fMRI (DPARSF, http://www.restfmri.net, version 4.4). The relatively high model order ICA analysis was performed using the GIFT toolbox (http://mialab.mrn.org/software/gift/) to estimate 100 functionally independent components. Additional post-processing steps were performed using GIFT toolbox. The dynamic FNC analysis was estimated using dynamic FNC toolbox available in the GIFT toolbox package. The sliding window size was 22 TRs (44 seconds); sliding in steps of 1TR, resulting in 168 consecutive windows across the entire scan. To assess the dynamic FNC states, we applied the k-means clustering, the number of states was determined using the elbow criterion of the cluster validity index. Two sample t-test was used for each dynamic FNC states. Statistical height threshold of false discovery rate correction (P < 0.05).
Results
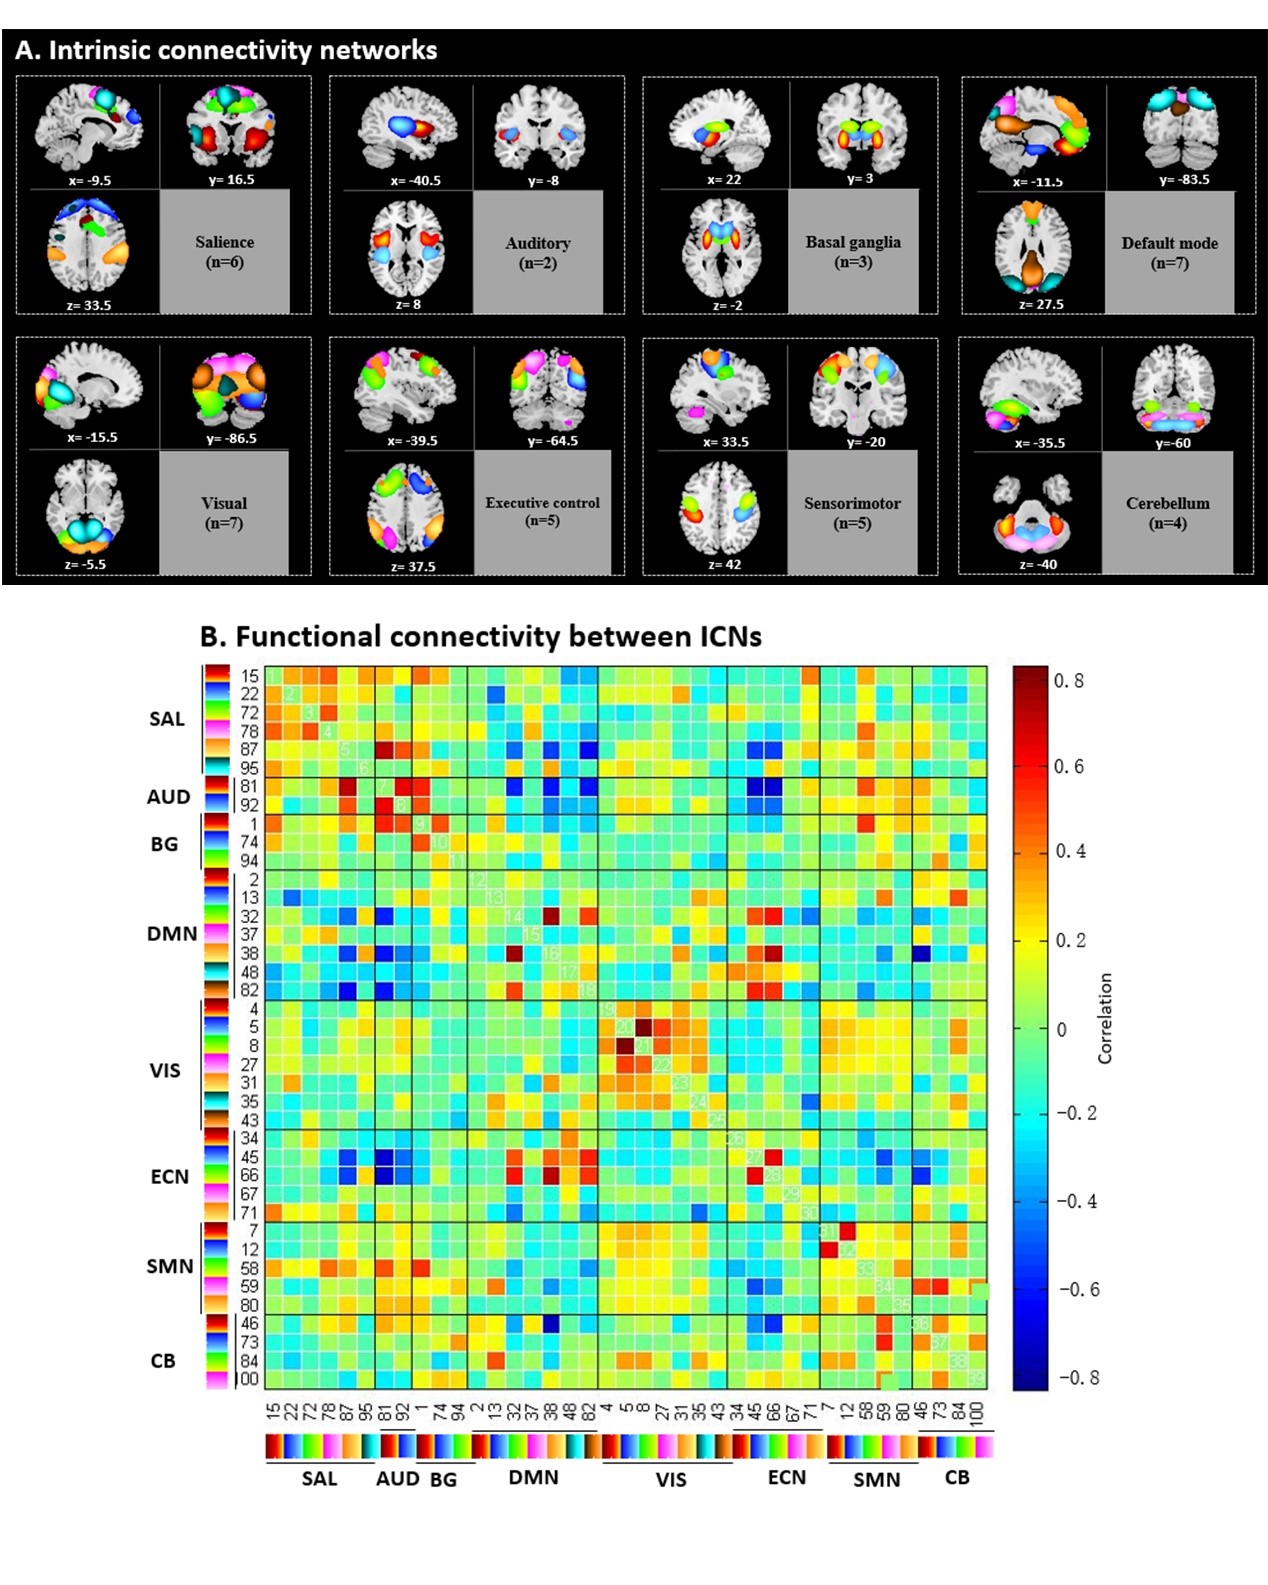
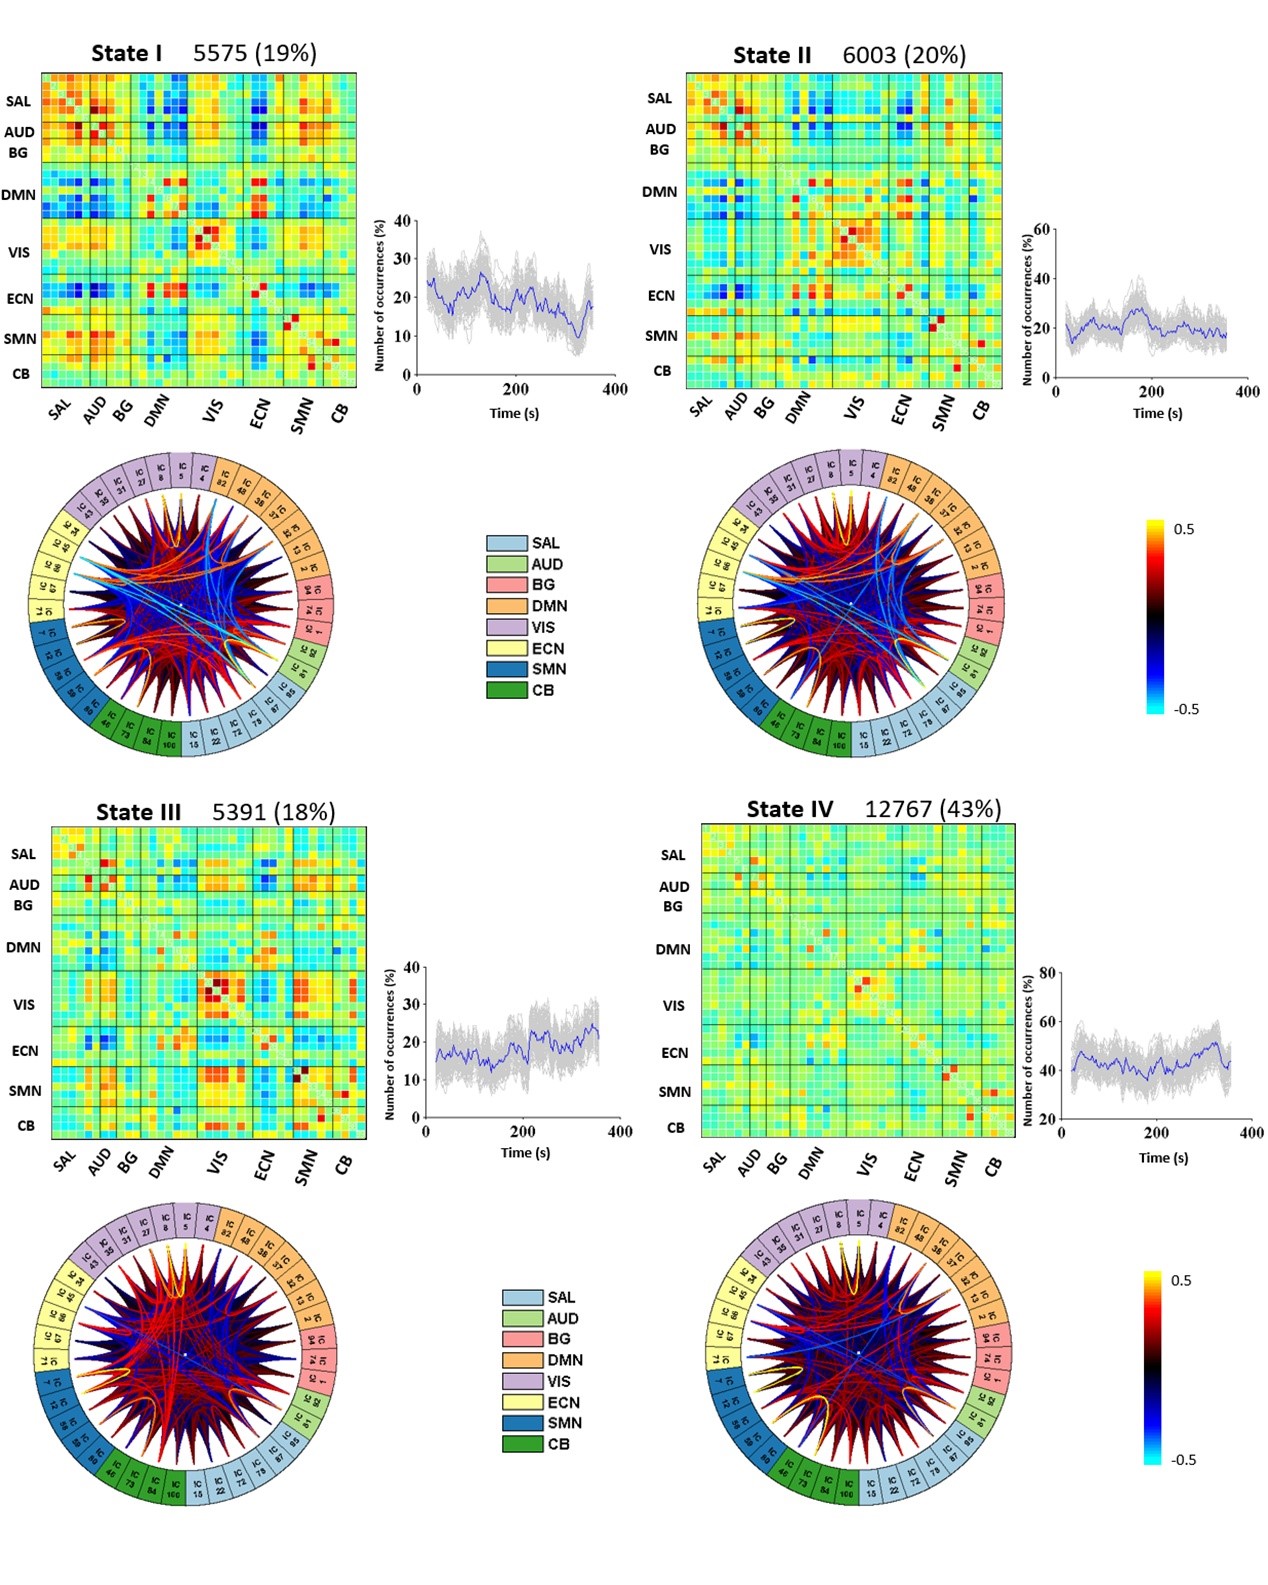
1.Intrinsic connectivity networks: We characterized 39 components as 8 intrinsic connectivity networks (ICNs) among the 100 estimated independent components for two groups, based on the largest spatial correlation with specific resting state network templates4. ICNs were arranged into groups of salience (SAL), auditory (AUD), basal ganglia (BG), default mode network (DMN), visual network (VIS), executive control network (ECN), sensorimotor network (SMN), and cerebellum (CB). (Fig.2)2.Clustering analysis and dynamic FNC states: As shown in Fig.3, we identified four functional connectivity states which recurred throughout scans in both healthy controls and OCD patients. The percentages of total occurrences of four states were quite different. FNC patterns in state I to state III observed less frequently (ranging from 18% to 20%), whereas state IV accounts for 43% of all windows. Besides, the state I to state III showed more frequent and stronger within and between network connections than state IV.
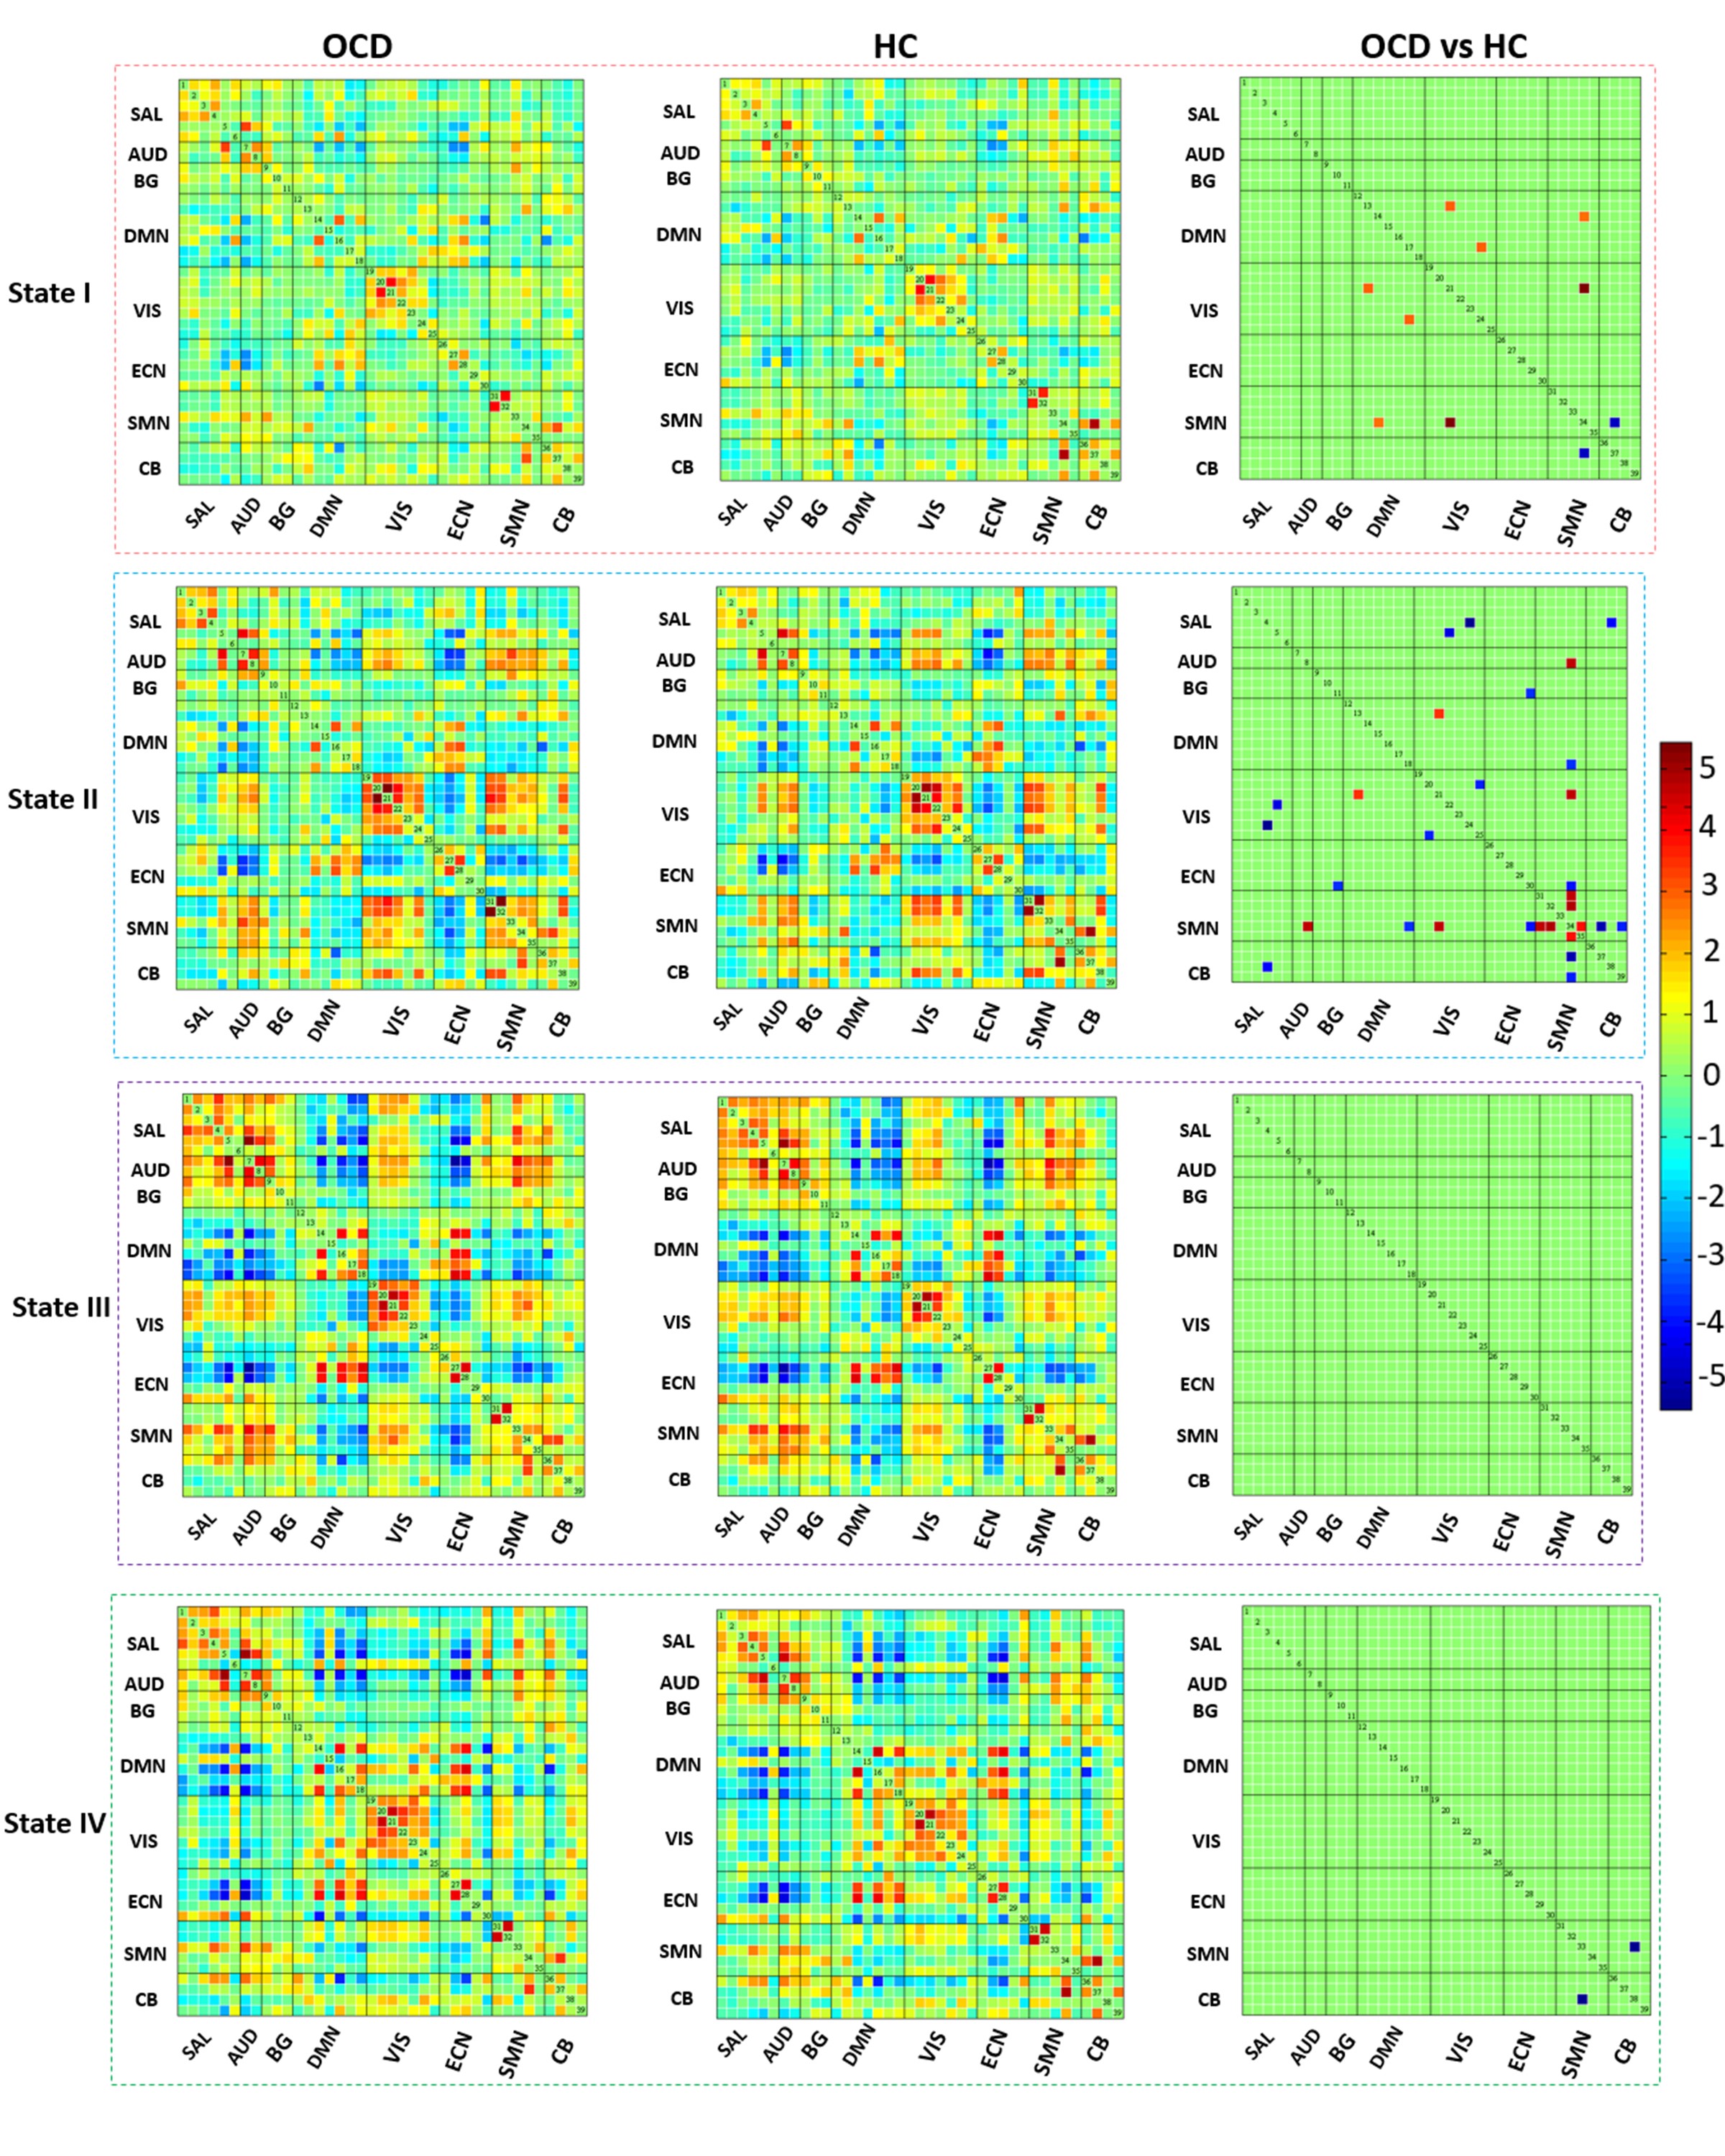
3.Dynamic FNC Analysis: For state I and state IV, relative to the controls, OCD patients showed less frequent and smaller-scale between-network connectivity alterations, which includes hyperconnectivity between visual network and DMN, between visual network and SMN, hypoconnectivity between SMN and cerebellum network. For state II, OCD patients showed more frequent and larger-scale within and between-network connectivity changes, such as within-network hypoconnectivity in visual network, within-network hyperconnectivity in SMN, and hyperconnectivity between visual network and DMN, between visual network and SMN, between auditory network and SMN, hypoconnectivity between salience and visual network, between salience and cerebellum network, between DMN and SMN, between SMN and cerebellum network. For state III, there was no significant group difference (Fig.4).
Discussion and Conclusion
This is the first study to demonstrate the abnormal dynamic changes of functional network connectivity patterns in patients with OCD, current study yielded three main findings. First, dynamic analysis demonstrated four distinct connectivity states in both OCD and control groups. Second, relative to the controls, OCD patients showed more frequent and larger-scale within and between-network connectivity changes at state II, whereas less frequent and smaller-scale between-network connectivity alterations appeared at state I and state IV, and no significant group difference at state III. Third, all states exhibited hyperconnectivity between visual network and DMN, between visual network and SMN, hypoconnectivity between SMN and cerebellum network, so it could be considered as the most stable connectivity changes of functional brain networks in OCD patients. SMN, cerebellum and visual networks all involved in motor function, which is closely related to compulsion features including repetitive actions and excessive doubting.These findings demonstrated the dynamic changes of brain network connectivity patterns in OCD patients from different temporal properties. Taken together, we proposed a new dysconnectivity model between SMN, DMN, cerebellum and visual network in OCD patients which maybe characteristic in this disorder.
Acknowledgements
This study was supported by National Nature Science Foundation (Grant NO. 81671669), Science and Technology Project of Sichuan Province (Grant NO. 2017JQ0001).References
[1] Abramowitz JS, Taylor S, McKay D. Obsessive-compulsive disorder. Lancet. 2009;374(9688):491-9.
[2] Gursel DA, Avram M, Sorg C, Brandl F, Koch K. Frontoparietal areas link impairments of large-scale intrinsic brain networks with aberrant fronto-striatal interactions in OCD: a meta-analysis of resting-state functional connectivity. Neuroscience and biobehavioral reviews. 2018;87:151-60.
[3] Allen EA, Damaraju E, Plis SM, et al. Tracking whole-brain connectivity dynamics in the resting state. Cereb Cortex. 2014 Mar;24(3):663-76.
[4] Shirer W, Ryali S, Rykhlevskaia E, et al. Decoding subject-driven cognitive states with whole-brain connectivity patterns. Cereb Cortex. 2012; 22 (1): 158-65
Figures