3990
Functional connectivity between major resting state networks in Parkinson’s disease with Mild Cognitive Impairment1Cleveland Clinic Lou Ruvo Center for Brain Health, Las Vegas, NV, United States
Synopsis
The underlying cause of cognitive deficits in Parkinson’s disease patients with mild cognitive impairment (PD-MCI) is not well understood and there are no biomarkers to diagnose PD-MCI in early stages. The aim of the current study is to quantify the connectivity between the major resting state networks (RSNs) in PD–MCI using independent component analysis (ICA) and graph theory. Our results showed altered connectivity and reduced efficiency of the visual network which is implicated in several stages of PD and also showed that dysfunction exists in between large scale RSN connectivity which is correlated with behavioral scores.
Introduction
Cognitive deficits in Parkinson’s disease (PD) patients are common and affect about 15%-40% of patients in the early stages1. While PD with mild cognitive impairment (PD-MCI) has been shown to be a risk factor for the development of dementia2, not all patients with PD-MCI progress to dementia. The underlying cause of cognitive deficits in PD is not well understood and there are no biomarkers to diagnose PD-MCI. Therefore, it is important to better understand the neuroanatomical correlates of PD-MCI to further the development of biomarkers that may inform earlier detection of MCI in PD. One methodology that can be used for this purpose is resting-state functional MRI (rs-fMRI). The aim of the current study is to quantify the connectivity between the major resting-state networks (RSNs) in PD–MCI and PD non MCI (PD-nMCI) using independent component analysis (ICA) and graph theory. We hypothesize that there will be disrupted connectivity and altered network measures in between RSN connectivity, and difference in relationship to behavioral measures in the PDMCI group when compared to the PD-nMCI group. These differences may possibly involve the default mode network (DMN) and the visual network (VN) primarily as studies have shown disrupted functioning of these RSNs in different stages of PD3,4.Methods
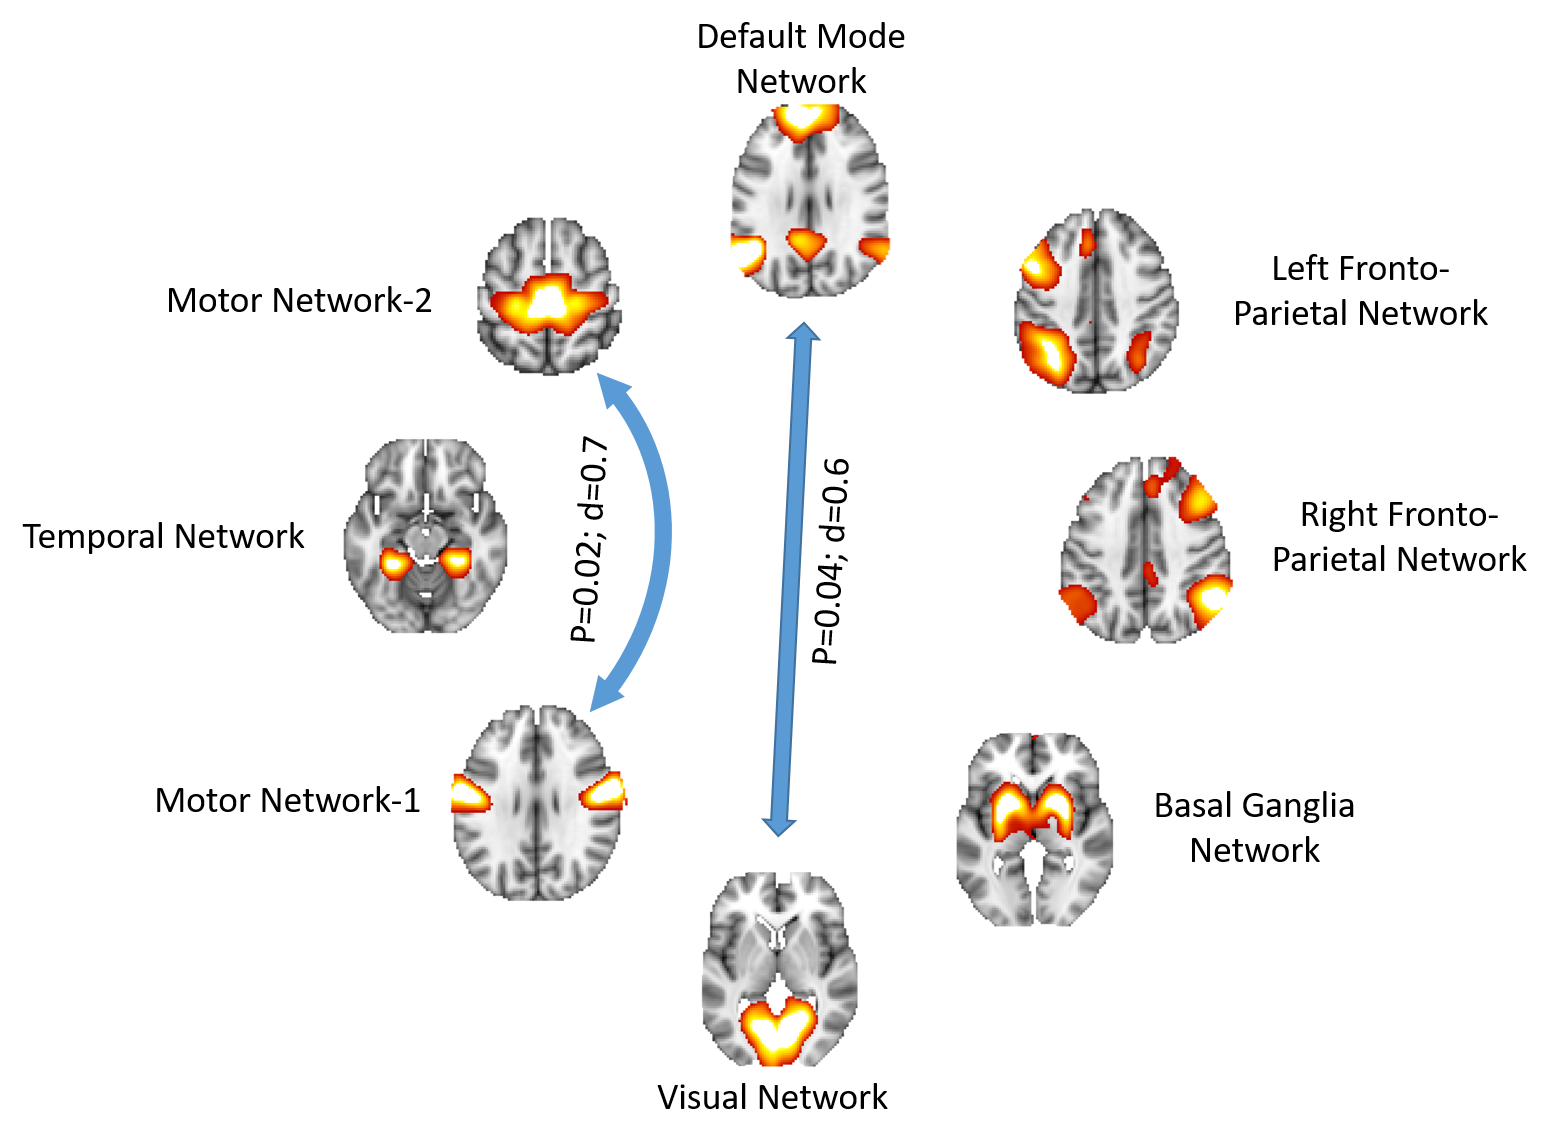
We recruited 22 PD-MCI and 15 PD-nMCI participants at our center. A consensus diagnosis of PD-MCI was made by a practicing neurologist and neuropsychologist based on clinical presentation and neuropsychological evaluations of each participant. For diagnostic accuracy, PD-MCI was classified after applying a threshold of 1.5 standard deviations1,5 below appropriate norms on at least two neuropsychological tests following Movement Disorders Society (MDS) criteria1. All participants underwent rs-fMRI (in ON state) and 850 volumes were acquired at a TR of 700ms on a 3T Siemens Skyra scanner. Preprocessed rs-fMRI data from both groups were concatenated in time and input to a spatial group ICA6. Eight RSNs, namely the DMN, left and right frontal-parietal network (L.FPN and R.FPN), basal ganglia network, motor network (MN-1 and MN-2), visual network (VN) and temporal network that were consistent with previous reports were identified7,8 ICA decomposition was carried out with the Infomax algorithm9 using the GIFT toolbox10. Then, spatial regression was used on time-series data of the different group level RSNs to obtain the corresponding subject specific RSN time-signatures for connectivity analysis. In the current study each RSN represents a node and the Pearson’s correlation between two RSNs time-signature represents an edge. Subsequently, a connectivity matrix (8x8) was obtained for each subject. Various nodal properties were computed using GRETNA11. Two sample t-tests were performed to identify RSN connectivity and local network properties that were different between the groups, and linear regression analysis was performed to determine association between local network properties and neuropsychological scores.Results
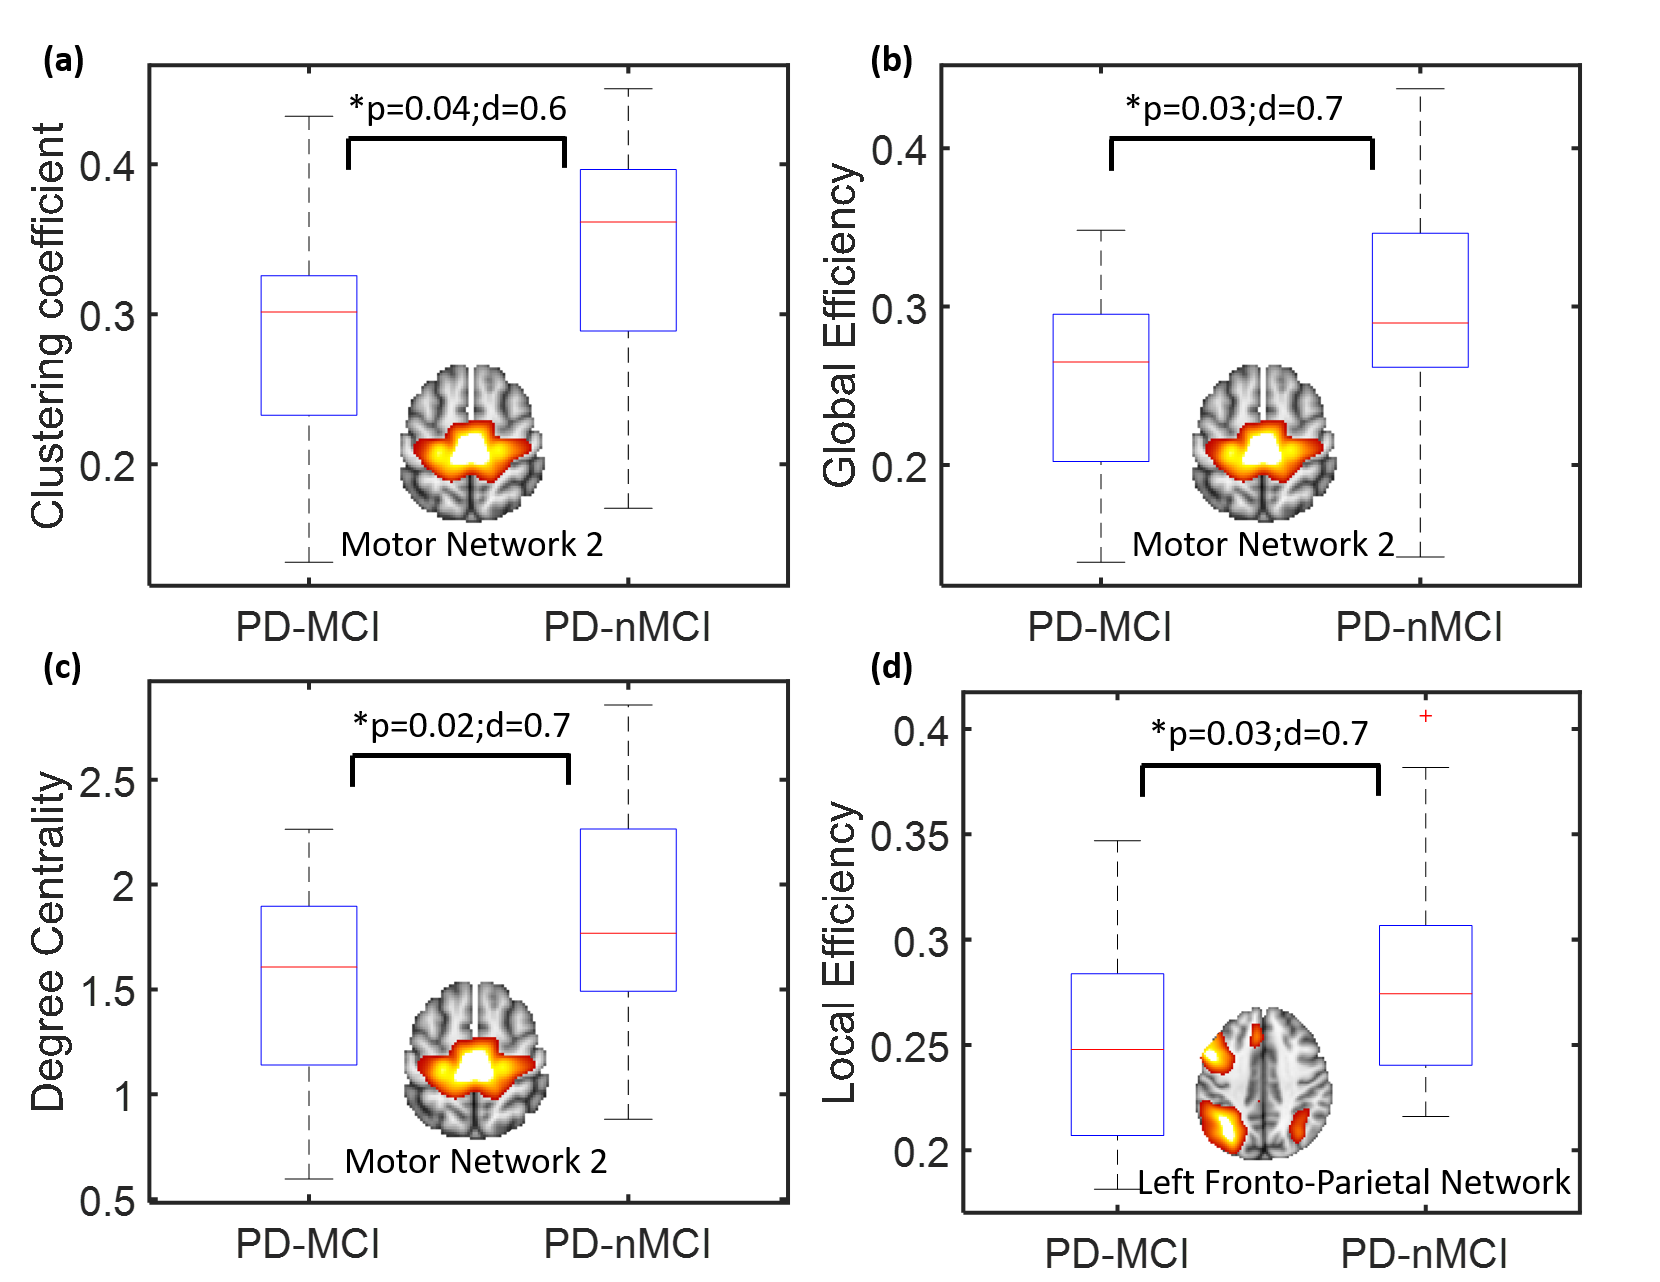
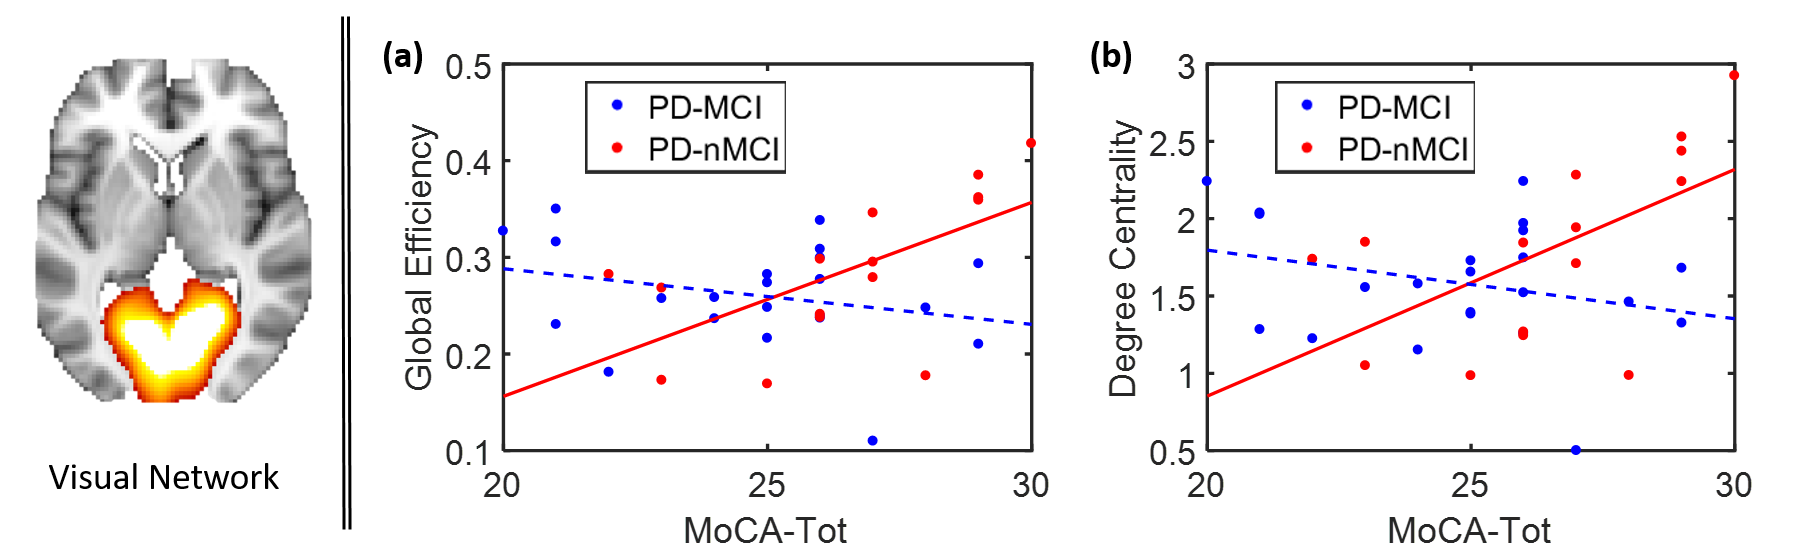
Fig.1 shows the RSN connectivity that was different between the PD-nMCI group and PD-MCI. The connectivity between MN-1 and MN-2 and VN and DMN was greater in PD-nMCI group when compared to the PD-MCI group. The evaluation of the nodal network properties revealed lower clustering coefficient, global efficiency and degree centrality of MN-2 and local efficiency of L.FPN (Fig.2) in the PD-MCI group when compared to PD-nMCI group. In the PD-nMCI the global efficiency and degree centrality of VN was positively associated with the Montreal Cognitive Assessment (MoCA) score (Fig. 3a and 3b).Discussion
Most differences between the groups involved altered VN connectivity and efficiency, and altered VN connectivity is known to be characteristic of many different stages in PD3,12,13. Specifically the connectivity between the VN and DMN was reduced in PD-MCI group. The interaction between the VN-DMN is known to be important for task performance14. The efficiency and degree centrality of the VN was positively associated with the MoCA in the PD-nMCI group but no significant association was seen in the PD-MCI group. Interestingly however the PD-MCI group showed a negative trend. Studies have shown that VN connectivity decreases as PD progresses, and we hypothesize that since MoCA is a more global measure of cognition other networks compensate for the reduced efficiency of the VN resulting in a negative trend. In addition to altered VN connectivity, we also found reduced efficiency of the FPN network which is known to be very important for cognitive and executive tasks and also reduced connectivity and efficiency of the MN in the PD-MCI group, in agreement with earlier findings3,4,12,13.Conclusion
The main findings of our study are 1) altered connectivity and reduced efficiency of the VN and 2) network dysfunction is not just limited to within the motor network but also within and between other RSNs and local network measures are related to MoCA. While statistical significance in the current study were established at puncorr<0.05 they did exhibit a moderate to high effect. This could be due to the inherent heterogeneity of MCI. Another factor could be eyes open or eyes closed rs-fMRI and since many results involve the VN it is important to replicate these results with other rs-fMRI datasets. Future studies with multimodal and longitudinal data are currently underway to identify a set of multimodal imaging biomarkers that can help predict MCI in PD.Acknowledgements
This research project was supported by the NIH COBRE grant 5P20GM109025, Keep Memory Alive-Young Investigator Award, and philanthropic funds from Peter and Angela Dal Pezzo, Lynn and William Weidner, and Stacie and Chuck Matthewson.References
[1] Litvan I, Goldman JG, Tröster AI, et al. Diagnostic criteria for mild cognitive impairment in Parkinson’s disease: Movement Disorder Society Task Force guidelines. Mov Disord. 2012/01/24. 2012;27:349–356.
[2] Hely MA, Reid WG, Adena MA, Halliday GM, Morris JG (2008):The Sydney multicenter study of Parkinson’s disease: Theinevitability of dementia at 20 years. Mov Disord 23:837–844.
[3] Rektorova I, Krajcovicova L, Marecek R, Mikl M (2012) Default mode network and extrastriate visual resting state network in patients with Parkinson’s disease dementia. Neurodegener Dis 10, 232–237.
[4] Yao N, Shek-Kwan Chang R, Cheung C, Pang S, Lau KK, Suckling J, Rowe JB, Yu K, Ka-Fung Mak H, Chua SE, Ho SL, Mcalonan GM (2014) The default mode network is disrupted in parkinson’s disease with visual hallucinations. Hum Brain Mapp 35, 5658–5666.
[5] Goldman JG, Holden S, Bernard B, Ouyang B, Goetz CG, Stebbins GT. Defining optimal cutoff scores for cognitive impairment using Movement Disorder Society Task Force criteria for mild cognitive impairment in Parkinson’s disease. Mov Disord. United States; 2013;28:1972–1979.
[6] Calhoun VD, Adali T, Pearlson GD, van Zijl PCM, Pekar JJ. Independent component analysis of fMRI data in the complex domain. Magn Reson Med. United States; 2002;48:180–192.
[7] Beckmann CF, DeLuca M, Devlin JT, Smith SM. Investigations into resting-state connectivity using independent component analysis. Philos Trans R Soc B Biol Sci. London: The Royal Society; 2005;360:1001–1013.
[8] Smith SM, Fox PT, Miller KL, et al. Correspondence of the brain’s functional architecture during activation and rest. Proc Natl Acad Sci U S A. United States; 2009;106:13040–13045.
[9] Bell AJ, Sejnowski TJ. An information-maximization approach to blind separation and blind deconvolution. Neural Comput. United States; 1995;7:1129–1159.
[10] Du Y, Fan Y. Group information guided ICA for fMRI data analysis. Neuroimage. United States; 2013;69:157–197.
[11] Wang J, Wang X, Xia M, Liao X, Evans A, He Y. GRETNA: a graph theoretical network analysis toolbox for imaging connectomics. Front Hum Neurosci. 2015;9:386.
[12] Baggio HC, Segura B, Sala-Llonch R, Marti MJ, Valldeoriola F, Compta Y, Tolosa E, Junqué C (2015) Cognitive impairment and resting-state network connectivity in Parkinson’s disease. Hum Brain Mapp 36, 199–212.
[13] Dubbelink KTEO, Hillebrand A, Twisk JWR, Deijen JB, Stoffers D, Schmand BA, Stam CJ, Berendse HW (2014) Predicting dementia in Parkinson disease by combining neurophysiologic and cognitive markers. Neurology 82, 263–270.
[14] Chadick JZ, Gazzaley A (2011): Differential coupling of visual cor-tex with default or frontal-parietal network based on goals.Nat Neurosci 14:830–832.
Figures