3986
Functional brain networks in schizophrenia: chain-like organization goes wild
Tommaso Gili1, Rossana Mastrandrea1, Fabrizio Piras2, Andrea Gabrielli3, Guido Caldarelli1, and Gianfranco Spalletta2
1IMT School for Advanced Studies Lucca, Lucca, Italy, 2IRCCS Santa Lucia Foundation, Roma, Italy, 3Università degli Studi Roma III, Roma, Italy
1IMT School for Advanced Studies Lucca, Lucca, Italy, 2IRCCS Santa Lucia Foundation, Roma, Italy, 3Università degli Studi Roma III, Roma, Italy
Synopsis
Schizophrenia is a severe psychiatric condition, and is hypothesized to result from abnormal anatomical neural connectivity and a consequent decoupling of the brain’s integrative thought processes. Here we analysed and compared resting state functional magnetic resonance imaging (rs-fMRI) data from forty-four schizophrenia patients (SZ) and forty healthy subjects (HS). Complex network analysis of brain functional connectivity revealed that SZ networks are characterized by more stable configurations with a lower level of flexibility of functional plasticity than HS networks, which may depend on an abnormal synaptic connectivity due to a dysfunctional cortical pruning.
Introduction
Schizophrenia is a severe psychiatric condition, and is hypothesized to result from abnormal anatomical neural connectivity and a consequent decoupling of the brain’s integrative thought processes [1]. Networks science has allowed the creation of a novel platform that provides a deeper understanding of the overall organization of brain wiring, its relation to healthy brain function and human cognition, and conversely, how brain disorders such as schizophrenia arise from abnormal brain network wiring and dynamics [2]. Recently it has been showed that complex network analysis is able to unearth the skeleton of the healthy brain functional connectedness [3]. Here we analysed resting state functional magnetic resonance imaging (rs-fMRI) data from forty-four schizophrenia patients (SZ) and forty healthy subjects (HS).Methods
Experimental details and the full preprocessing of data are described elsewhere [3]. The human brain was segmented into 116 macro-regions from the AAL template [4]. Resting state fMRI signals were averaged across each region to generate 116 time-series, which in turn were pairwise correlated and organized in a symmetric matrix [3].Results and Discussion
A percolation curve was calculated for both HS and SZ [3]. Results show that SZ are characterized by functional networks that resist to disconnection much more than those coming from HS (Figure 1). This can be seen as a lack of flexibility of functional plasticity, which, in turn, may induce a dysfunctional integration among neuronal systems [5]. We also computed the Maximum Spanning Tree (MST) of the correlation matrix associated with the human functional brain network of each subject in the two groups and the associated allometric slope values [6] by considering each ROI as root. We than removed from the initial correlation matrix the links corresponding to the MST and computed the novel MST. Results show (Figure 2) that, starting from a quite similar condition, allometric slope values in HS tend to reduce faster than in SZ. Allometric slopes assume values in the range (1,2], whose boundaries are associated with two extreme configurations: star-like (randomized trees) and chain-like (unefficient linear trees) [6]. Since the first MST (the original backbone) assumes allometric slop values close to 1.5, it represents the more stable configuration of the functional architecture. Findings suggest that SZ functional networks are characterized by more stable configurations (at each stage the allometric slope values are closer to 1.5 than those coming from the HS trees), which may depend on an abnormal distribution of synaptic connections that resulted after the expected cortical pruning [7].Acknowledgements
No acknowledgement found.References
1) Van Os J and Kapur S, Lancet 2009; 374: 635; (2) Bassett D and Sporns O, Nat Neurosci, 2017; 20(3): 353; (3) Mastrandrea R et al., Sci Rep 2017; 7(1):4888; (4) Tzourio-Mazoyer, N. et al., Neuroimage 2002; 15, 273; (5) Friston K., Schizophr Res 1998; 30(2):115. (6) Garlascehlli et al., Nature 2003; 423(6936):165; (7) van Spronsen M and Hoogenraad CC, Curr Neurol Neurosci Rep (2010);10: 207.Figures
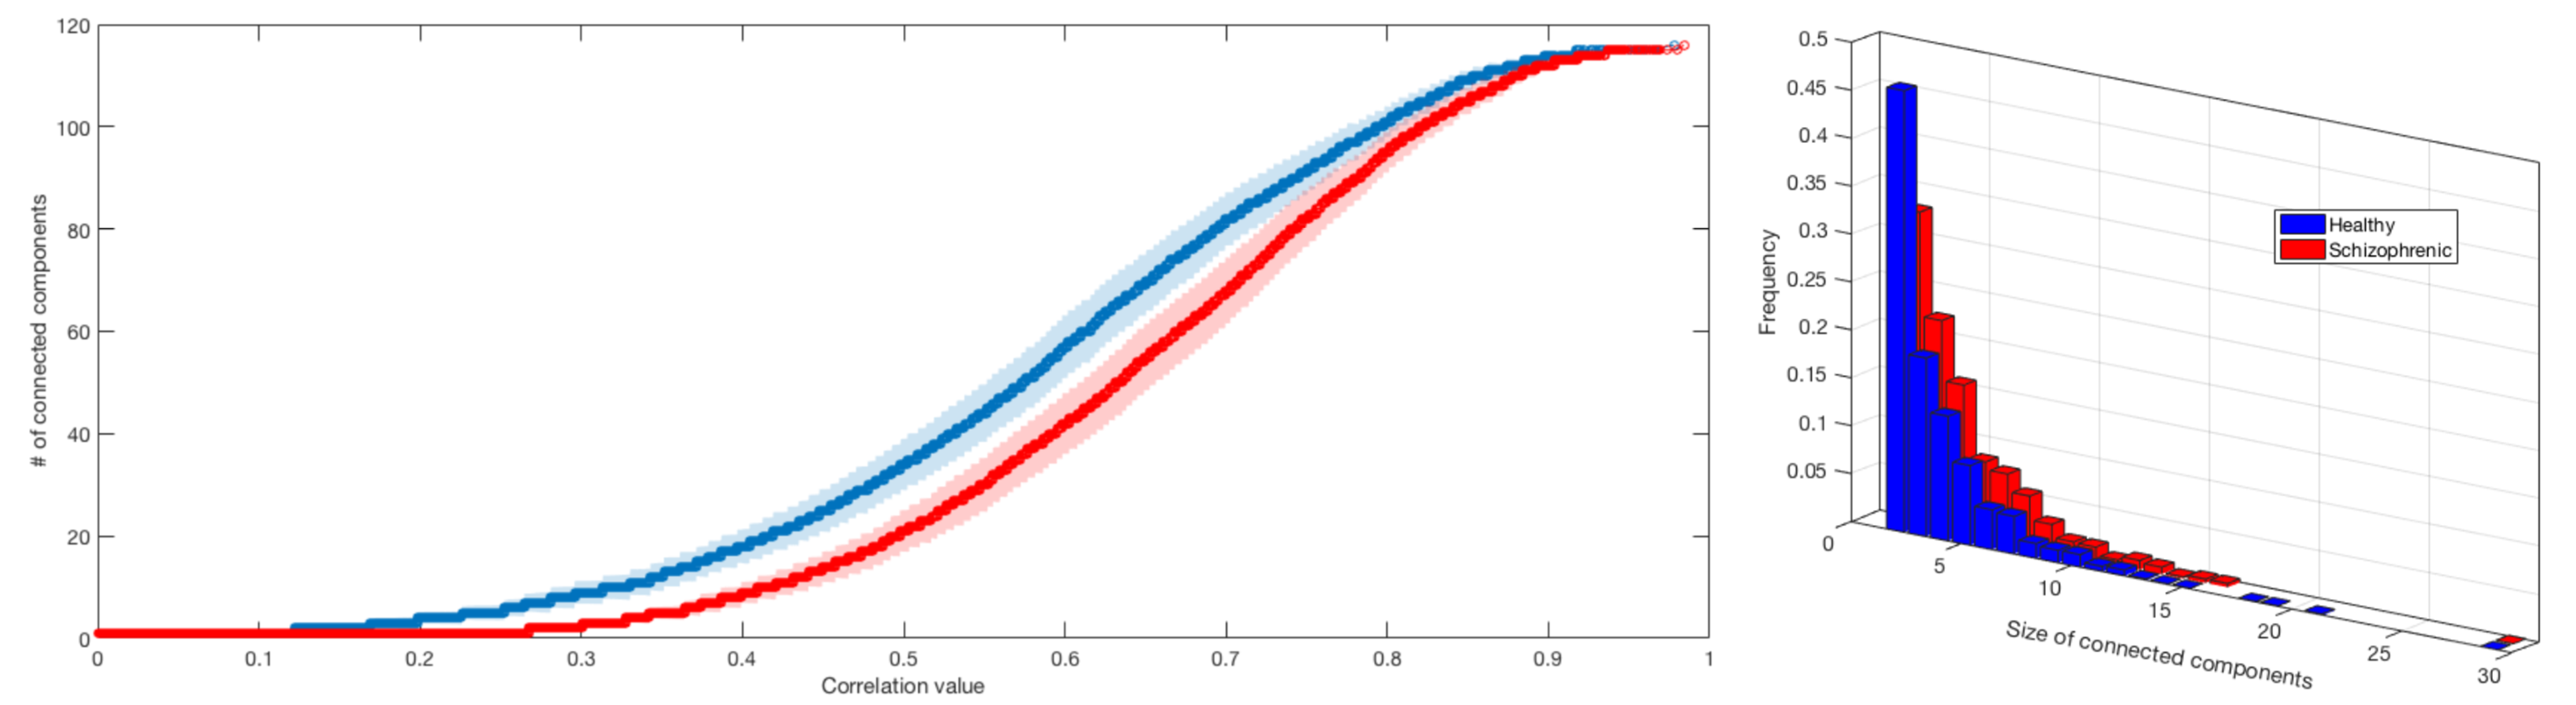
Figure 1. Percolation curves for HS (blue) and SZ (red) averaged across subjects, reported together with the 95% confidence interval. The plot aside shows the size of connected components distribution for HS (blue) and SZ (red).
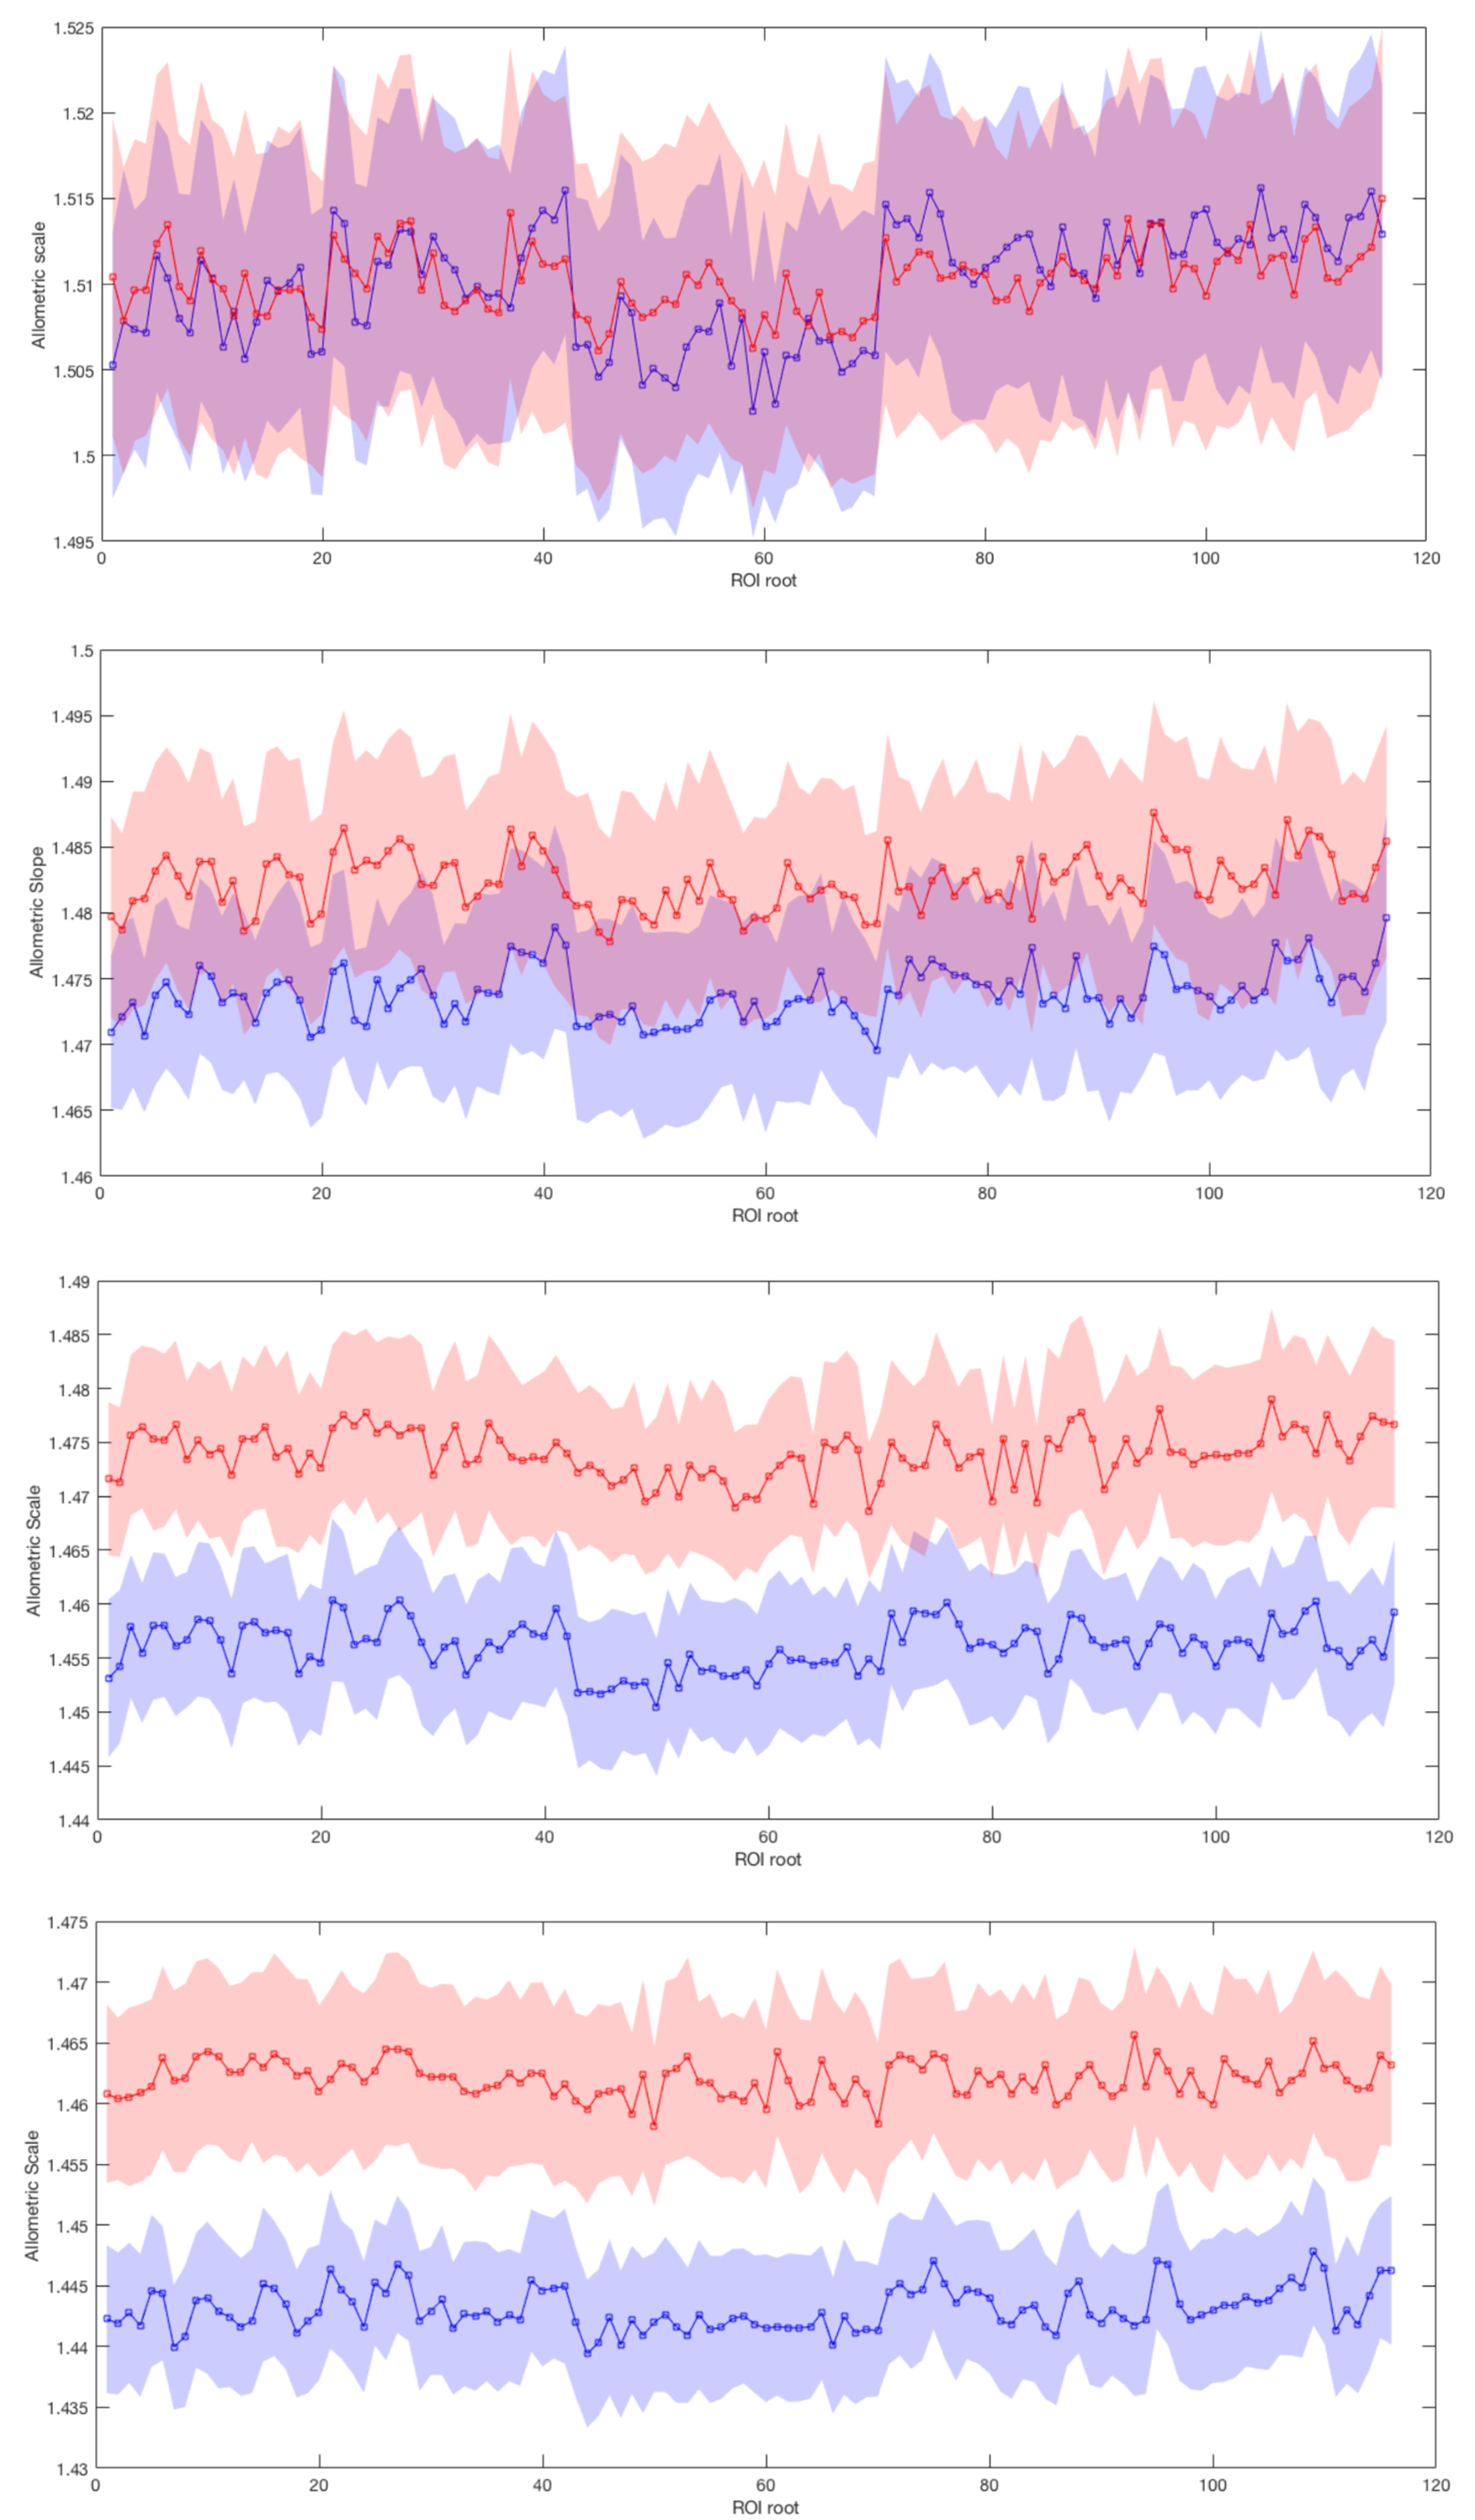
Figure 2. Allometric slope values of the MS for HS (blue) and SZ (red) MSTs: the ROI numbers on the x-axis indicate the roots. Starting from the top (original backbones), the figures report the allometric slope values obtained by progressively removing links,i.e. by ignoring links corresponding to previous MSTs.