3980
The mechanisms of cognitive impairment in patients with pontine infarction:a resting-state fMRI study.1Department of MRI, The First Affiliated Hospital of Zhengzhou University, Zhengzhou, China, 2GE Healthcare MR Research, Beijing, China, Beijing, China
Synopsis
In order to explore the mechanisms of cognitive impairment in patients with pontine infarction, we recruited 45 patients with chronic pontine stroke and 48 normal controls. The independent component analysis (ICA) and seed-based analysis were combined to explore altered patterns of functional connections in patients based on resting-state fMRI. The different FCs in the stroke patients and the healthy controls, as well as the positive correlation between the FC within the cerebellar network and cognitive function scores, indicate that the disconnection of the cerebellar network may be related to the cognitive impairment in patients with pons stroke.
Introduction
Cognitive impairment is one of the most common symptoms in patients with pontine stroke, which seriously affects their life quality. Therefore, it is of paramount significance to identify the injury mechanisms of cognitive function in stroke patients, and help establish accurate and timely diagnoses, prognoses and more effective treatments. Many previous studies have demonstrated the changes of the diffusion indexes in the corticospinal tract (CST), the gray matter volume, the cerebral blood flow in patients with pontine stroke[1-3]. However, little is known about the changes in functional connections in these patients. This study intends to explore the mechanisms of cognitive impairment in patients with pontine infarction through resting-state fMRI.Materials and Methods
A total of 45 right-handed patients who suffers from cognitive impairment (including 25 left-sided and 20 right-sided pontine stroke patients) and 48 age- and sex-matched healthy volunteers were investigated in this study. The images of all subjects were collected on a 3.0 Tesla GE Discovery 750 MR scanner. The resting-state fMRI data were obtained using a single-shot echo planar imaging sequence BOLD (TR/TE = 20 00/30 ms, thickness = 3.0 mm, gap=1mm, FOV = 240 × 240 mm2, matrix = 64 × 64, slices = 38, volumes=180). The visual spatial 1-back task was used to assess the cognitive function. To improve the statistical ability, we flipped the imaging data from right to left along the mid sagittal line for patients with lesions on the right hemisphere. The resting-stste networks (RSNs) were identified by using independent component annalysis (ICA). Then we use one-sample t test with FWE correction (p<.005) and a cluster size of >100 to create a sample-specific component map and a network mask. The altered functional connections ( FCs) within the intra-network for each component between two groups were obtained in a voxel-wise manner by using two-sample t-tests (AlphaSim corrected significance level of p< 0.05). The mean z values of each brain region that showed significant intergroup differences in functional connectivity were extracted and the correlations between the FCs and behavioral scores were calculated using Pearson's correlation. A seed-based analysis was used to invetigate whether there are altered functional connectivities between the the regions of interest that have different intranetwork FCs from the normal people. The mean time series of the seed regions were extracted and calculated by using pearson correlations to examine functional connectivity.Results and Discussions
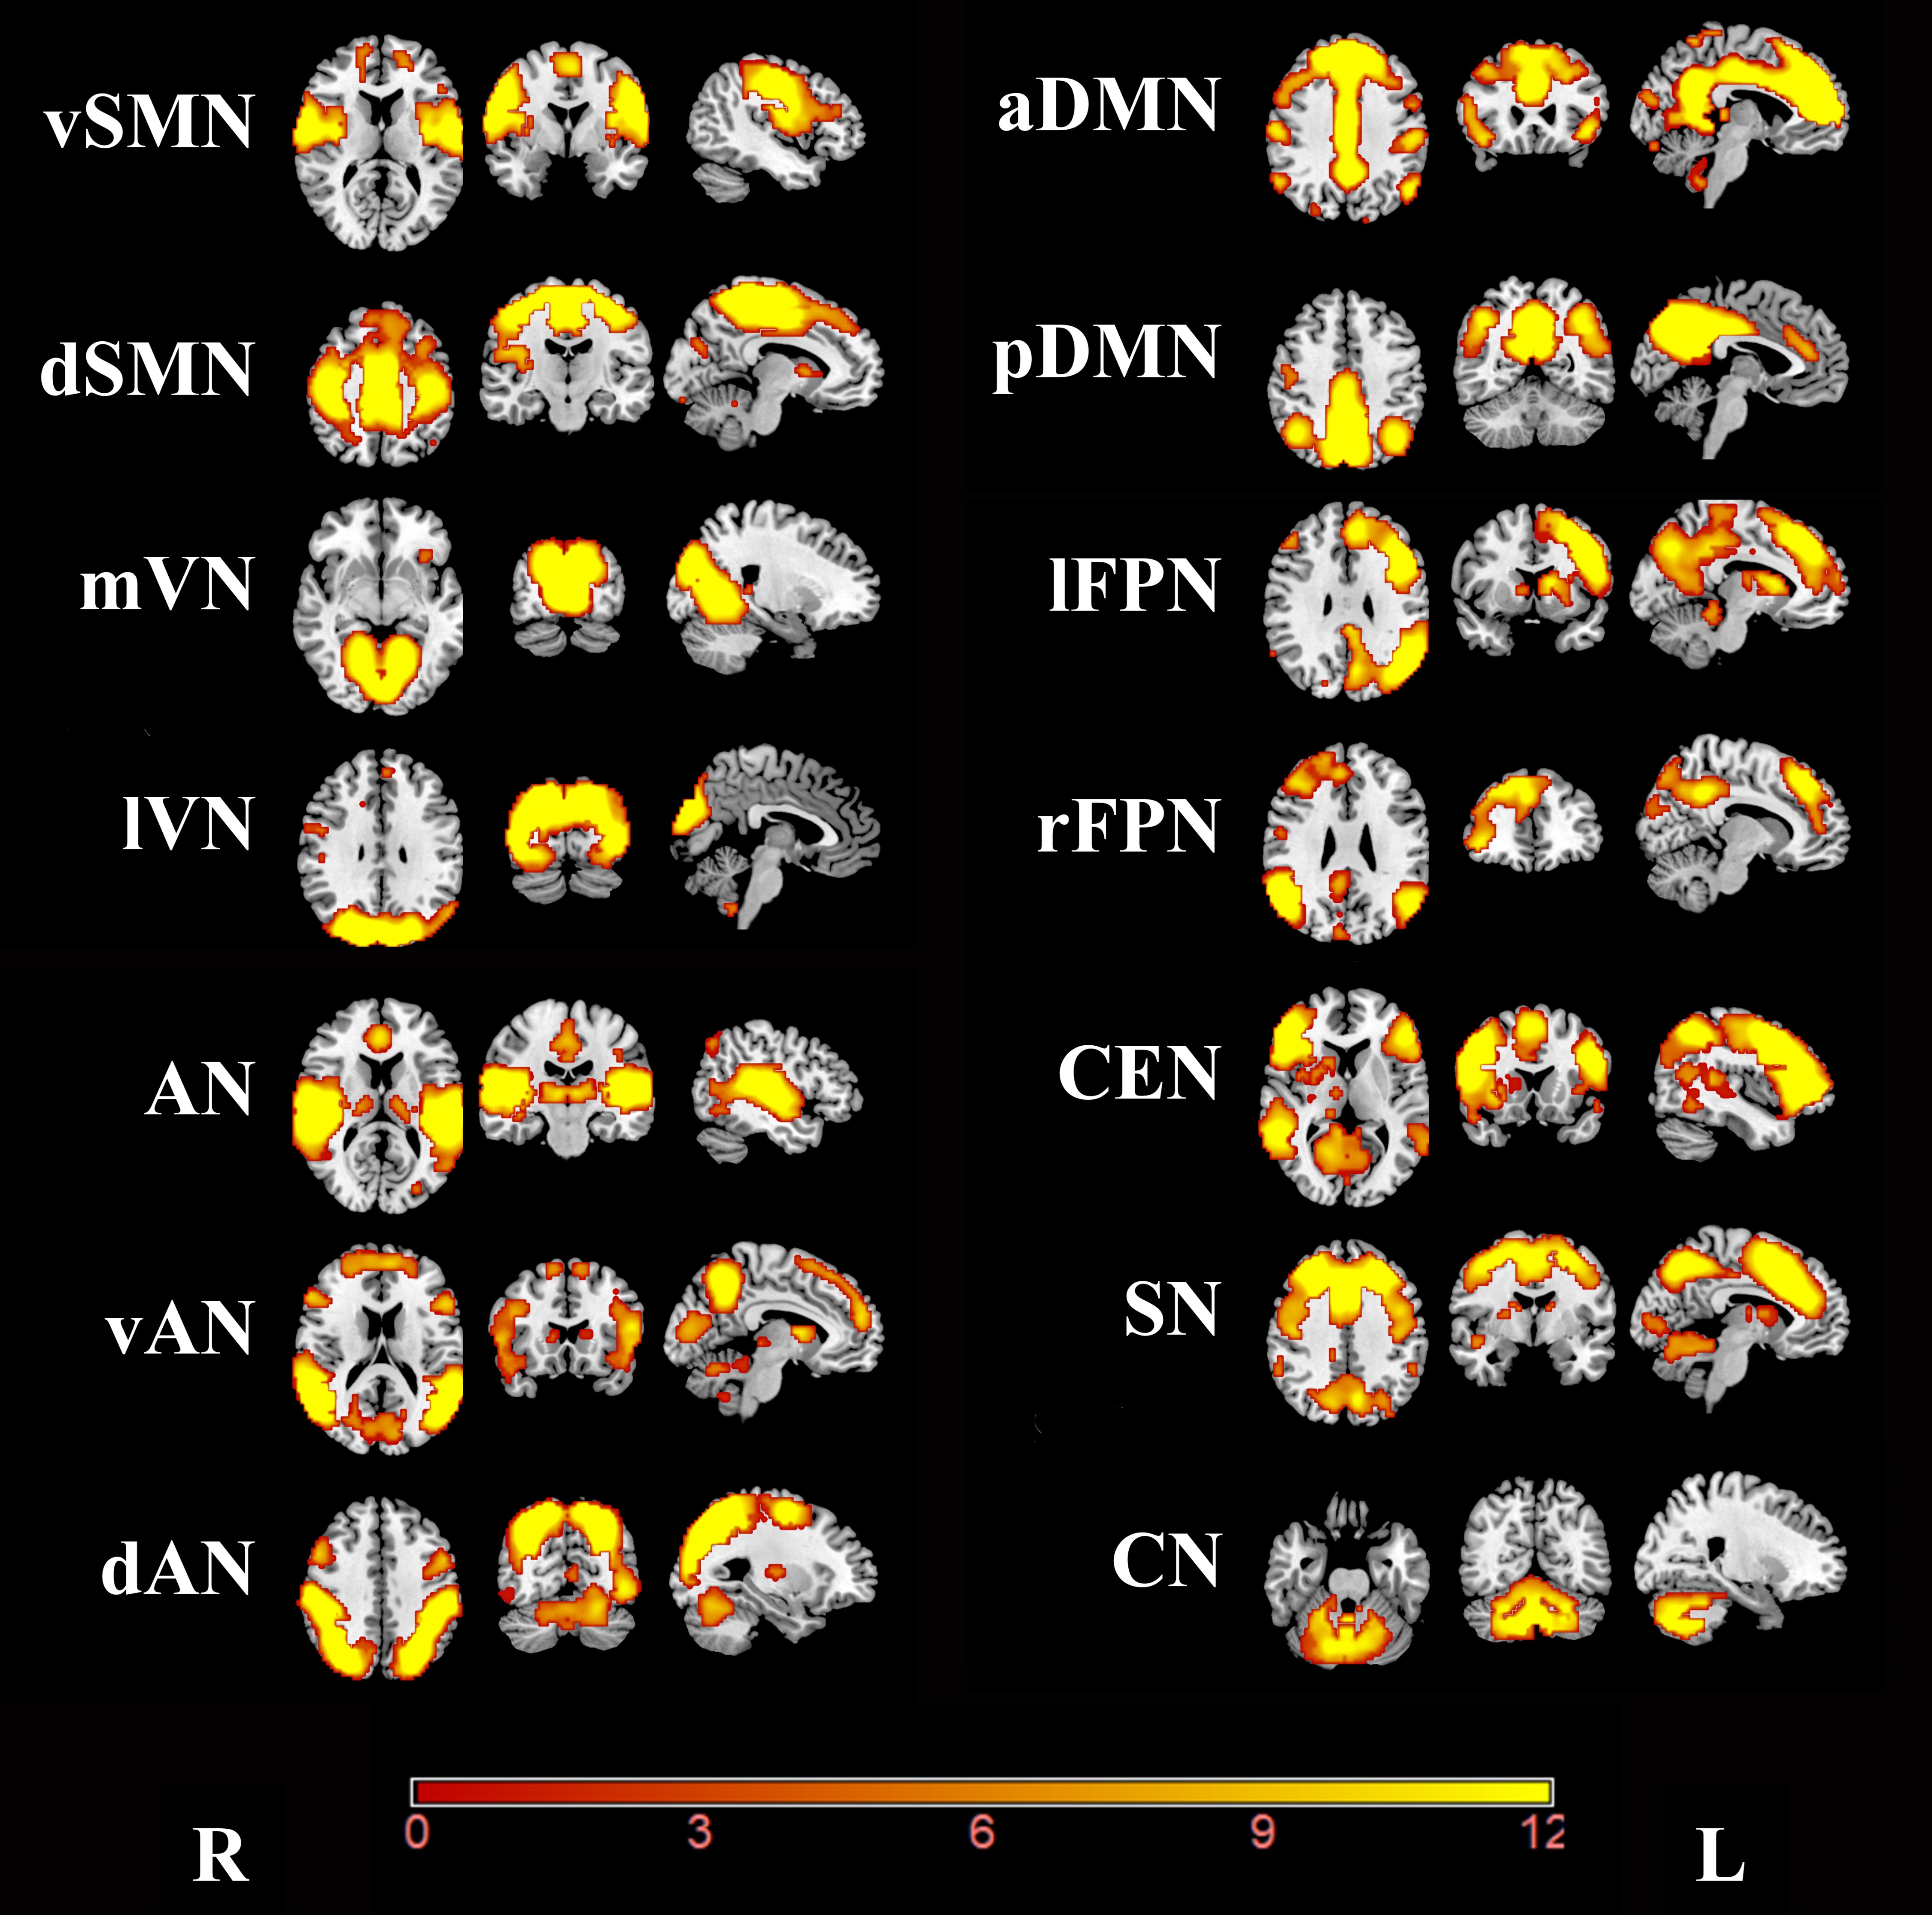
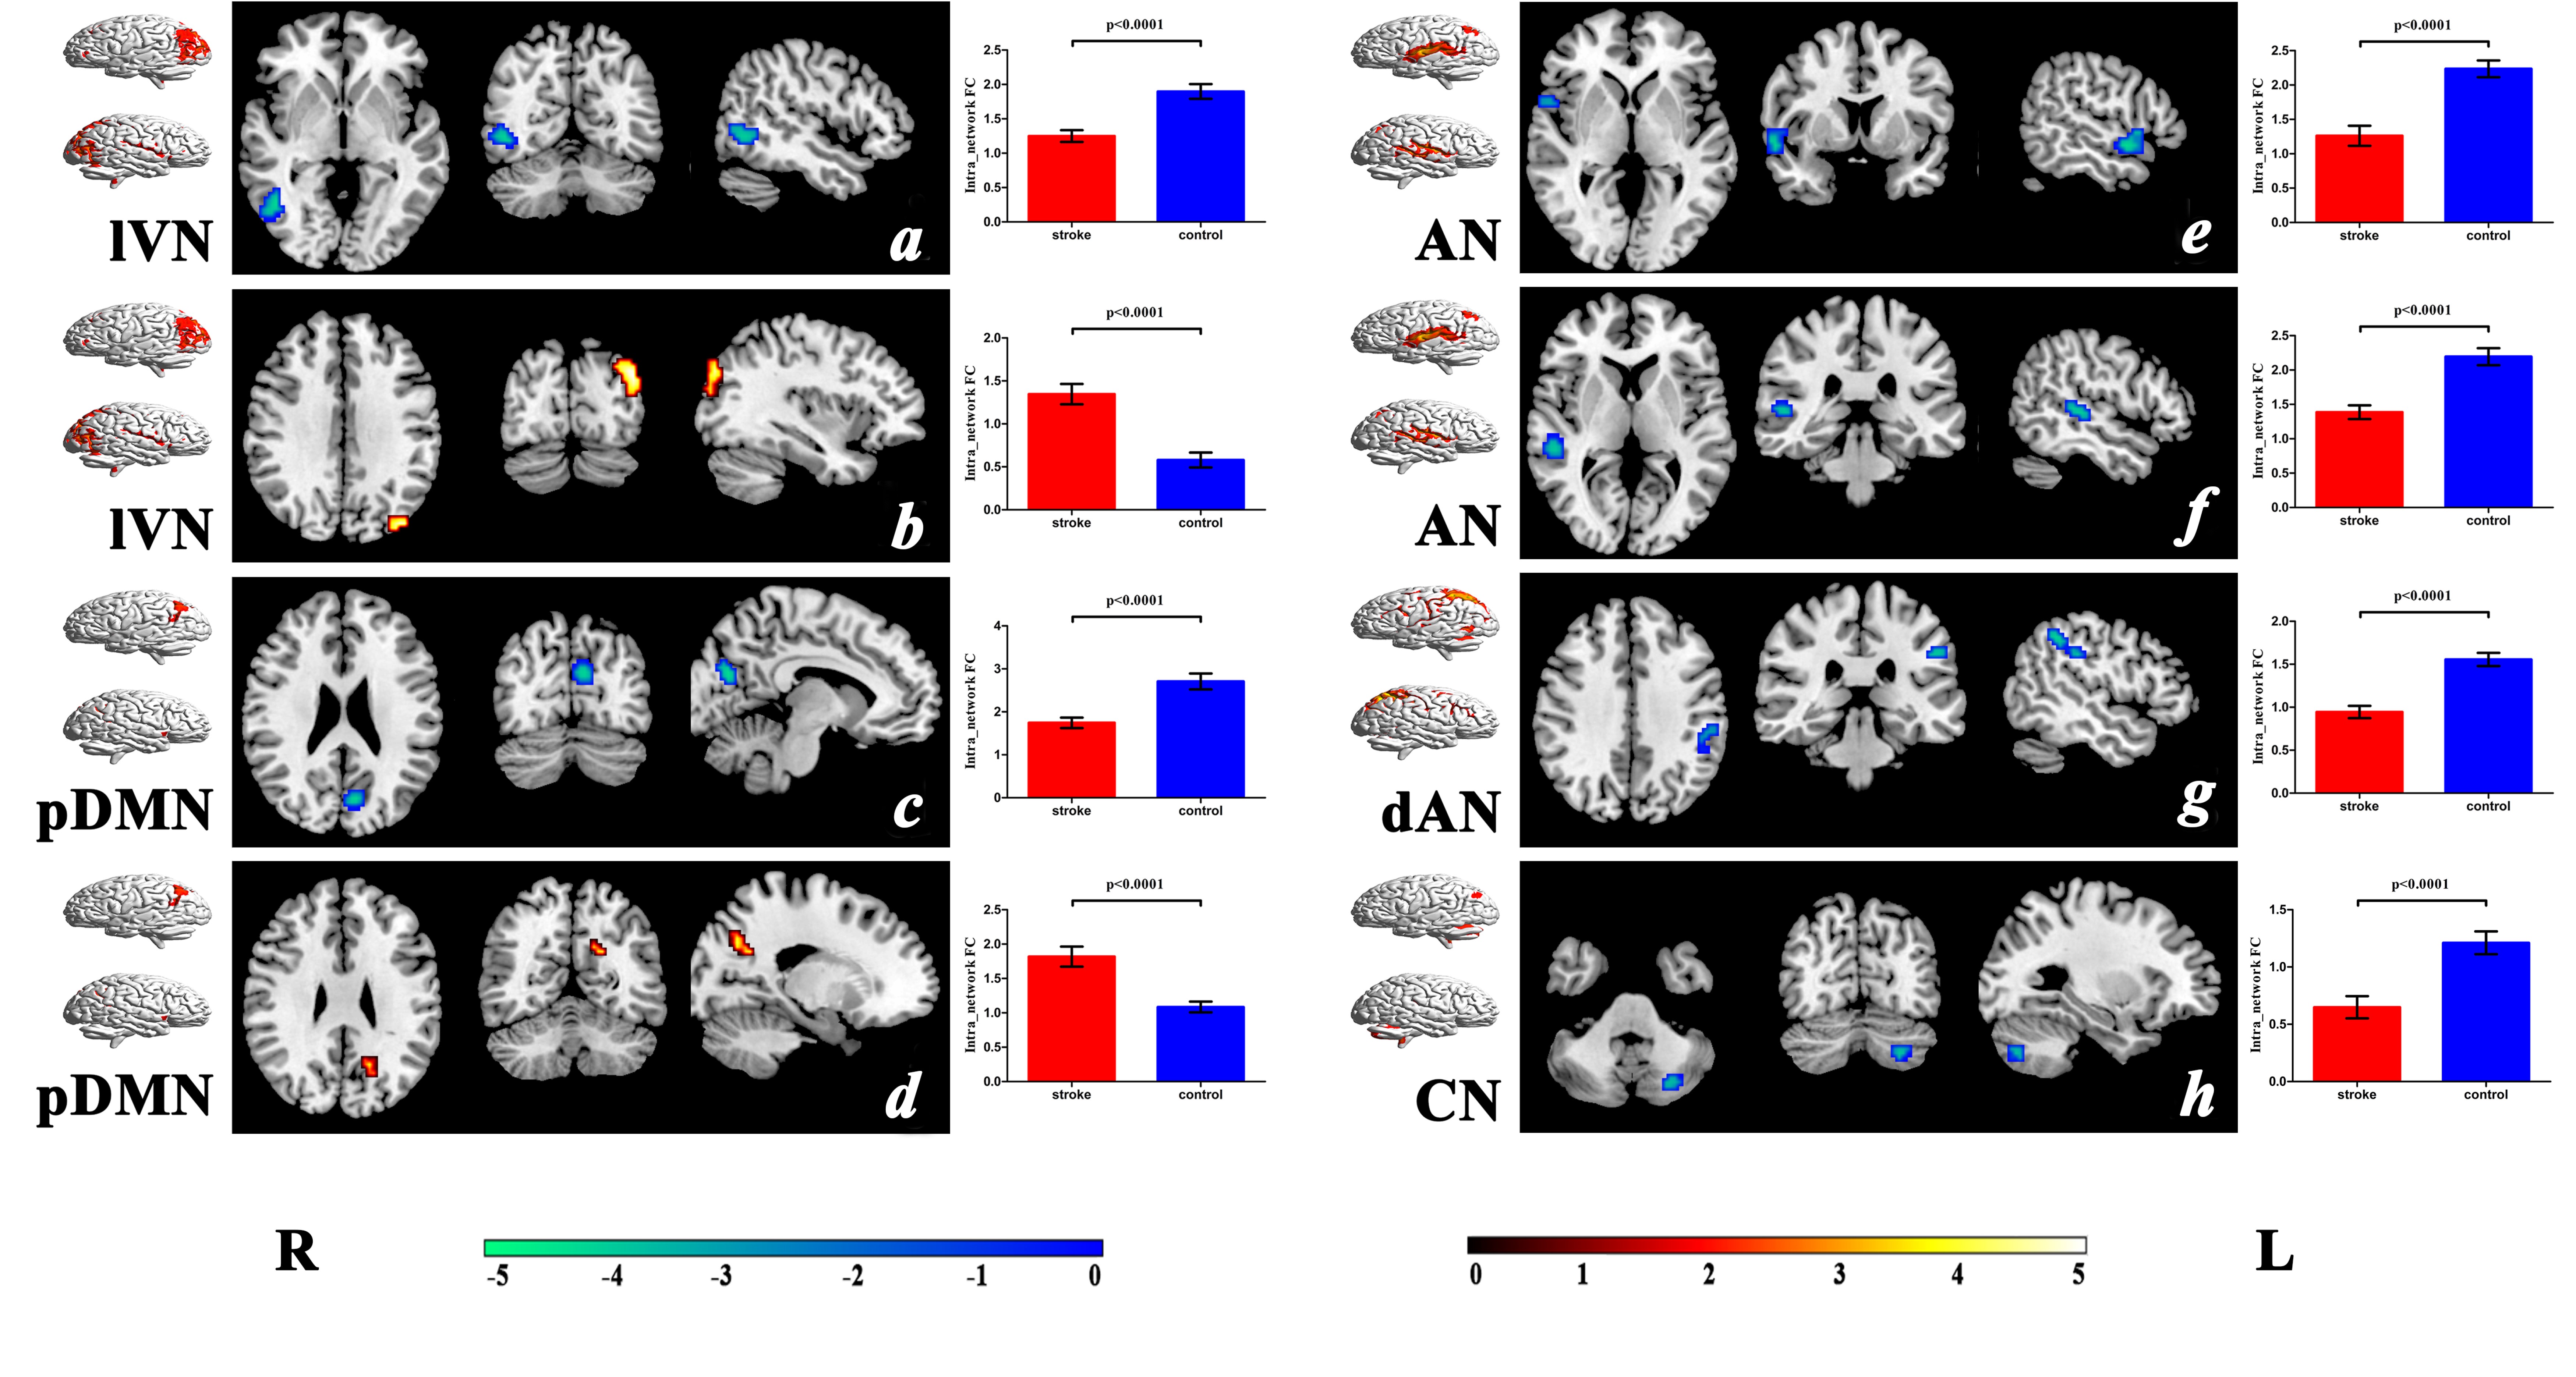
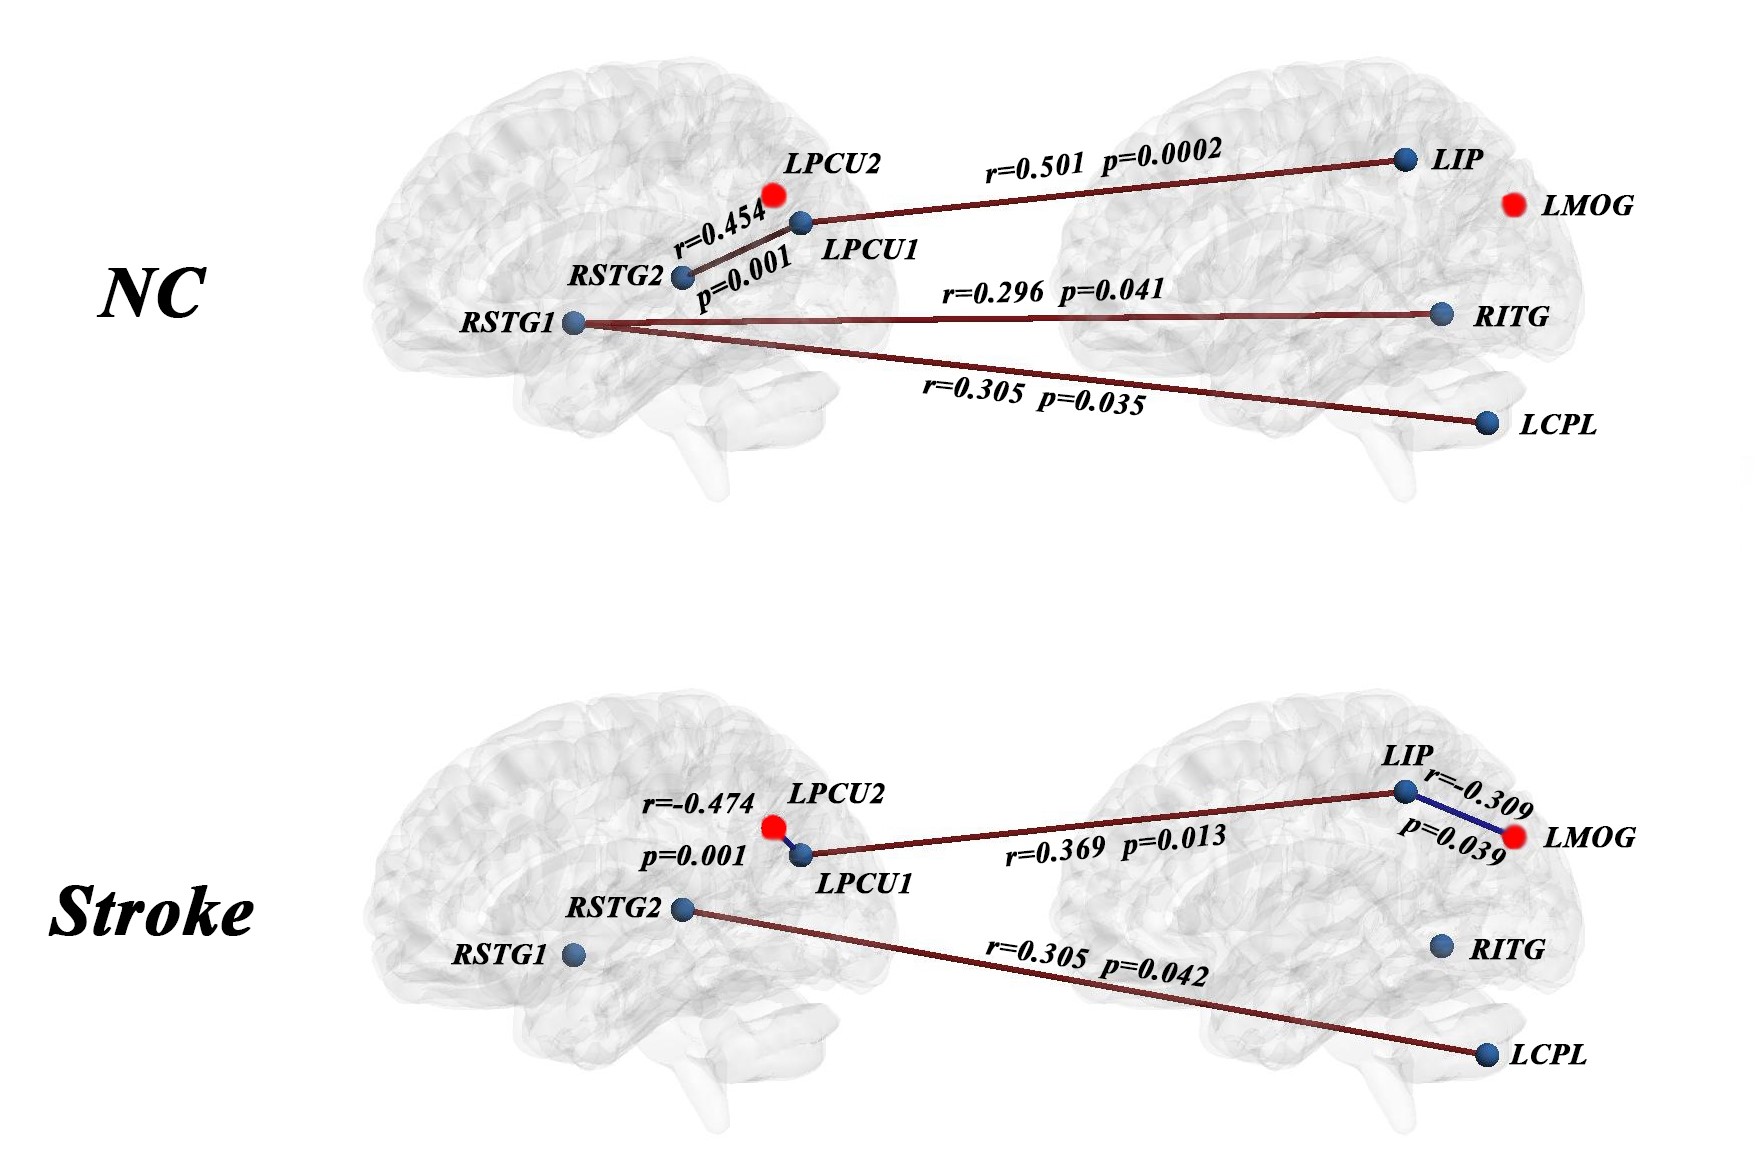
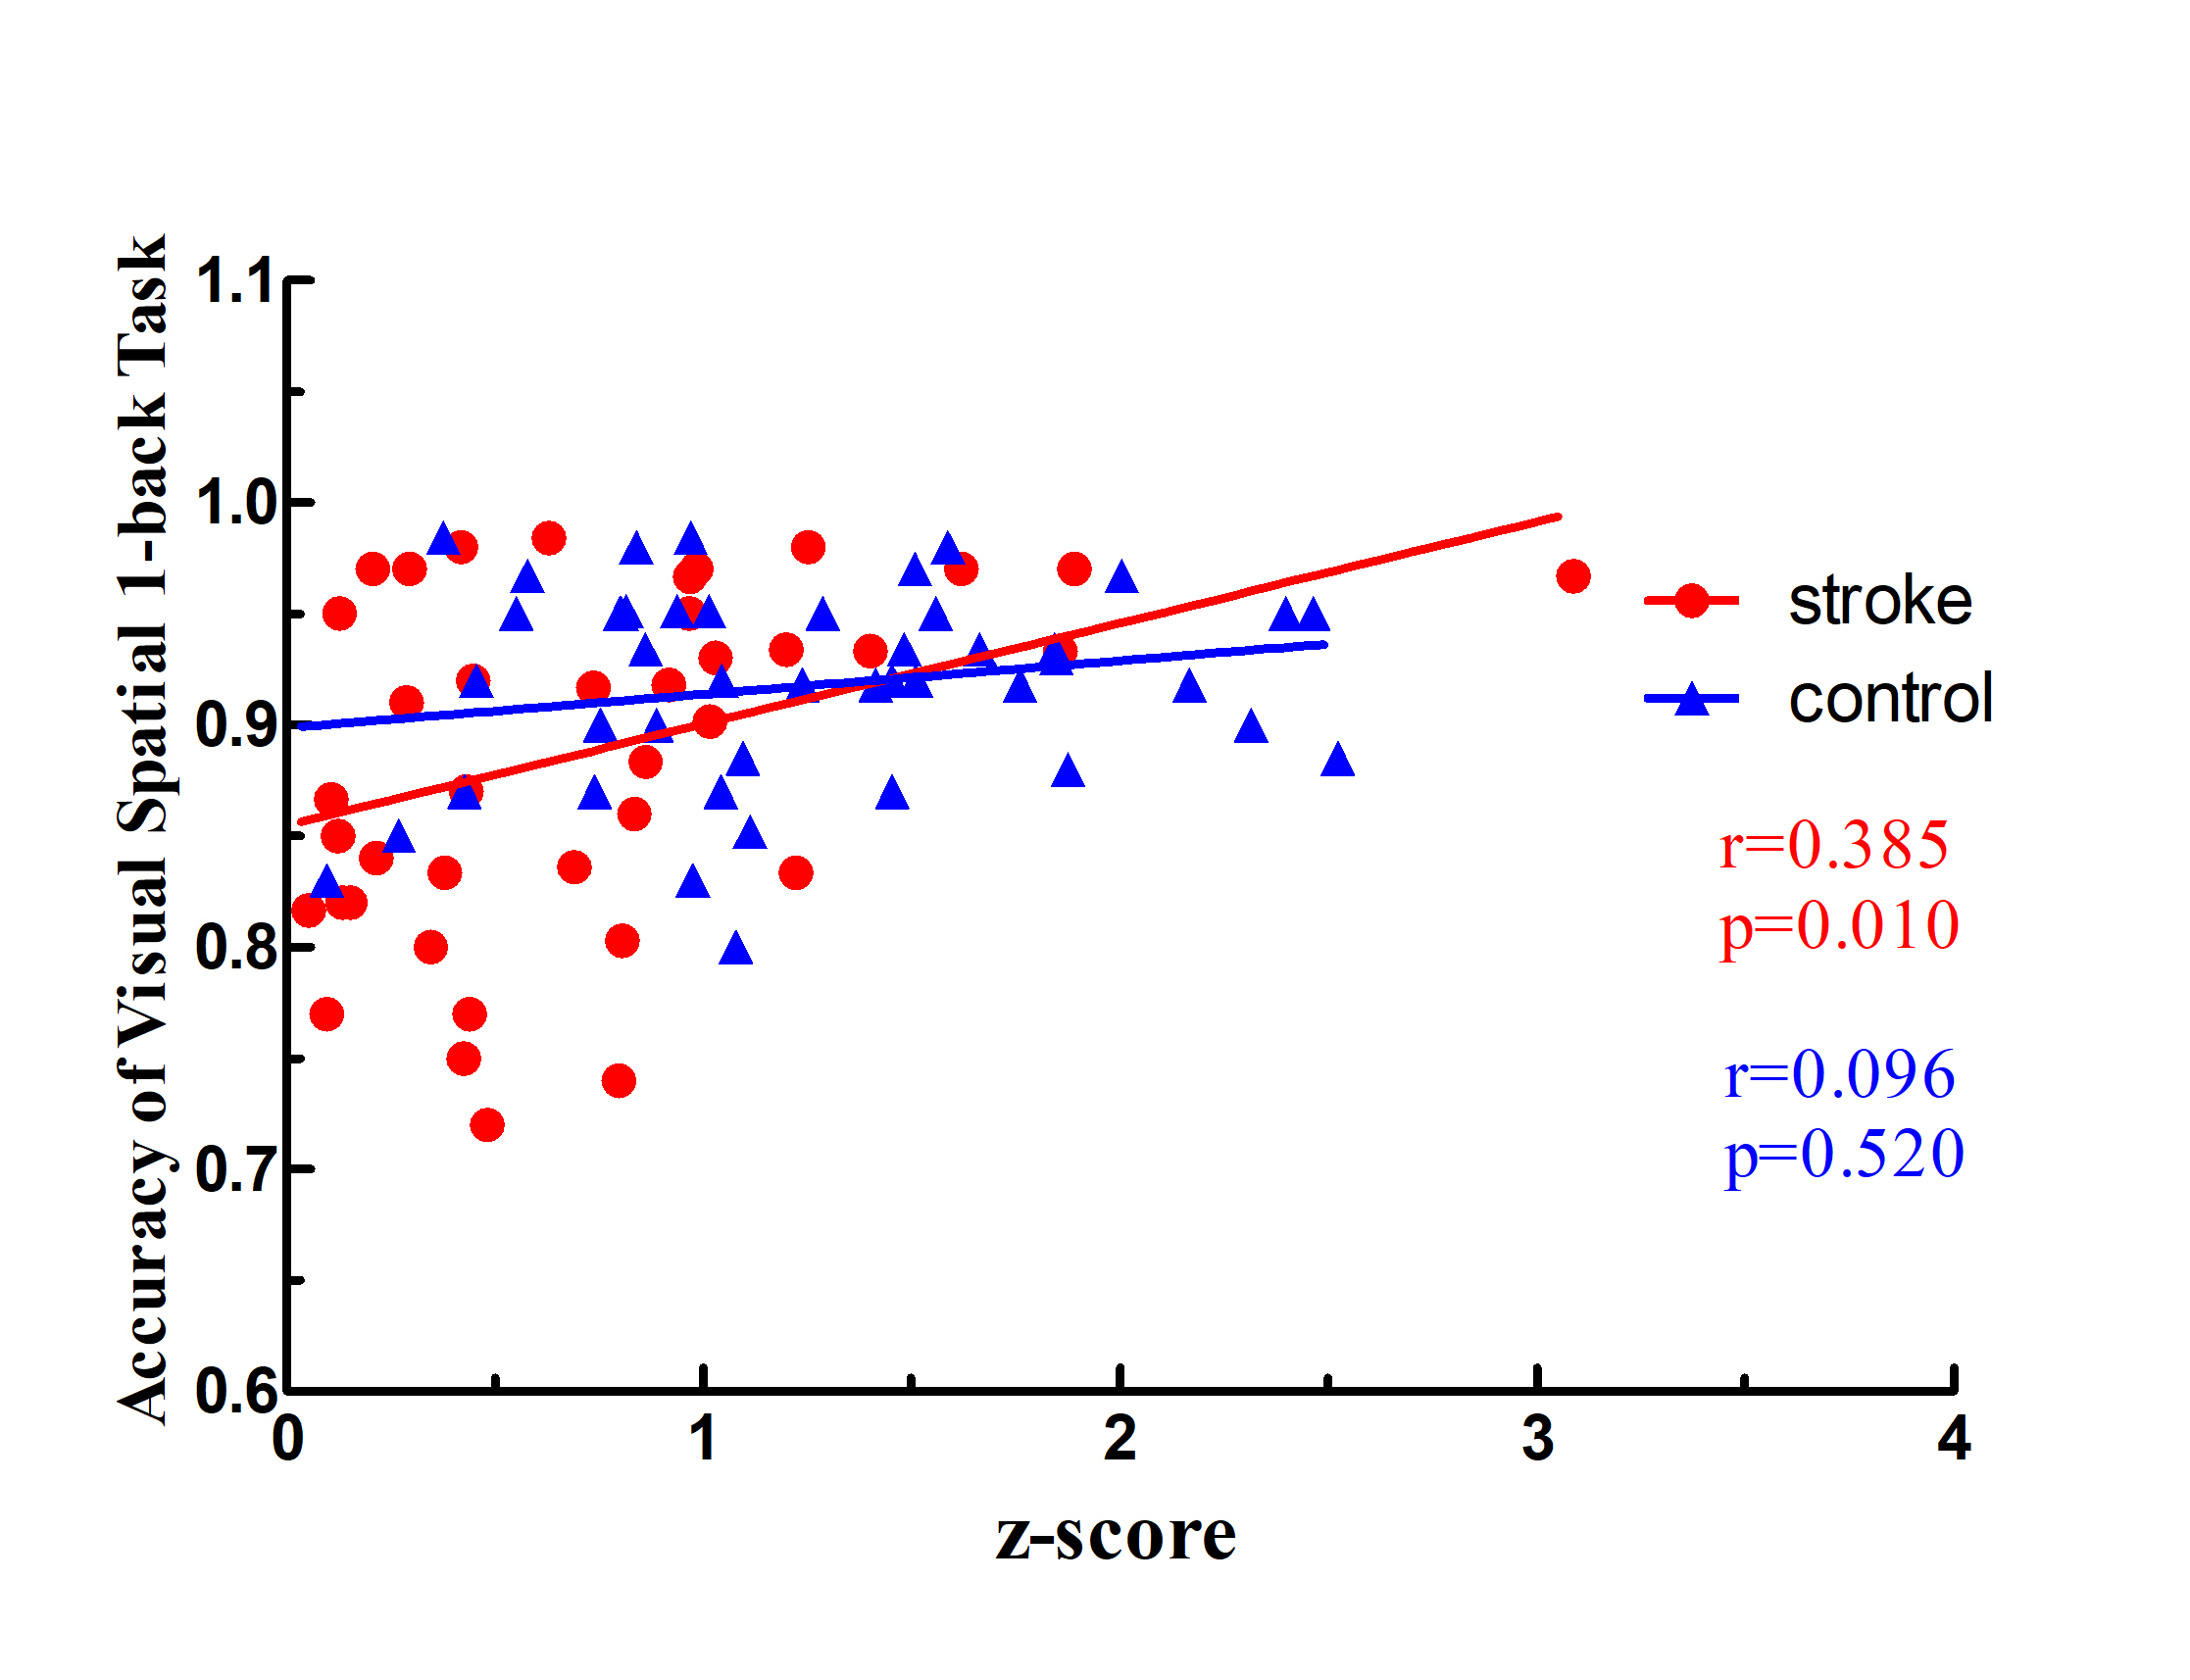
As shown in Figure 1, we identified 14 RSNs including ventral (vSMN) and dorsal SMNs (dSMN), the medial (mVN) and lateral visual networks (lVN), the auditory network (AN), the ventral (vAN) and dorsal ANs (dAN), the anterior (aDMN) and the posterior DMNs (pDMN), the left (lFPN) and right FPN (rFPN), the central execution network (CEN), the salience network (SN) and the cerebellar network (CN). Compared with normal controls, the stroke patients showed significantly worse performance in visual spatial 1-back task (p= 0.003). The difference in FCs between the stroke patients and normal controls were shown in Figure 2. Stroke patients exhibited significantly decreased intranetwork FC in the right inferior temporal gyrus (RITG, Figure 2a) and increased intranetwork FC in the left middle occipital gyrus (LMOG, Figure 2b) of the lVN, decreased intranetwork FC (LPCU1, Figure 2c) and increased intranetwork FC (LPCU2, Figure 2d) in the left precuneus of the pDMN, and significantly decreased intranetwork FC in the right superior temporal gyrus (RSTG1 and RSTG2, Figure 2e-2f) of the AN, the left inferior parietal (LIP, Figure 2g) of the dAN and the left cerebellum posterior lobe (LCPL,Figure 2h) of the CN. Different from significant positive connections in the normal control (NC) individuals (Figure 3), the stroke patients exhibited no significant connections between the RSTG2 and LPCU1, between the RSTG1 and RITG, and between the RSTG1 and LCPL. They also shifted from no significant connections in controls to significant negative connections between the LPCU2 and LPCU1, as well as between the LIP and LMOG, and exhibited significant positive connections between the RITG2 and LCPL. In addition, stroke patients also displayed decreased positive connection between the LPCU1 and LIP. Furthermore, we found there is a significant positive correlation between the FC in the left cerebellum posterior lobe of CN and accuracy of visual spatial 1-back task in stroke group (p = 0.010, r = 0.385) (Figure 4). Our results indicated that the reduced FCs within the cerebellar network may be an important factor for the occurrence of cognitive impairment in patients with pontine infarction.Conclusions
In this study, we found that the FC alterations in stroke group involved both the primary perceptional systems and the higher cognitive control networks. In addition, a significant positive correlation between the FC within the CN and cognitive function scores exists in stroke group. The results suggest that the disconnection within the CN may indicate the extent of cognitive impairment in patients with chronic pontine infarction.Acknowledgements
We are indebted to our patients and their caregivers for generously supporting our study. This study was supported by the Natural Science Foundation of China (81601467, 81871327, 81601472).References
[1] Zhang M,Lin Q,Lu J,et al.Pontine infarction: diffusion-tensor imaging of motor pathways-a longitudinal study[J].Radiology,2015,274(3):841-850.
[2] Jiang L,Liu J,Wang C,et al.Structural Alterations in Chronic Capsular versus Pontine Stroke[J].Radiology,2017,285(1):214-222.
[3] Wang C,Miao P,Liu J,et al.Cerebral blood flow features in chronic subcortical stroke: Lesion location-dependent study[J].Brain research,2019,1706:177-183.
Figures