3979
Changes of functional brain topology in cognitively impaired professional fighters1Lou Ruvo Center for Brain Health, Cleveland Clinic, Las Vegas, NV, United States, 2Department of Neuroscience, University of California, San Diego, La Jolla, CA, United States, 3University of Colorado, Boulder, Boulder, CO, United States
Synopsis
In this study, we utilized graph-theory to investigate functional brain topological alternations in cognitively impaired active professional fighters, as compared to cognitive non-impaired fighters. We observed reduced global and local efficiency across multiple sparsity levels, suggesting that both functional integration and segregation were affected in cognitively impaired fighters. A different functional topological organization was further observed in impaired fighters, shown by increased number of rich clubs and reduced rich-club edge strength and density. Rich club edge strength and density were further significantly correlated with fighters’ psychomotor speed.
Introduction.
Previous studies have shown that active professional fighters who experience repetitive head trauma are at higher risk of developing various neurological disorders including cognitive impairment, as compared to age matched healthy controls1,2. Previous neuroimaging studies have reported abnormalities in brain regional volumes3, functional connectivity strength11 and structural topological organizations4 in cognitively impaired active professional fighters, as compared to non-impaired fighters. However, whether there is a difference in functional topological organizations between cognitively impaired and non-impaired fighters remains unclear. Here we utilized graph-theoretical techniques to investigate brain functional topological alternations in cognitively impaired fighters, and correlations between derived topological measurements and cognitive performance and fighting exposure scores.Methods.
Subjects of this analysis were obtained from the Professional Fighters Brain Health Study (PFBHS)5. Each participant of PFBHS underwent CNS Vital Signs6 tests to measure psychomotor speed (PSY) and processing speed (PSS). PSY and PSS were used to assess fighters’ cognitive performances. Fighters with both PSY and PSS being 1.5 standard deviation below the age, gender, and education adjusted population average were identified as cognitively impaired fighters. Using this criteria, 68 cognitively impaired fighters (65 Male, age=29.78±6.20 years, years of education (YOE) =13.03±2.12 years) and 65 cognitively non-impaired fighters (58 Male, age=28.78±5.27 years, YOE=13.28±1.63 years) were finally included in this analysis. Years of fighting (YOF) and numbers of fights (NOF) were also collected as measurements of fighting exposures for each fighter. MRI data collection. Resting-state fMRI data were collected on a 3T Siemens scanner with TR/TE/ resolution=2.8s/28ms/2x2x4mm, 30 slices, axial acquisition, and 137 time frames. A T1-weighted structural image was acquired using a standard 3D MPRAGE sequence for each subject. Construction of functional network. Each T1 image was input to the FreeSurfer pipeline7 and a subject-specific anatomical segmentation was generated with 66 cortical regions of interest (ROI) based on Desikan-Killiany8 atlas and 12 sub-cortical ROIs. These 78 ROIs were defined as nodes in the functional network. Resting-state fMRI data were slice-timing corrected, realigned to the subject mean image, and spatially smoothed using a 6mm Gaussian filter. Subject-specific segmentations were co-registered to the fMRI native space using 12 parameters affine transformation. Average time series were then extracted from 78 ROIs for each fighter. Edges in the functional network were defined as the Pearson’s correlation coefficient between every ROI pair, and only positive correlation values were kept. Graph theoretical measurements. Global efficiency (Eg), local efficiency (Eloc) and small-worldness measurements were computed using GRETNA toolbox9 at various sparsity thresholds (5%-50%, step=1%) for every subject. The minimum sparsity threshold where the functional network was fully connected for both impaired and non-impaired fighter groups was chosen to study nodal properties. A rich-club analysis was performed to identify functional network hub differences between cognitively impaired and non-impaired fighters. Rich-club nodes were identified for each group; average rich-club edge strength, feeder edge strength and local edge strength were computed for every subject. Rich-club edge density was also defined for every subject as the ratio between the number of actual rich-club edges and the number of edges if rich-club nodes were fully connected. Statistical analysis. Two-sample t-test was performed to determine between-group differences in all graph theoretical measurements. Age, gender, years of education and root-mean-square motion during resting-state fMRI scan were included as covariates. Correlation between graph theoretical measurements and both psychological scores (PSS and PSY) and fighting exposure scores (NOF and YOF) were assessed for cognitively impaired and non-impaired fighters separately, using linear regression analysis with the same covariates. Slopes obtained from linear regressions were further tested for between-group differences. All correlation analysis were conducted using PALM10 toolbox in FSL and significance level for PALM was established at family-wise error corrected p-value less than 0.05 (pcorr<0.05).Results.
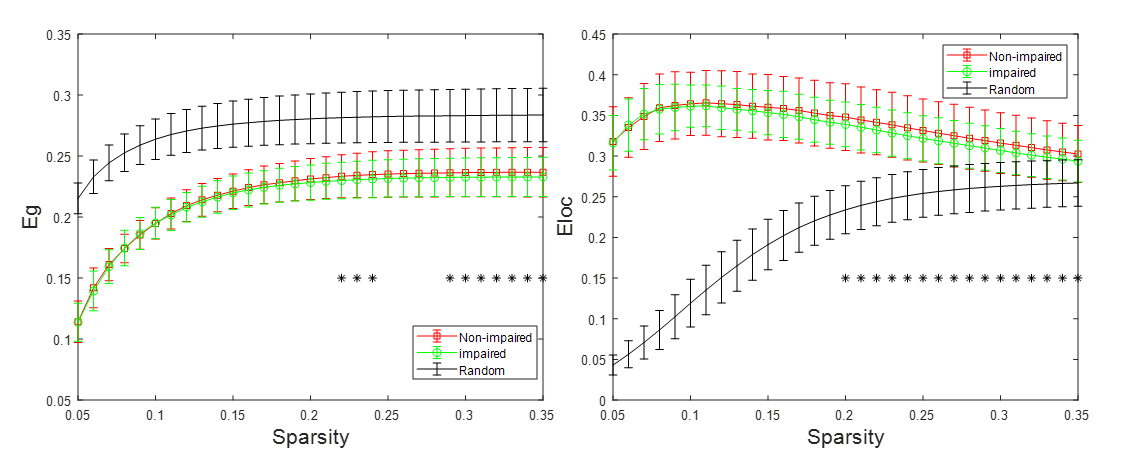
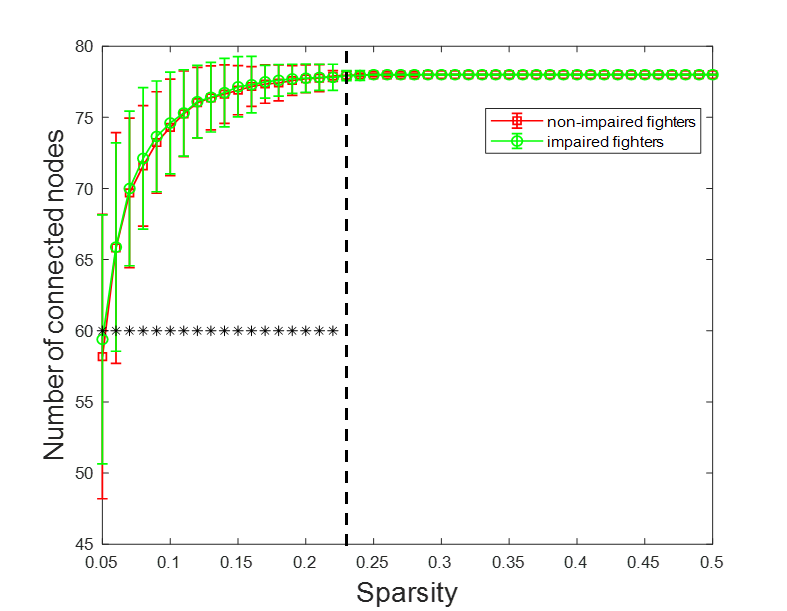
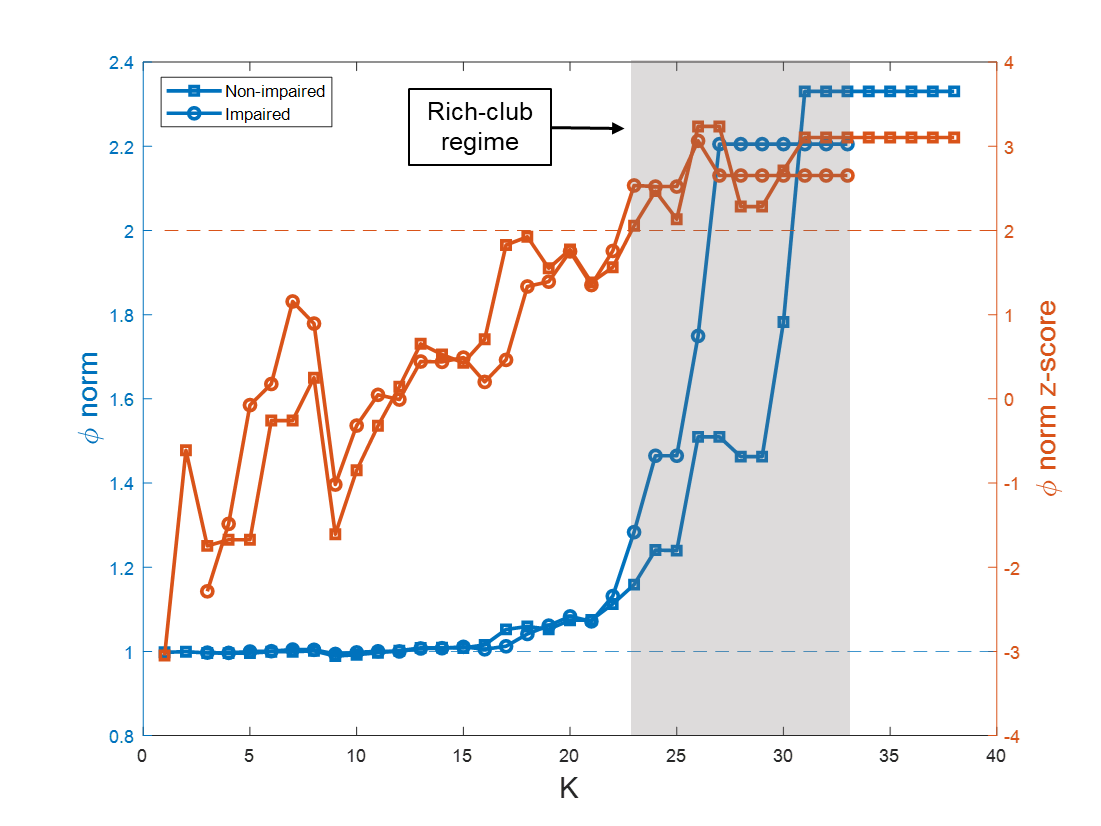
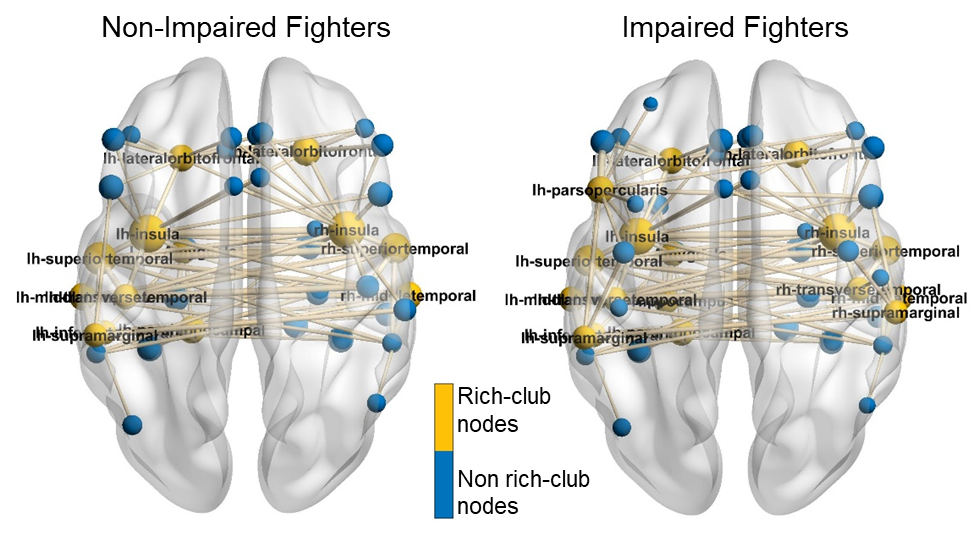
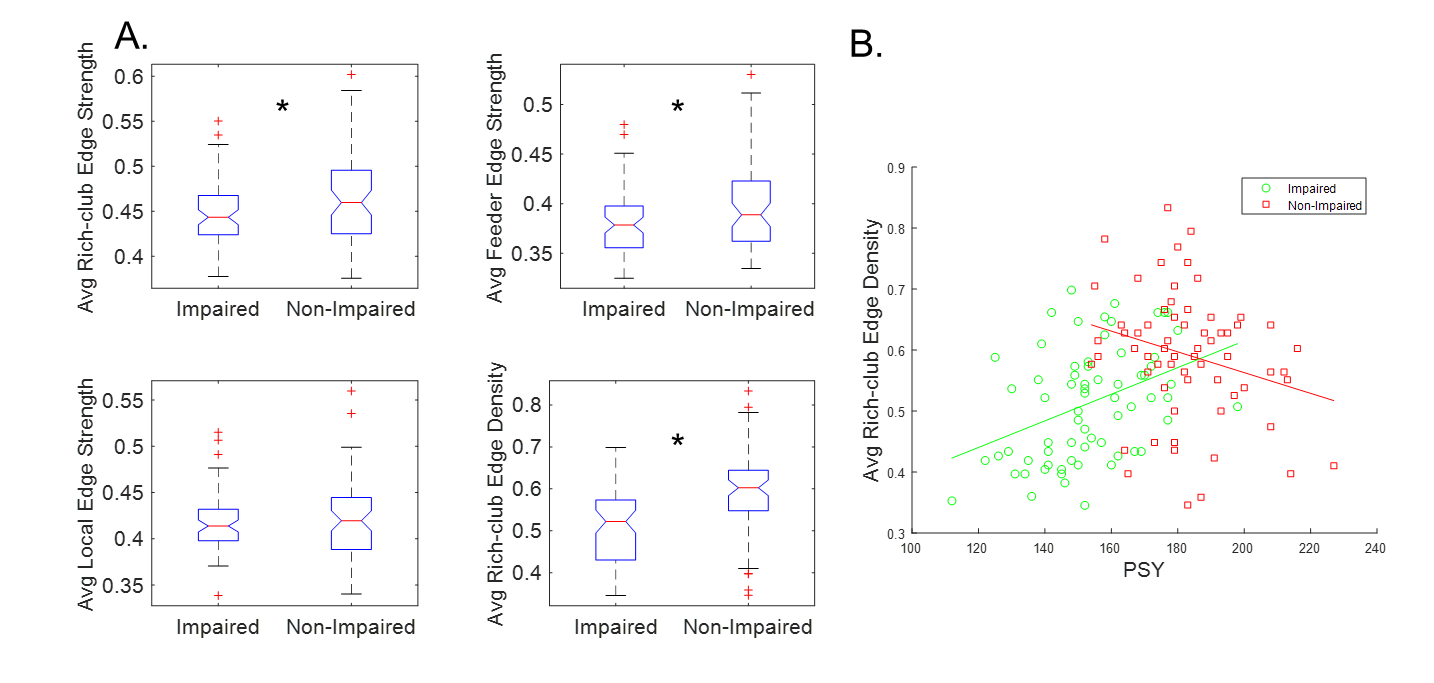
Both reduced global and local efficiency was observed for the cognitively impaired fighters at various sparsity thresholds, as compared to non-impaired fighters (Fig. 1). At a sparsity threshold of 23%, the network was fully connected in both groups (Fig. 2). Both groups exhibited rich-club organization (Fig. 3). However, cognitively impaired fighters had more rich-clubs (Fig. 4) but lower rich-club edge strengths and densities, as compared to cognitively normal fighters (Fig. 5(A)). Both rich-club edge strengths and densities were significantly correlated with neuropsychological scores in both groups (Fig. 5(B)).Discussion.
Our analysis showed both reduced global and local efficiency in cognitively impaired fighters, suggesting an overall loss in functional integration and segregation in functional brain networks along with cognitive impairment in repetitive head trauma, which corroborates previous structural findings4. In addition, a different functional organization was observed in cognitively impaired fighters, as compared to cognitively non-impaired fighters, with more number of rich clubs but weaker rich-club connections, further indicating that more nodes with less strength were recruited for efficient communications in cognitively impaired fighters. These findings together suggest that repeated head trauma is associated with a global functional network re-organization in active professional fighters experiencing cognitive decline.Acknowledgements
The study is supported by the National Institutes of Health (grant number P20GM109025), a private grant from the Peter and Angela Dal Pezzo funds, a private grant from Lynn and William Weidner, a private grant from Stacie and Chuck Matthewson and the young scientist award at Cleveland Clinic Lou Ruvo Center for Brain Health (Keep Memory Alive Foundation). The PFBHS is supported by Belator, UFC, the August Rapone Family Foundation, Top Rank, and Haymon Boxing.References
1. Bazarian JJ, Cernak I, Noble-Haeusslein L, Potolicchio S, Temkin N. Long-term neurologic outcomes after traumatic brain injury. J Head Trauma Rehabil. 2009;24(6):439-451. doi:10.1097/HTR.0b013e3181c15600
2. Mckee AC, Cantu RC, Nowinski CJ, et al. Chronic traumatic encephalopathy in Aathletes: Progrsesive tauopathy following repetitive head injury. J Neuropathol Exp Neurol. 2009;68(7):709-735. doi:10.1097/NEN.0b013e3181a9d503.Chronic
3. Bernick C, Banks SJ, Shin W, et al. Repeated head trauma is associated with smaller thalamic volumes and slower processing speed: The Professional Fighters’ Brain Health Study. Br J Sports Med. 2015;49(15):1007-1011. doi:10.1136/bjsports-2014-093877
4. Mishra VR, Sreenivasan KR, Zhuang X, et al. Understanding white matter structural connectivity differences between cognitively impaired and nonimpaired active professional fighters. Hum Brain Mapp. 2019;(March):hbm.24761. doi:10.1002/hbm.24761
5. Bernick C, Banks S, Phillips M, et al. Professional fighters brain health study: Rationale and methods. Am J Epidemiol. 2013;178(2):280-286. doi:10.1093/aje/kws456
6. Gualtieri CT, Johnson LG. Reliability and validity of a computerized neurocognitive test battery, CNS Vital Signs. Arch Clin Neuropsychol. 2006;21(7):623-643. doi:10.1016/j.acn.2006.05.007
7. Fischl B. FreeSurfer. Neuroimage. 2012;62(2):774-781. doi:10.1016/j.neuroimage.2012.01.021
8. Desikan RS, Ségonne F, Fischl B, et al. An automated labeling system for subdividing the human cerebral cortex on MRI scans into gyral based regions of interest. Neuroimage. 2006;31(3):968-980. doi:10.1016/j.neuroimage.2006.01.021
9. Wang J, Wang X, Xia M, Liao X, Evans A, He Y. GRETNA: A graph theoretical network analysis toolbox for imaging connectomics. Front Hum Neurosci. 2015;9(JUNE):1-16. doi:10.3389/fnhum.2015.00386
10. Winkler AM, Webster MA, Brooks JC, Tracey I, Smith SM, Nichols TE. Non-parametric combination and related permutation tests for neuroimaging. Hum Brain Mapp. 2016;37(4):1486-1511. doi:10.1002/hbm.23115
11. Zhuang X, Mishra V, Yang Z, Sreenivasan K, Bernick C, Cordes D. (2019). Exploring static and dynamic functional connectivity differences between cognitively impaired and non-impaired active professional fighters. ISMRM 27th Annual Meeting, Montreal,
Figures