3975
Studying the impact of impaired perfusion and oxygen metabolism on resting-state fMRI-based functional connectivity by simulating blood oxygenation fluctuations
Christine Preibisch1,2,3, Mario E. Archila-Melendez1,3, Stephan Kaczmarz1,3, and Christian Sorg1,3
1Department of Neuroradiology, Technische Universität München, School of Medicine, Munich, Germany, 2Clinic of Neurology, Technische Universität München, School of Medicine, Munich, Germany, 3TUM NIC, Technische Universität München, School of Medicine, Munich, Germany
1Department of Neuroradiology, Technische Universität München, School of Medicine, Munich, Germany, 2Clinic of Neurology, Technische Universität München, School of Medicine, Munich, Germany, 3TUM NIC, Technische Universität München, School of Medicine, Munich, Germany
Synopsis
Functional magnetic resonance imaging (fMRI) of blood oxygenation level dependent (BOLD) signals in the resting state is widely used to study functional connectivity of slowly fluctuating ongoing brain activity (BOLD-FC) in humans, particularly also in patients. While physiological impairments, e.g. aberrant perfusion, are common in neurological and psychiatric disorders, their impact on measured BOLD-FC is widely unknown and ignored. The aim of our simulation study, therefore, was to investigate how alterations in neurovascular coupling influence resting-state BOLD-FC measures. Our results demonstrate crucial impact of neurovascular coupling on BOLD-FC due to changes in CMRO2, CBF, CBV, in both amplitudes and delays.
Introduction
Blood oxygenation level dependent (BOLD) functional magnetic resonance imaging (fMRI) at rest is widely used to map human brain functional connectivity of slowly fluctuating ongoing activity (BOLD-FC).1,2 In patients with brain disorders, alterations in BOLD-FC3-6 are commonly interpreted in terms of neuronal impairments. The validity of this interpretation requires a tight coupling between neuronal activity and subsequent vascular-hemodynamic processes underlying the BOLD effect. Recently, significant impact of healthy hemodynamic response function variability on BOLD-FC has been demonstrated.7 More pronounced effects are expected when cerebrovascular reactivity, oxygen metabolism or perfusion are reduced in neurological8-12 and psychiatric disorders,13-15 which was not systematically investigated yet. The aim of our simulation study was, therefore, to investigate how distinct alterations in neurovascular coupling influence BOLD-based FC-fMRI measures at rest.Methods
BOLD signal simulations: All simulations were performed using Simulink and MATLAB R2018b (MathWorks). Our implementation of the Balloon model16-18 essentially follows Simon and Buxton19 (Fig.1). Most importantly, their model allows for independent changes in cerebral metabolic rate of oxygen (CMRO2) and cerebral blood flow (CBF) (Figs.1&2). Synthetic input neuronal activity N(t) with low frequency modulations (meant to mimic intrinsic or ongoing slowly fluctuating neuronal activity) was generated by exploiting power-to-power cross-frequency coherence20 between time series with three different frequencies (60, 10, 0.05Hz). Coupling to a boxcar portion allowed for prompt assessment of simulated BOLD signal behavior. Fig.2 illustrates the BOLD signal simulation process for the reference signal (with temporal resolution TR=1000ms) that was kept identical across all FC simulations. Prescribed changes for the reference curve follow previous observations and assumptions for healthy subjects.19 Fig.3 summarizes BOLD signal time curves (BOLD-TCs) simulated across a wide range of possible (patho-) physiological alterations in perfusion and oxygen metabolism.BOLD-FC analyses: Using an identical neuronal input (N(t)) throughout, the dependence of BOLD-FC on alterations of hemodynamic parameters was explored by adopting a seed-based BOLD-FC-approach. Fig.4 illustrates the basic idea: Correlation coefficients (CC) were calculated between the green-rimmed intrinsic signal portions of the reference signal (seed S, Fig.2c) and the simulated BOLD-TCs of target regions Xi,j across a range of parameters (Fig.3). Three different scenarios were explored with respect to effects of independent changes in (1) CBF and CMRO2 amplitudes (m1, f1), (2) CBF and CMRO2 delays (τm, τf), and (3) CBV amplitude and delay (αv, τv). For each pair of parameters, BOLD-FC values were calculated for 16x16 different realizations of added random noise at constant signal-to-noise-ratio (SNR0=250), which were then represented as matrices of CC and p-values for each scenario (Fig.5).
Results
The simulated reference BOLD-TC (seed) elicited by the prescribed neuronal input N(t), assuming healthy CMRO2, CBF and CBV changes, TR=1000ms and SNR0=250, appears reasonably realistic, showing typical transients, evident especially in the boxcar portion of the simulated signal (Fig.2). An incomplete summary of (noise-free) simulated BOLD-TCs (Fig.3) demonstrates a wide variation in amplitudes and shapes. These BOLD-TCs, complemented with noise, served as target regions Xi,j for FC-calculations across three different scenarios (Fig.4&5).Scenario 1: BOLD-TCs vary from all negative BOLD signal changes (relative to baseline) at missing CBF response (f1=1, Fig.3b) to all positive changes at maximum CBF (f1=1.6, Fig.3d). At intermediate values (f1=1.2), BOLD signal changes vary from positive to negative with increasing CMRO2 amplitude (m1=[1-1.3], Fig.3c). Accordingly, correlations with the reference BOLD-TC (seed S, Fig.2) are significantly positive or negative in the upper left and lower right corners with maximum CBF and CMRO2 amplitudes (Fig.5a,d). Between those extremes lies a diagonal area with negligible BOLD effects and CCs.
Scenario 2: Complex BOLD signal behaviors are observed for variable CMRO2 and CBF delay constants (Fig.3f-h). Marked transients occur, the more CMRO2 and CBF changes get out of phase. Significant positive correlations are centered on τf=2, increasing with τm. For τf>≈4, significant negative correlations are observed, centered on the reference value τm=2 (Fig.5b,e). In between, getting broader towards higher CMRO2 and CBF delays, exists an extended area with insignificant correlations.
Scenario 3: Simulated BOLD-TCs do not vary a lot, especially for low αv and high τv (Fig.3j-l). This is mirrored by extended areas of significantly positive CC values. Only a small area around maximum αv at low τv shows insignificant negative correlations (Fig.5c,f).
Discussion
Our results demonstrate crucial impact of neurovascular coupling on BOLD-FC, i.e. correlations between the BOLD-TC of a defined ‘non-impaired’ seed reference and an ‘impaired’ target region for a wide range of physiological conditions, including prescribed changes in CMRO2, CBF, CBV amplitudes and delays. Our finding of highly significant positive correlations for BOLD-TCs simulated with high CBF amplitudes fit well with previous work demonstrating coupling of BOLD-FC with regional CBF,21 while low and insignificant correlations fit with observations of reduced BOLD connectivity in areas exhibiting hypoperfusion.22 In addition, our simulations imply a distinct dependence of FC values on relative delays in CMRO2, CBF and to a lower extent on CBV, which have not yet been demonstrated.Conclusion
Based on these preliminary simulation results, we suggest that modeling of hemodynamic coupling with respect to intrinsic neuronal activity might help to gain insights on the crucial interplay between vascular-hemodynamic components that should be taken into account when estimating intrinsic functional connectivity, especially in patients with potential vascular pathologies.Acknowledgements
This work was supported by the German Research Foundation DFG [grant numbers PR 1039/6-1, SO 1336/4-1]References
- Biswal B, Yetkin FZ, Haughton VM,Hyde JS, Functional connectivity in the motor cortex of resting human brain using echo-planar MRI. Magn Reson Med, 1995. 34(4): p. 537-41.
- Fox MD, Raichle ME, Spontaneous fluctuations in brain activity observed with functional magnetic resonance imaging. Nat Rev Neurosci, 2007. 8(9): p. 700-11.
- Zhang D, Raichle ME, Disease and the brain's dark energy. Nat Rev Neurol, 2010. 6(1): p. 15-28.
- Greicius MD, Srivastava G, Reiss AL,Menon V, Default-mode network activity distinguishes Alzheimer's disease from healthy aging: evidence from functional MRI. Proc Natl Acad Sci U S A, 2004. 101(13): p. 4637-42.
- Sorg C, Riedl V, Muhlau M, Calhoun VD, Eichele T, Laer L, et al., Selective changes of resting-state networks in individuals at risk for Alzheimer's disease. Proc Natl Acad Sci U S A, 2007. 104(47): p. 18760-5.
- Manoliu A, Riedl V, Zherdin A, Muhlau M, Schwerthoffer D, Scherr M, et al., Aberrant dependence of default mode/central executive network interactions on anterior insular salience network activity in schizophrenia. Schizophr Bull, 2014. 40(2): p. 428-37.
- Rangaprakash D, Wu GR, Marinazzo D, Hu X,Deshpande G, Hemodynamic response function (HRF) variability confounds resting-state fMRI functional connectivity. Magn Reson Med, 2018. 80(4): p. 1697-713.
- Stickland R, Allen M, Magazzini L, Singh KD, Wise RG,Tomassini V, Neurovascular Coupling During Visual Stimulation in Multiple Sclerosis: A MEG-fMRI Study. Neuroscience, 2019. 403: p. 54-69.
- Göttler J, Kaczmarz S, Kallmayer M, Wustrow I, Eckstein HH, Zimmer C, et al., Flow-metabolism uncoupling in patients with asymptomatic unilateral carotid artery stenosis assessed by multi-modal magnetic resonance imaging. J Cereb Blood Flow Metab., 2019.
- De Vis JB, Bhogal AA, Hendrikse J, Petersen ET,Siero JCW, Effect sizes of BOLD CVR, resting-state signal fluctuations and time delay measures for the assessment of hemodynamic impairment in carotid occlusion patients. Neuroimage, 2018. 179: p. 530-39.
- Taneja K, Lu H, Welch BG, Thomas BP, Pinho M, Lin D, et al., Evaluation of cerebrovascular reserve in patients with cerebrovascular diseases using resting-state MRI: A feasibility study. Magn Reson Imaging, 2019. 59: p. 46-52.
- Liu P, Pinho M, Li Y, Pan L, Welch B,Lu H, Towards Self-Calibrated Functional Connectivity Mapping. Proc. Intl. Soc. Mag. Reson. Med. , 2017. 25: p. 1665
- Chen JJ, Cerebrovascular-Reactivity Mapping Using MRI: Considerations for Alzheimer's Disease. Front Aging Neurosci, 2018. 10: p. 170.
- Riederer I, Bohn KP, Preibisch C, Wiedemann E, Zimmer C, Alexopoulos P, et al., Alzheimer Disease and Mild Cognitive Impairment: Integrated Pulsed Arterial Spin-Labeling MRI and (18)F-FDG PET. Radiology, 2018. 288(1): p. 198-206.
- Oliveira ÍAF, Guimarães TM, Souza RM, Dos Santos AC, Machado-de-Sousa JP, Hallak JEC, et al., Brain functional and perfusional alterations in schizophrenia: an arterial spin labeling study. Psychiatry Res Neuroimaging., 2018. 272: p. 71-78.
- Buxton RB, Frank LR, Wong EC, Siewert B, Warach S,Edelman RR, A general kinetic model for quantitative perfusion imaging with arterial spin labeling. Magn Reson Med, 1998. 40(3): p. 383-96.
- Buxton RB, Uludag K, Dubowitz DJ,Liu TT, Modeling the hemodynamic response to brain activation. Neuroimage, 2004. 23 Suppl 1: p. S220-33.
- Obata T, Liu TT, Miller KL, Luh WM, Wong EC, Frank LR, et al., Discrepancies between BOLD and flow dynamics in primary and supplementary motor areas: application of the balloon model to the interpretation of BOLD transients. Neuroimage, 2004. 21(1): p. 144-53.
- Simon AB, Buxton RB, Understanding the dynamic relationship between cerebral blood flow and the BOLD signal: Implications for quantitative functional MRI. Neuroimage, 2015. 116: p. 158-67.
- Canolty RT, Knight RT, The functional role of cross-frequency coupling. Trends Cogn Sci, 2010. 14(11): p. 506-15.
- Liang X, Zou Q, He Y,Yang Y, Coupling of functional connectivity and regional cerebral blood flow reveals a physiological basis for network hubs of the human brain. Proc Natl Acad Sci U S A, 2013. 110(5): p. 1929-34.
- Göttler J, Riederer I, Pasquini L, Bohn KP, Alexopoulos P, Beller E, et al. Reduced BOLD connectivity is related to hypoperfusion in Alzheimer’s disease in Proc. Intl. Soc. Mag. Reson. Med. 2017.
- Grubb RL, Jr., Raichle ME, Eichling JO,Ter-Pogossian MM, The effects of changes in PaCO2 on cerebral blood volume, blood flow, and vascular mean transit time. Stroke, 1974. 5(5): p. 630-9.
- Chen JJ, Pike GB, MRI measurement of the BOLD-specific flow-volume relationship during hypercapnia and hypocapnia in humans. Neuroimage, 2010. 53(2): p. 383-91.
Figures
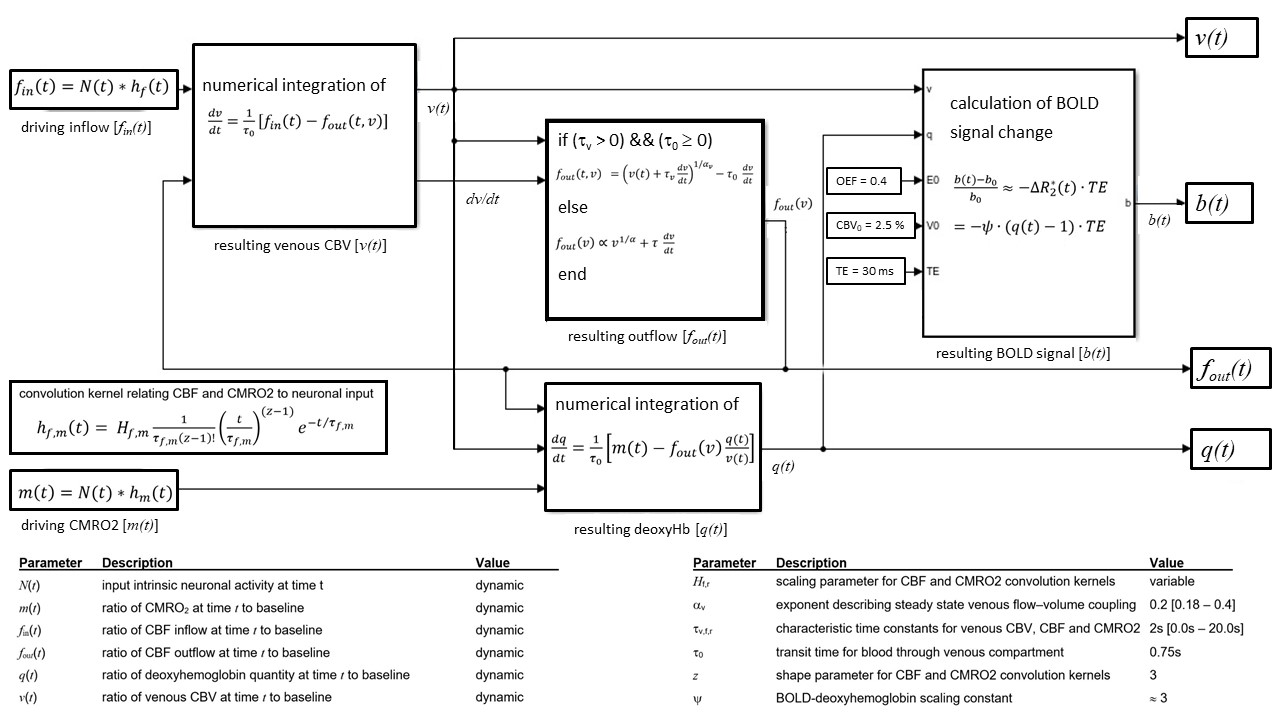
Figure 1: Dynamic BOLD
signal simulations. Following Simon
&Buxton,19 independent dynamic CBF (fin(t)) and CMRO2 (m(t)) input functions are generated using
independent CMRO2 and CBF amplitudes (m1, f1) and characteristic time constants
(τm, τf). Coupling between
CBF and CBV assumes a power law and viscoelastic vascular effects with flow–volume
coupling exponent αv23, 24 and characteristic time constant τv, allowing independent CBV amplitude and delay
variations. A system of differential equations yields deoxyhemoglobin content (q(t))
and finally BOLD signal changes (b(t)).
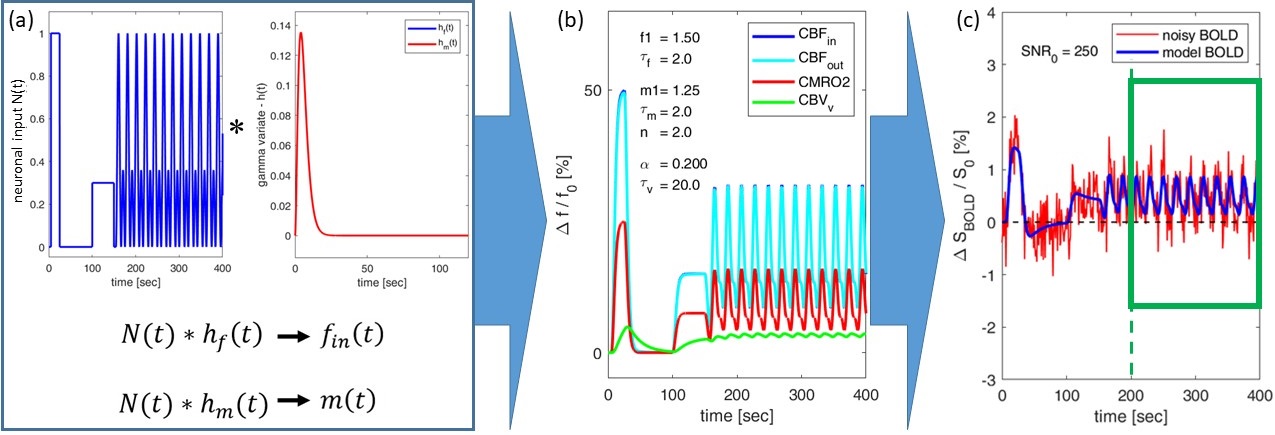
Figure 2: Simulation process for BOLD reference signal. (a) Convolution of
the neuronal input signal N(t) with gamma variate functions hf(t) and hm(t) yields independent normalized
inputs fin(t) (CBFin) and m(t) (CMRO2). (b) Relative changes in outflow CBFout (≈CBFin) and CBVv
are derived via simulations19 (Fig.1), assuming evoked
changes in CMRO2 (m1 = 1.25, τm = 2.0), CBF (f1 = 1.5, τf = 2.0), and CBV (αv = 1.5, τv = 20.0). (c) The resulting BOLD signal (blue) is complemented with
random noise (red) yielding SNR0 = 250. A green box frames the
signal portion used for BOLD-FC calculations.
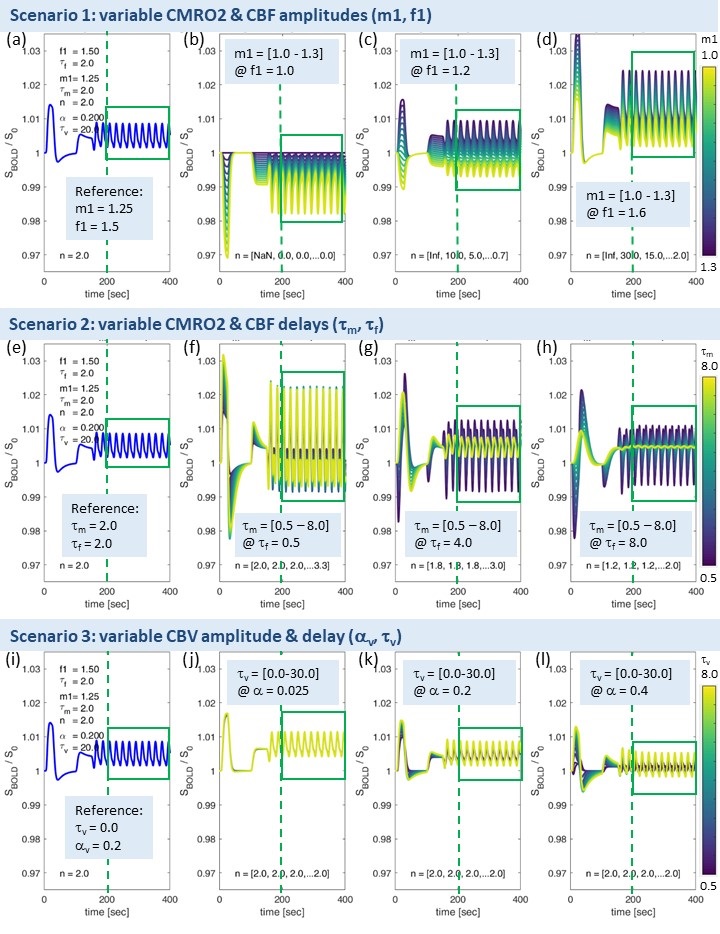
Figure
3. Range of simulated
BOLD-TCs. Note: identical
’non-impaired’ reference BOLD-TCs (a,e,i) replicate Fig.2c. BOLD-TCs for range of CMRO2
changes at absent (b), 20% (c) and maximum CBF change (d). BOLD-TCs for range
of CMRO2 delays at minimum (f), intermediate (g), and maximum CBF delay (h).
BOLD-TCs for range of CBV delays at minimum (j), intermediate (k) and maximum
(l) flow-volume coupling exponent αv. Line colors change from dark blue to yellow along given ranges of m1
(b-d), τm (f-h) and τv (j-l) (color bars). Signal portions used for FC calculations are marked
by green boxes.
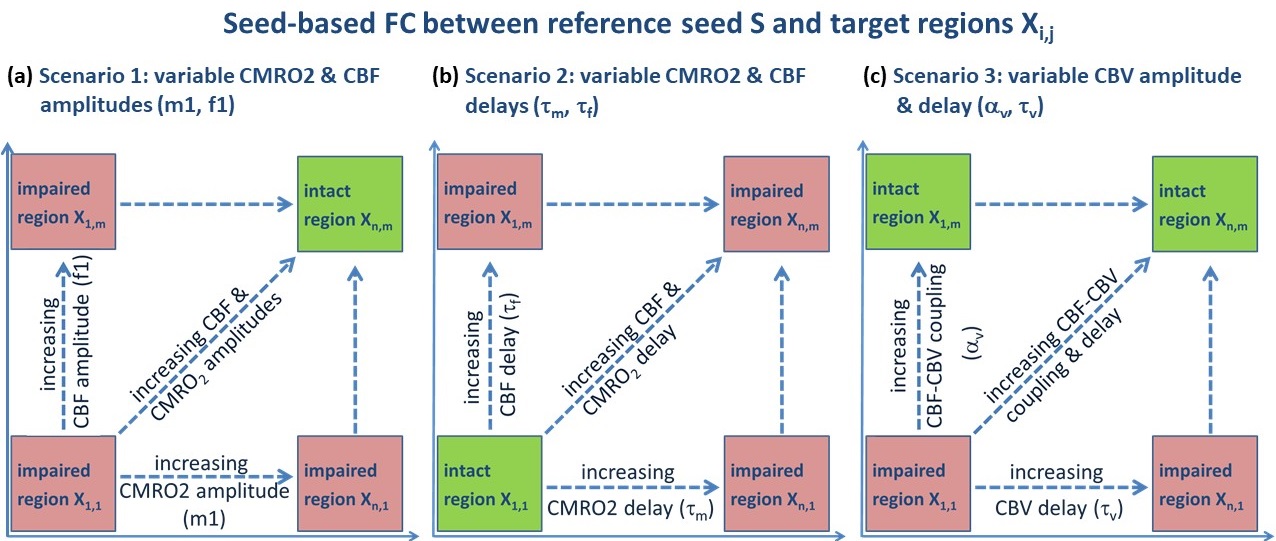
Figure 4: Framework for
exploring the influence of neurovascular coupling on BOLD-FC. Mimicking seed-based BOLD-FC analyses,
correlations were calculated between a seed S, i.e. the reference BOLD-TC (Fig.3a,e,i),
and BOLD signals from regions Xi,j (Fig.3b-d, f-h, j-l). Three
scenarios comprise independent changes in (a) CMRO2 and CBF amplitudes (m1,
f1), (b) CMRO2 and CBF characteristic time constants (τm, τf), and (c) CBV
amplitude and delay (αv, τv). This results in correlation coefficient (CC)
matrices where correlation strength depends on parameter variations (Fig.5).
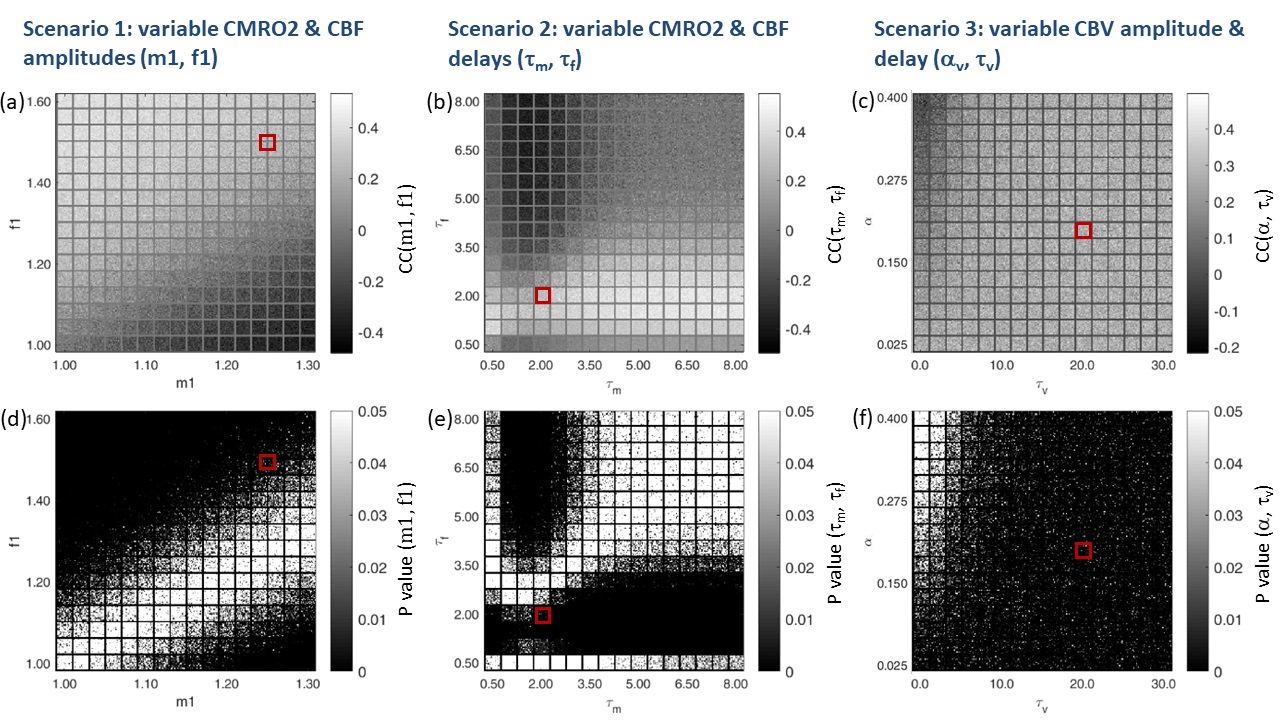
Figure 5. Correlation coefficients (CC) reflecting FC (a-c) and p-values
(d-f) between the BOLD seed S (Fig.3a,e,i)
and targets Xi,j (Fig. 3b-d, f-h, j-l) simulated across three different scenarios (Fig.4). At SNR0
= 250, 16x16 different noise realizations were calculated for each pair
of investigated parameters. Red squares indicate the location of the reference seed
TC in the respective parameter spaces. CC matrices are individually scaled for
each scenario between minimum and maximum (scale bars). Maps of p-values are
truncated at p = 0.05, rendering insignificant voxels white.