3973
Mitigating effects of temporal filter of time-series for reliability of connectome calculations.1Department of Psychiatry, University of Utah, Salt Lake City, UT, United States, 2Biostatistics, The Johns Hopkins University, Baltimore, MD, United States
Synopsis
Temporal filtering is a typical step in preprocessing of BOLD time-series for calculation of resting-state correlations, which are the basis of a connectome calculation. Bandpass filtering is a usual step in preprocessing of resting-state BOLD time-series data. Temporal filtering can introduce bias in the correlation calculations resulting in artifact in the connectome affecting the reliability in a connectome. We demonstrate this effect in simulations and then show this in data from the Human Connectome Project. We also show how to mitigate this issue for high reliability of the connectome as measured by image intraclass correlation coefficient (I2C2).
INTRODUCTION
Temporal filtering is a typical step in preprocessing of BOLD time-series for calculation of resting-state correlations, which are the basis of a connectome calculation. Bandpass filtering[1] is a usual step in preprocessing of resting-state BOLD time-series data. Temporal filtering can introduce bias[2] in the correlation calculations resulting in artifact in the connectome affecting the reliability in a connectome. We demonstrate this effect in simulations and then show this in data from the Human Connectome Project. We also show how to mitigate this issue for higher reliability of the connectome as measured by image intraclass correlation coefficient (I2C2)[3]. A typical filter implemented is a Fast Fourier Transform (FFT) filter or a Butterworth Filter (of order 4 or 6) that passes frequencies from 0.010 Hz To 0.100 Hz.METHODS
We have taken an approach of testing the impact of temporal filtering on simulated data and on resting-state data from the Human Connectome Project (500 subject release). For the simulation, we have simulated pairs of time-series by constructing these from a frequency range of 0.005 to 0.200 Hz. In this frequency range, random phase for each frequency component was assigned between 0 and π. Amplitude for each frequency component was randomize from a normal distribution. During the construction of these synthetic data, we also calculated the Ground Truth signal between 0.010 – 0.100 Hz. We simulated 10,000 pairs per specified filter. For the synthetic data, we calculate the change in the correlation between two time-series compared to the correlation of the Ground Truth time-series.For the Human Connectome Project (HCP) data, we have taken the unprocessed data and executed the following preprocessing steps. From the 500 Subject Release we calculated the mean frame displacement for the resting-state time-series. We then required that all 4 resting-state scans (phase encode L-to-R, R-to-L, and on Day 1 and Day 2) to have mean frame displacement less than 0.30mm to ensure no motion induced artifact. This resulted in in 30 sessions. One of these sessions had a truncated time-series, leaving 29 sessions. Time-series data were realigned, registered to the T1-weighted high-resolution image, and then normalized to the MNI standard space. All data pre-preprocessing was executed in SPM12 (Release 7219) in MATLAB 2015b. The resulting spatially normalized data were then smoothed with a 5mm Gaussian kernel. Resting state connectomes were then calculated using the Shen Atlas (registered to MNI space, but removal of the cerebellum) of 220 regions of interest. The following nuisance regressors were included: motion, first-temporal derivative of motion, squares of these, estimates of physiological artifact based on the COMPOR methods (top 5 PCA components) for white-matter and cerebral spinal fluid. The nuisance was done in a way as to not reintroduce artifact[4].
The HCP connectome was then always calculated using the middle 750 resulting time-points. We varied the amount of time-series padding from 225 time-points in the head and tail down to 0 time-points in the head and tail. The filter was applied after the head and tail were trimmed, which allowed us to investigate the effects of filters. The connectomes were calculated for Day 1 and Day 2 for the different acquisition phase encode directions. Correlation was calculated to account for the effective degrees of freedom[5].
RESULTS
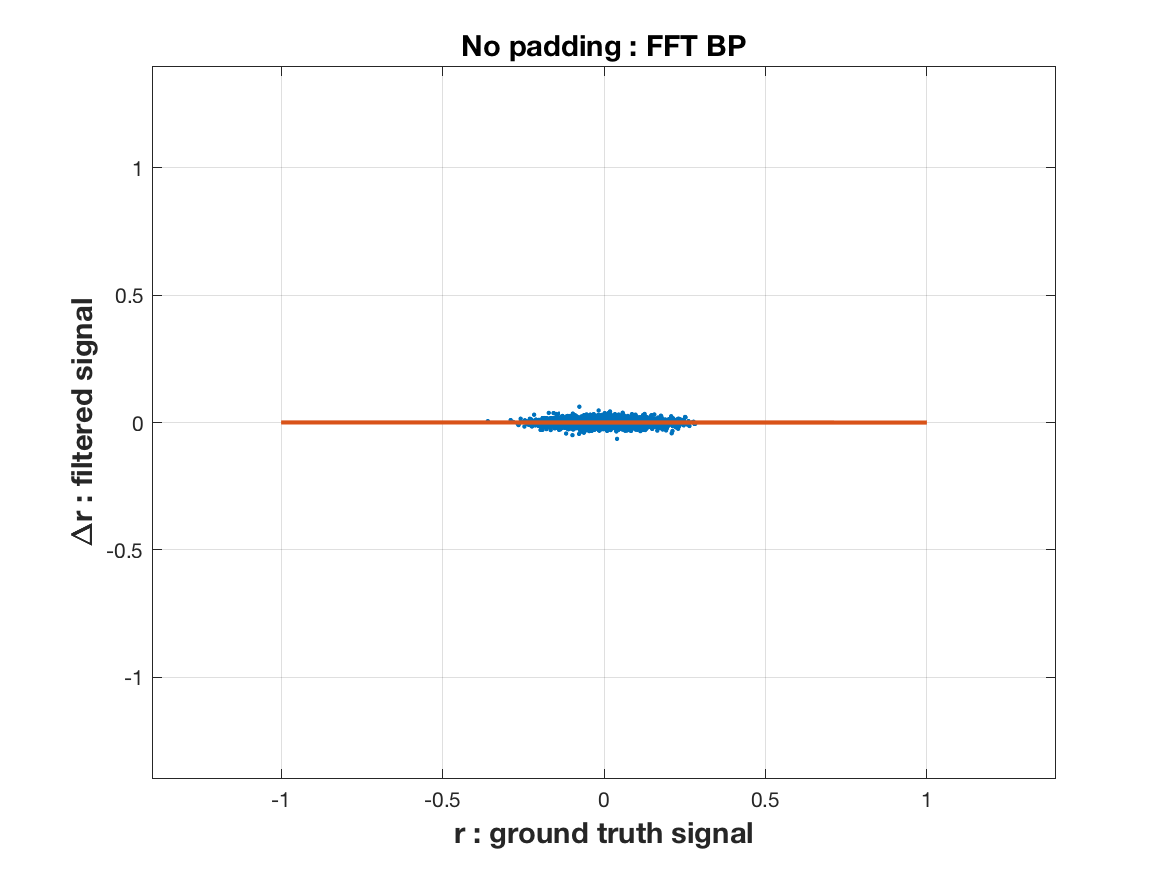
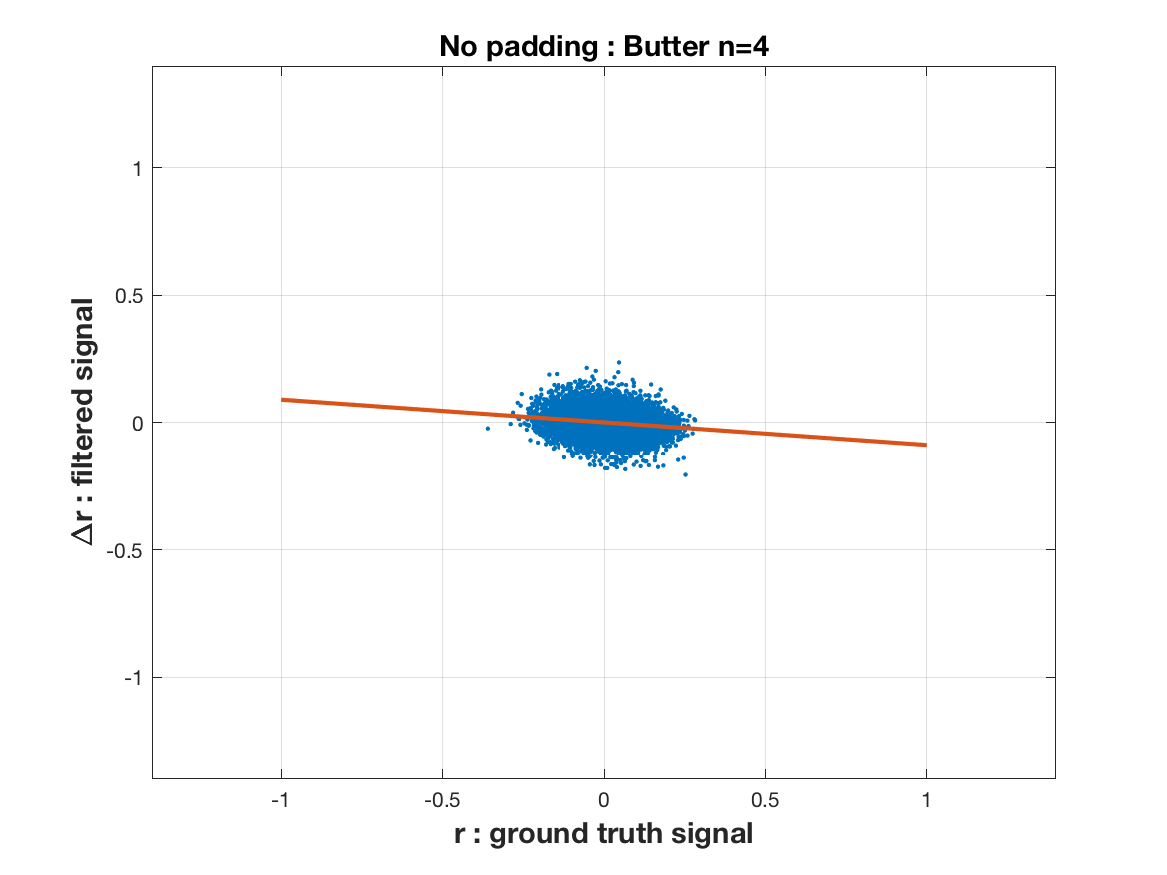
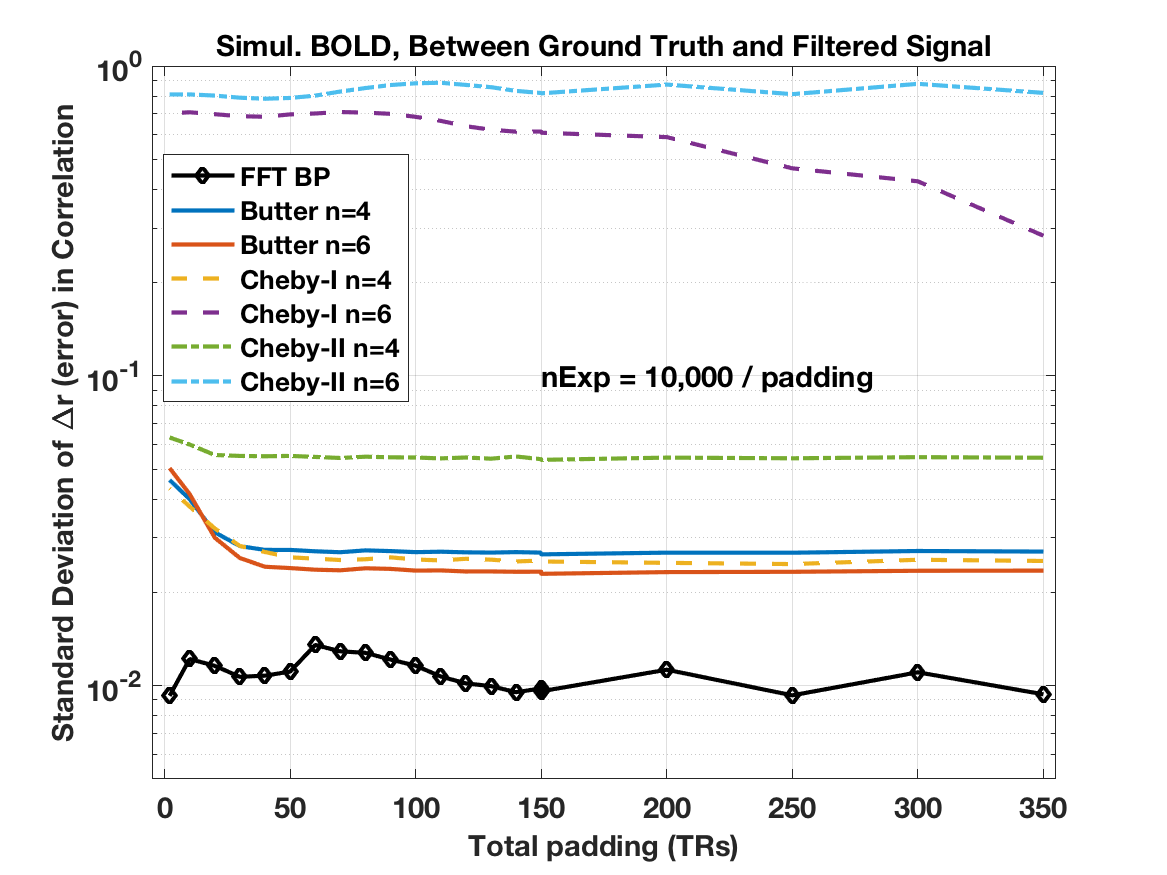
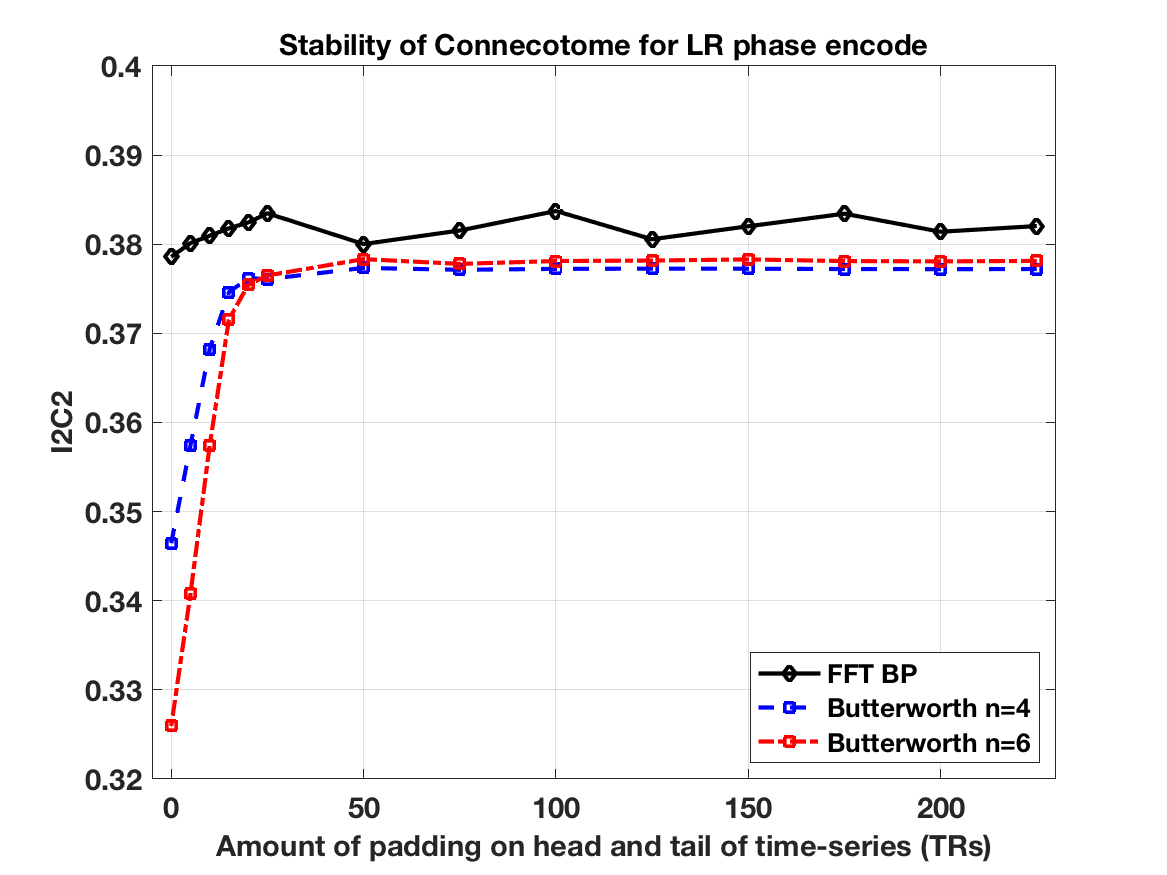
The simulations show that the FFT filter does not introduce a bias in the correlation coefficient compared to the Ground Truth time-series. This is shown in the first figure (Figure 1) for the case where there is no padding of a head and tail, which is when the time-series is most susceptible to the introduction of artifact by the temporal filtering. We also show in Figure 2 how there is a bias introduced into the resulting correlation coefficient for a Butterworth type filter. In Figure 3 we show how variance in the correlation coefficient different between filter time-series and Ground Truth varies as the head and tail have no padding (0) to lots of padding (350) as a function of the filter type. In general, the FFT filter is the best.The final figure (Figure 4) shows how the reliability (I2C2) of the HCP connectome improves as the head/tail padding is increased from 0 to 50 time-points and beyond. However, the connectome does not appear to suffer a decrease in reliability when using an FFT filter compared to a Butterworth filter.
DISCUSSION
Many neuroscience projects around the world are relying on an accurate estimation of a connectome from resting-state data. It is important to estimate the most reliable connectome and care must be taken in the processing steps[6], but what is also important is minimizing the introduction of artifact that can decrease the reliability of the connectome estimate. These artifacts can be avoided by collecting sufficiently long resting-state scanning sessions, using the correct bandpass filter, and trimming the head and tail of the post-filtered time-series.CONCLUSION
When estimating the stationary connectome it is important to take into account the introduction of filtering artifact on time-series data. This can be mitigated by choosing a Fast Fourier Transform filter for doing bandpass filtering or by taking the middle of the resulting filtered time-series and discarding the head and tail of the time-series.Acknowledgements
We could like top thank the S.M.A.R.T. (Statistical Methods and Applications for Research in Technology) for the publicly available MATLAB and R code for I2C2 calculations.References
1. Welsh RC, Chen AC, Taylor SF. Low-frequency BOLD fluctuations demonstrate altered thalamocortical connectivity in schizophrenia. Schizophrenia Bulletin. 2010 Jul 1;36(4):713–22.
2. Davey CE, Grayden DB, Egan GF, Johnston LA. Filtering induces correlation in fMRI resting state data. Neuroimage. Elsevier Inc; 2013 Jan 1;64(C):728–40.
3. Shou H, Eloyan A, Lee S, Zipunnikov V, Crainiceanu AN, Nebel MB, et al. Quantifying the reliability of image replication studies: The image intraclass correlation coefficient (I2C2). Cogn Affect Behav Neurosci. 2013 Sep 11;13(4):714–24.
4. Lindquist MA, Geuter S, Wager TD, Caffo BS. Modular preprocessing pipelines can reintroduce artifacts into fMRI data. Hum Brain Mapp. 2019 Jan 25;40(8):2358–76.
5. Afyouni S, Smith SM, Nichols TE. Effective degrees of freedom of the Pearson's correlation coefficient under autocorrelation. Neuroimage. Elsevier Ltd; 2019 Oct 1;199:609–25.
6. Parkes L, Ben Fulcher, Yücel M, Fornito A. An evaluation of the efficacy, reliability, and sensitivity of motion correction strategies for resting-state functional MRI. Neuroimage. Elsevier Ltd; 2018 May 1;171:415–36.
Figures