3970
The Study of Regional Homogeneity and dynamic functional Connectivity of Trigeminal Neuralgia at Resting-state fMRI1LanZhou University Second Hospital, LanZhou, China, 2MR Scientific Marketing, ShangHai, China
Synopsis
Based on rest-state fMRI, we investigated the changes of regional neural activity in trigeminal Neuralgia (TN) patients via analysis of regional homogeneity (ReHo). Furthermore, the alterations of dynamic functional connectivity was explored. Compared with healthy controls , brain regions with significant ReHo value changes in TN patients are mainly concentrated in default mode network (DMN) and Ventral attention Network(VAN). Dynamic analysis suggested four distinct connectivity ‘States’ across the entire group. Our results demonstrated that TN is associated with abnormal neuronal activities in different areas of the brain and dynamic functional connectivity between functional networks.
Introduction
Trigeminal neuralgia (TN) is characterized by paroxysmal, electric, lancinating pains, and a variety of sensory experiences.[1] According to current opinion, TN is caused by a proximal nuerovascular compression at the trigeminal nerve root entry zone in the prepontine cistern leading to secondary demyelination of trigeminal nerve root.[2] But now mounting evidence confirms that central nervous system abnormalities are closely related to chronic pain, although the role of the central systemin the pathophysiology of TN remains unclear.[3] With the development of functional MRI (fMRI), Regional homogeneity (ReHo) and dynamic functional connectivity (dFC) have been applied in several diseases.[4-6] Functional connectivity abnormalities, such as default mode network (DMN), have been reported previously in TN of which chronic pain is a common symptom. It has to be said that the current focus on dFC in TN patients is limited. To further understand the neurophysiological mechanisms of TN, our team used the ReHo and dFC method to identify neural activity changes, as well as the differences in dynamic connectivity in TN.Methods
24 patients with TN and 24 healthy control (HC) subjects with matched age, sex- and education were enrolled in this study. Two cohorts then underwent rest-state functional MRI (rest-fMRI) scanning on a 3T MR scanner (MAGNETOM Verio, Siemens Healthcare, Erlangen, Germany) with a 8-channel head coil, The parameters about rest-fMRI were as bellow: scanned field of view (FOV) =200 mm*200 mm, matrix of the exported image=64*64, repetition time (TR)=2,000ms, echo time (ET)=30ms, with a voxel size = 3.125 mm*3.125 mm*4 mm with a gap of 1.2 mm.We used MRIcro to include and exclude the obtained functional data, and then used statistical parameter mapping (SPM8) and Data Processing Assistant for Resting-State fMRI advanced edition (DPARSFA) software to evaluate it. Besides, we also have a study of dFC based on the GIFT (Group ICA of fMRI Toolbox) by a sliding-window approach.Results
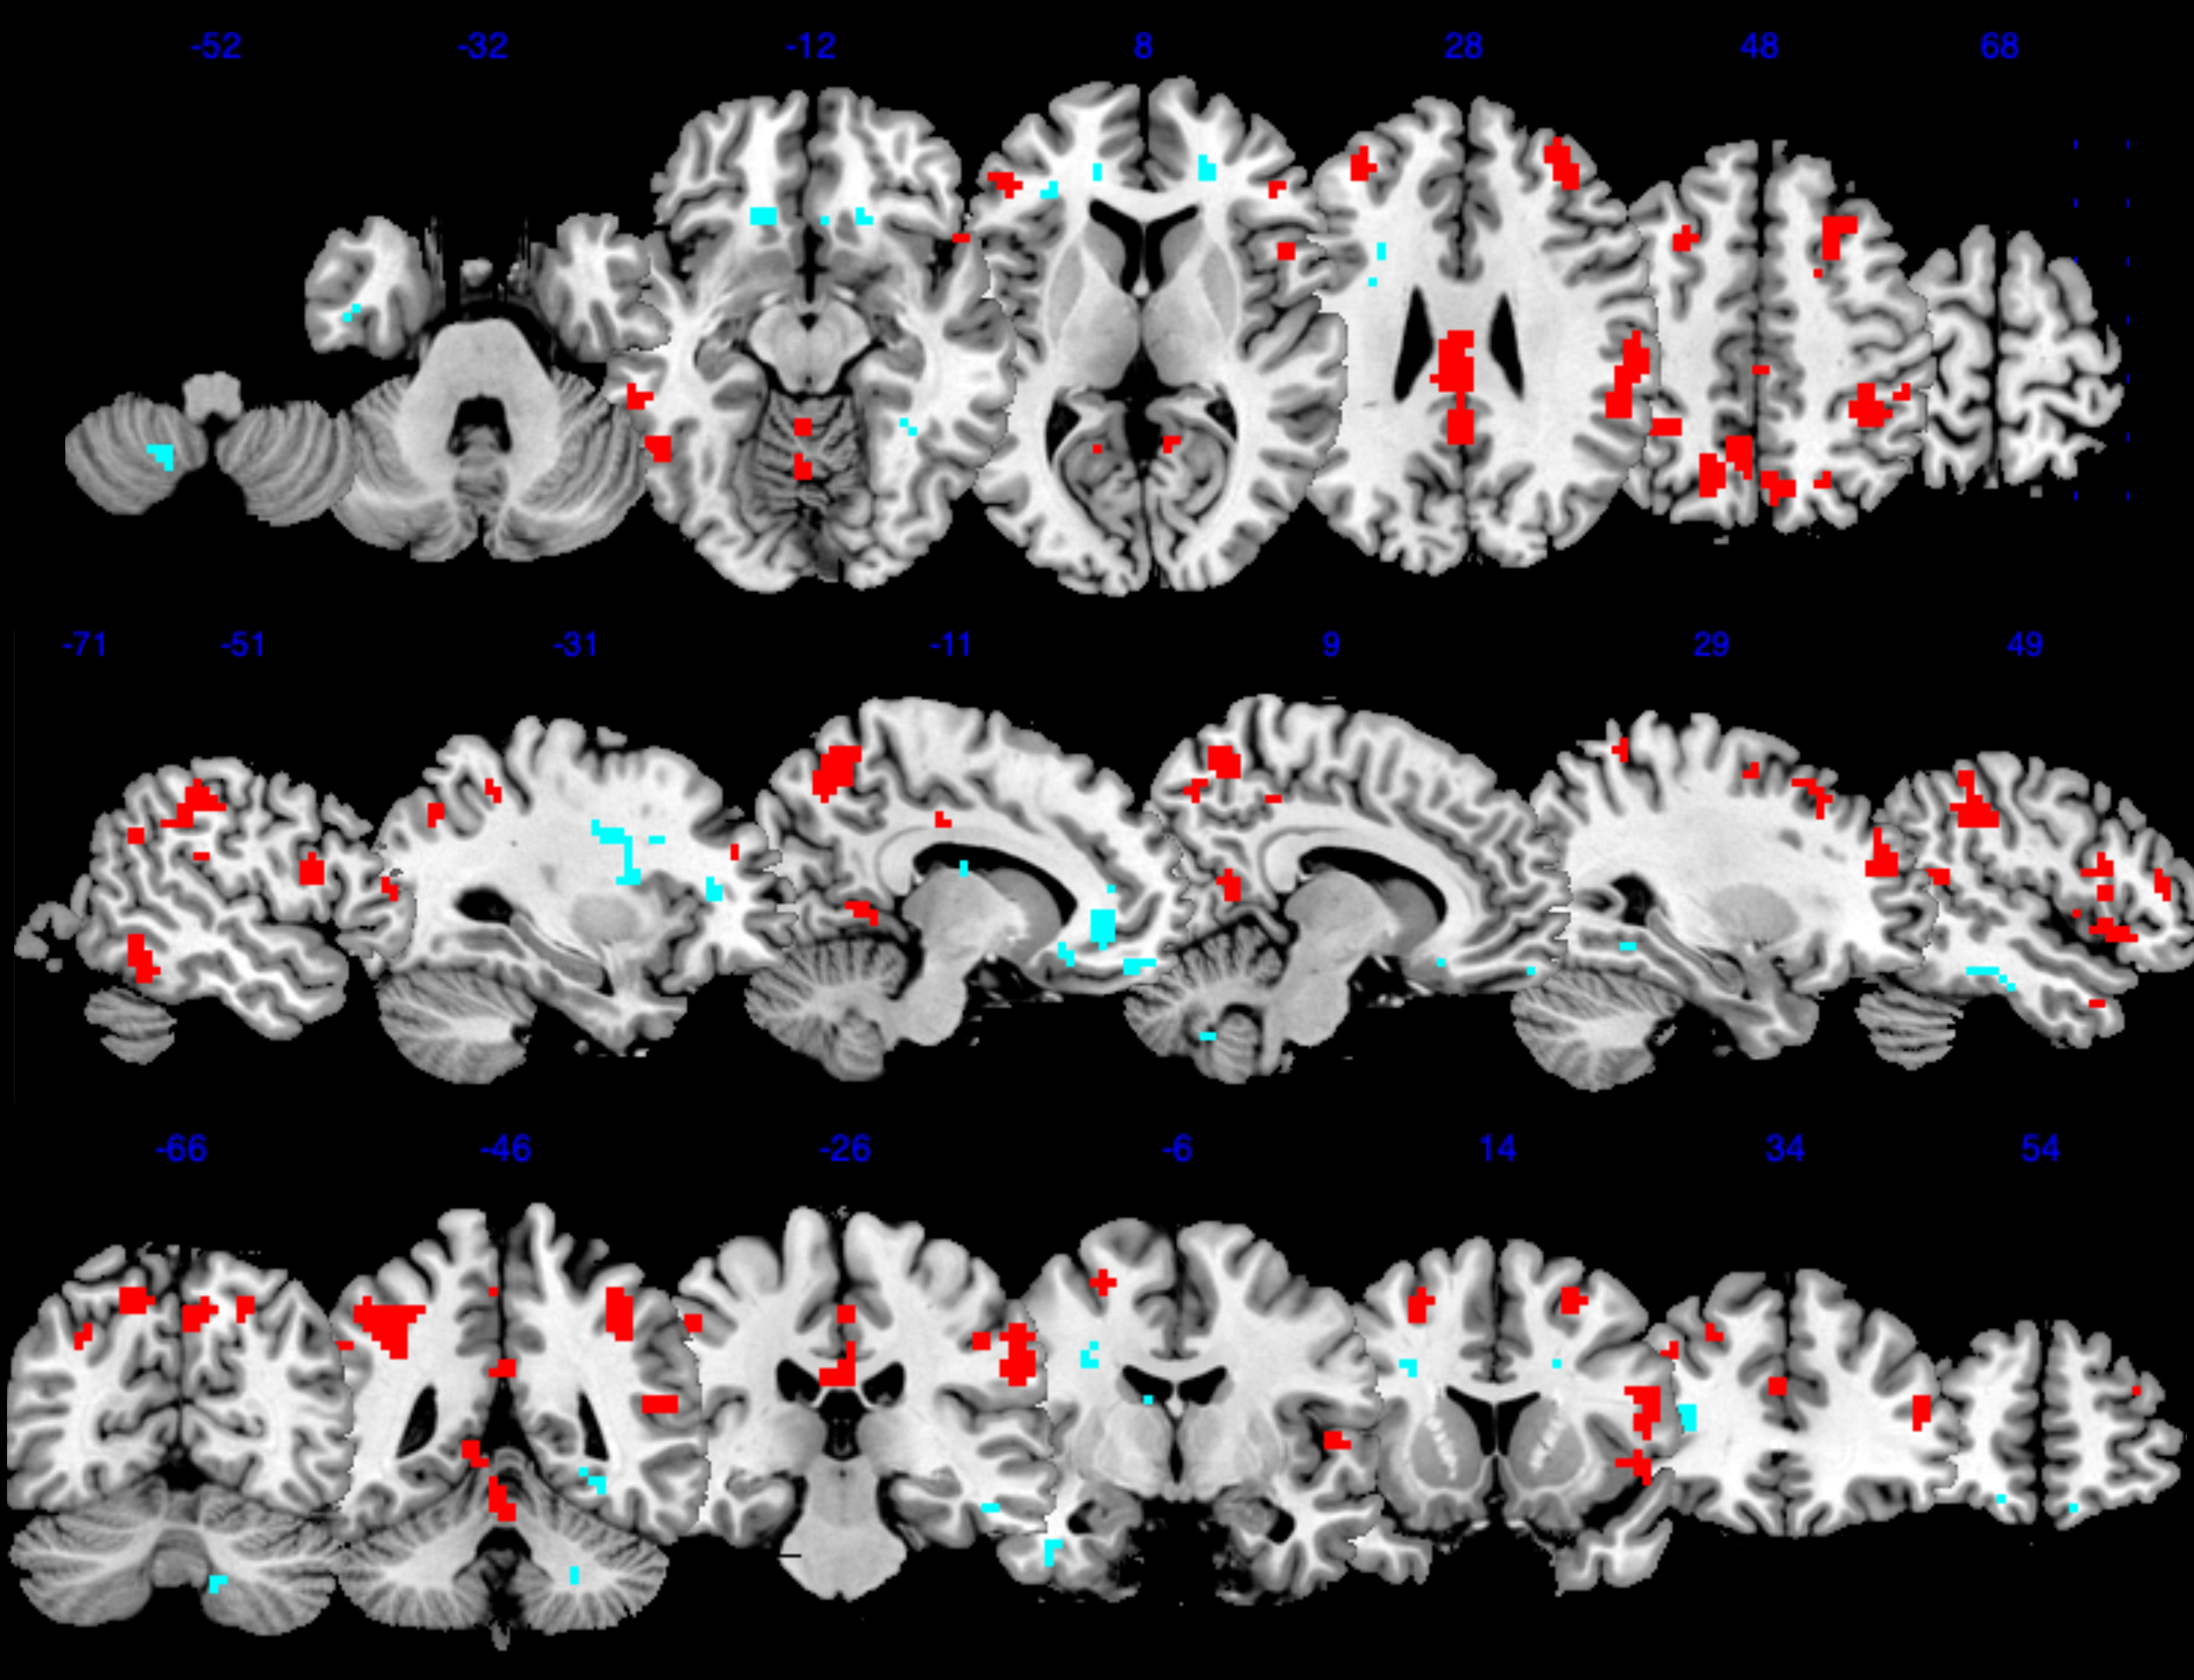
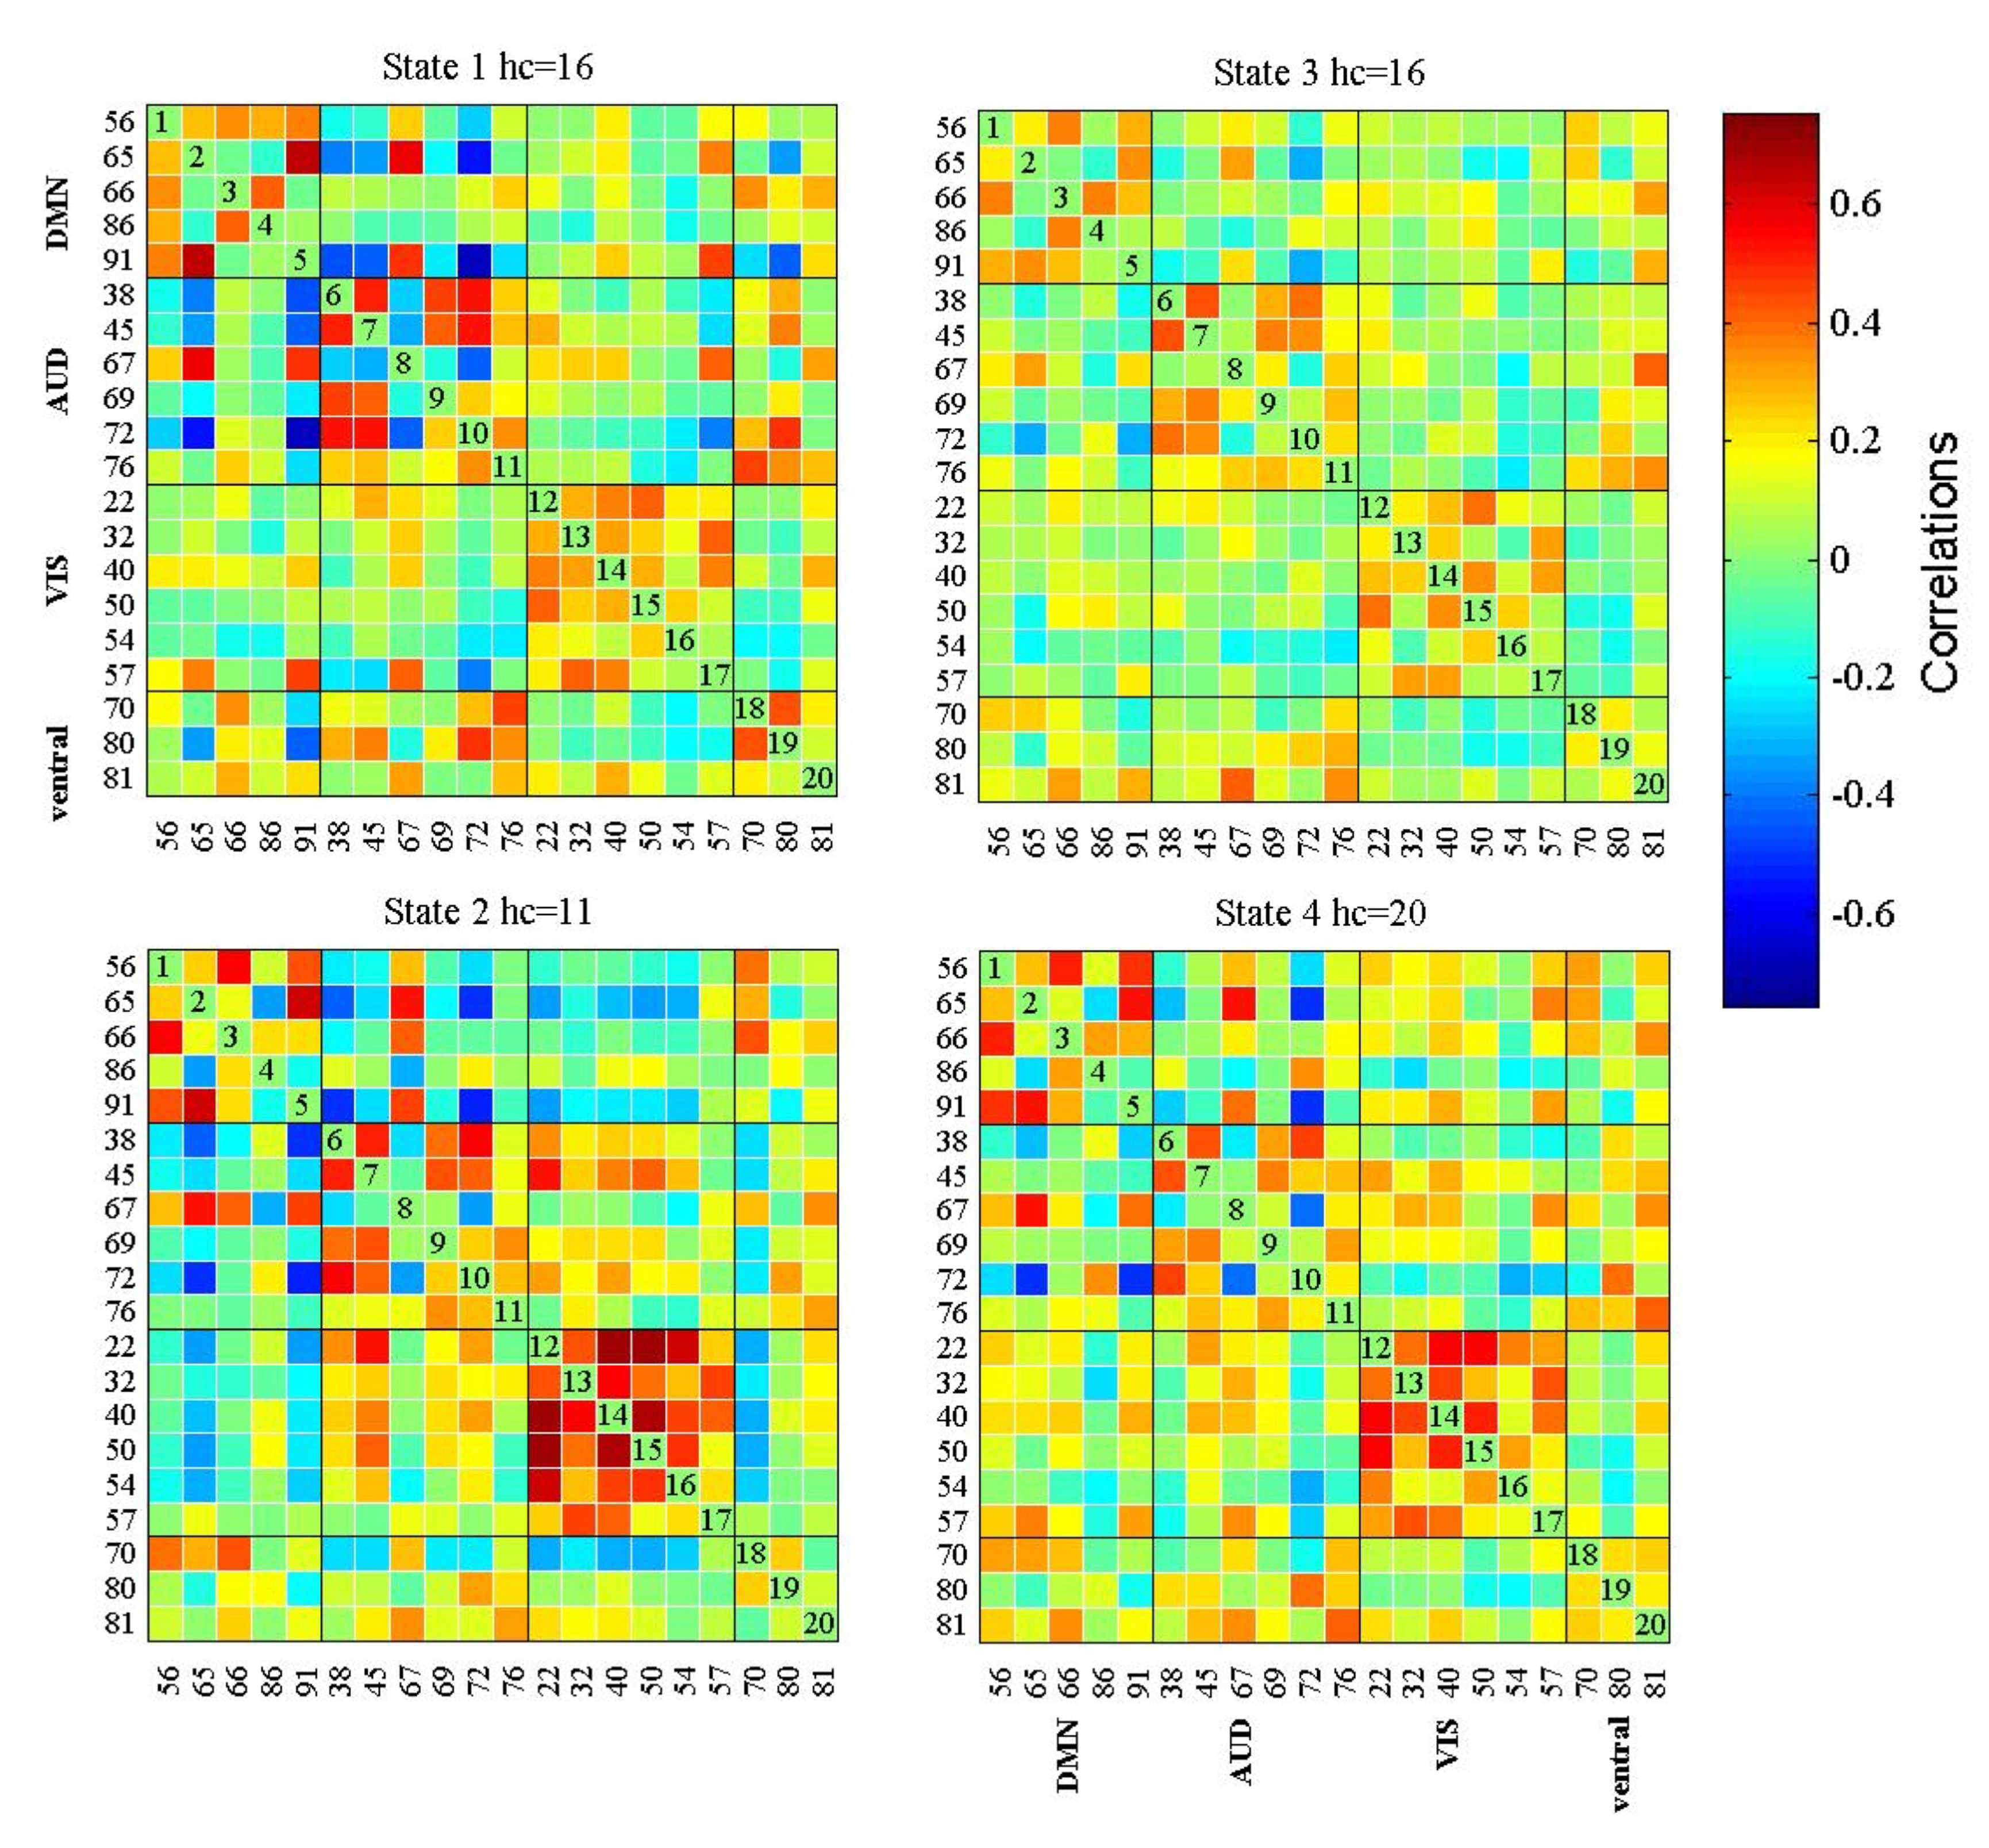
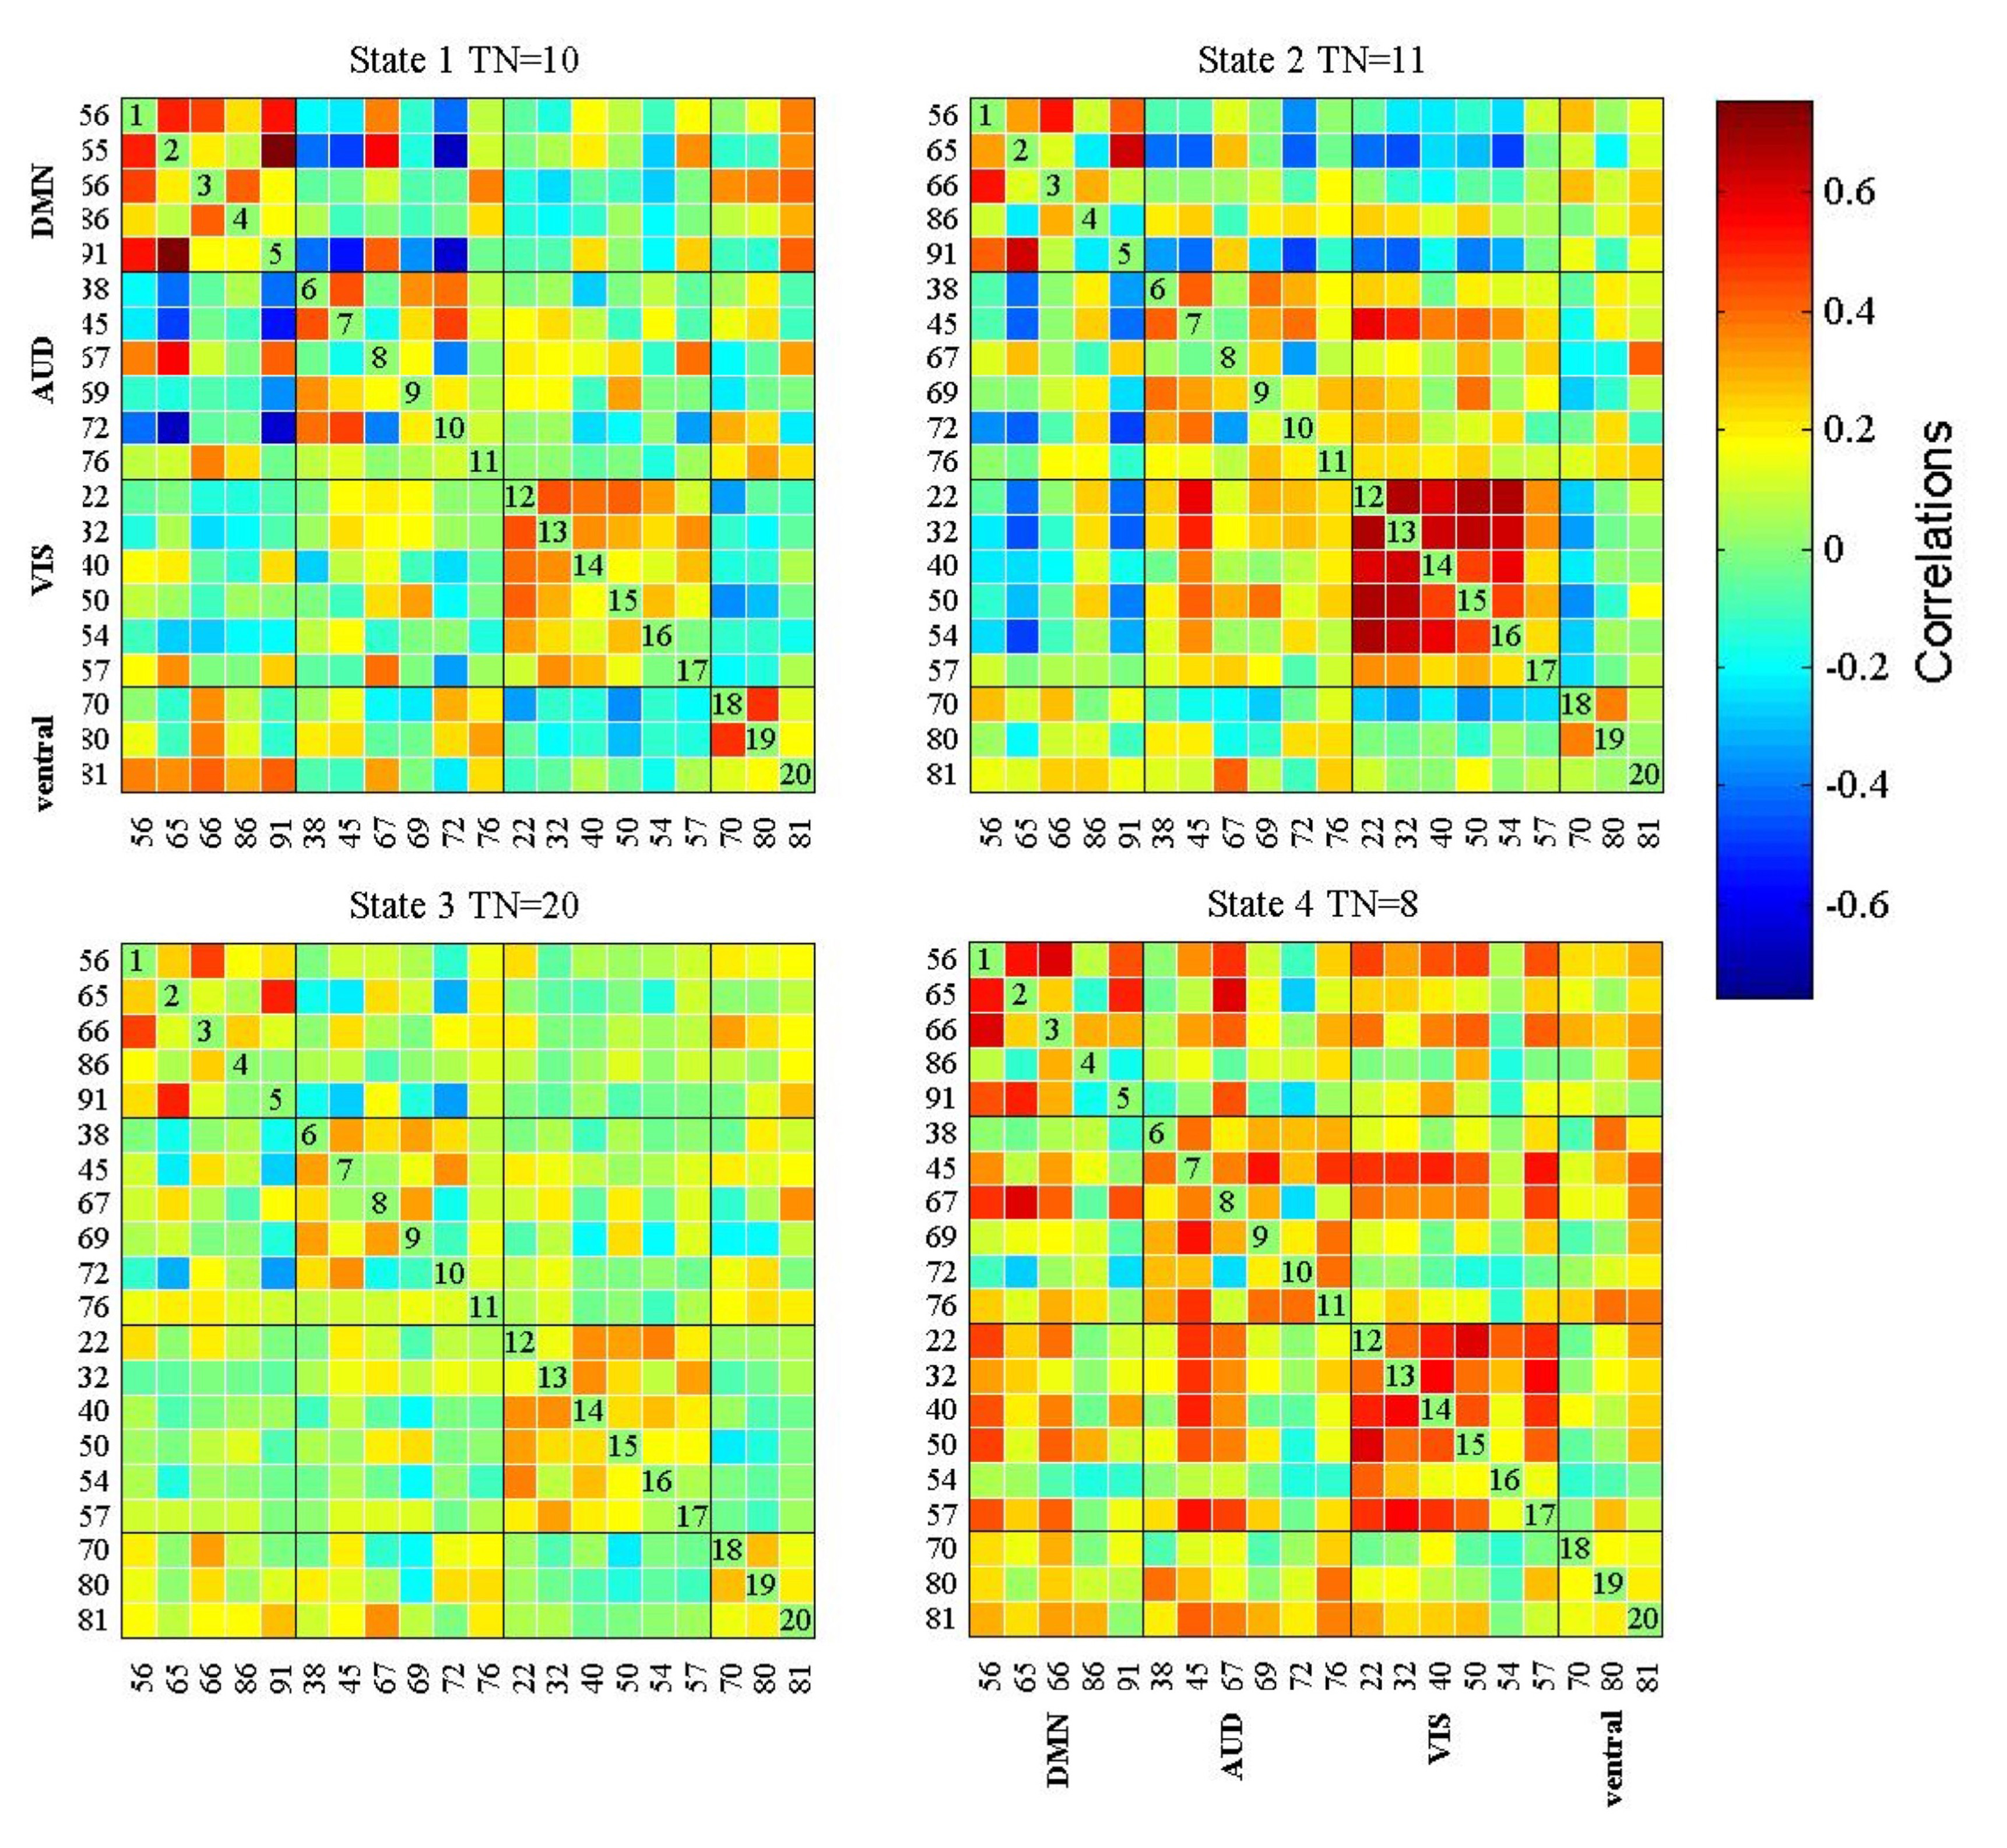
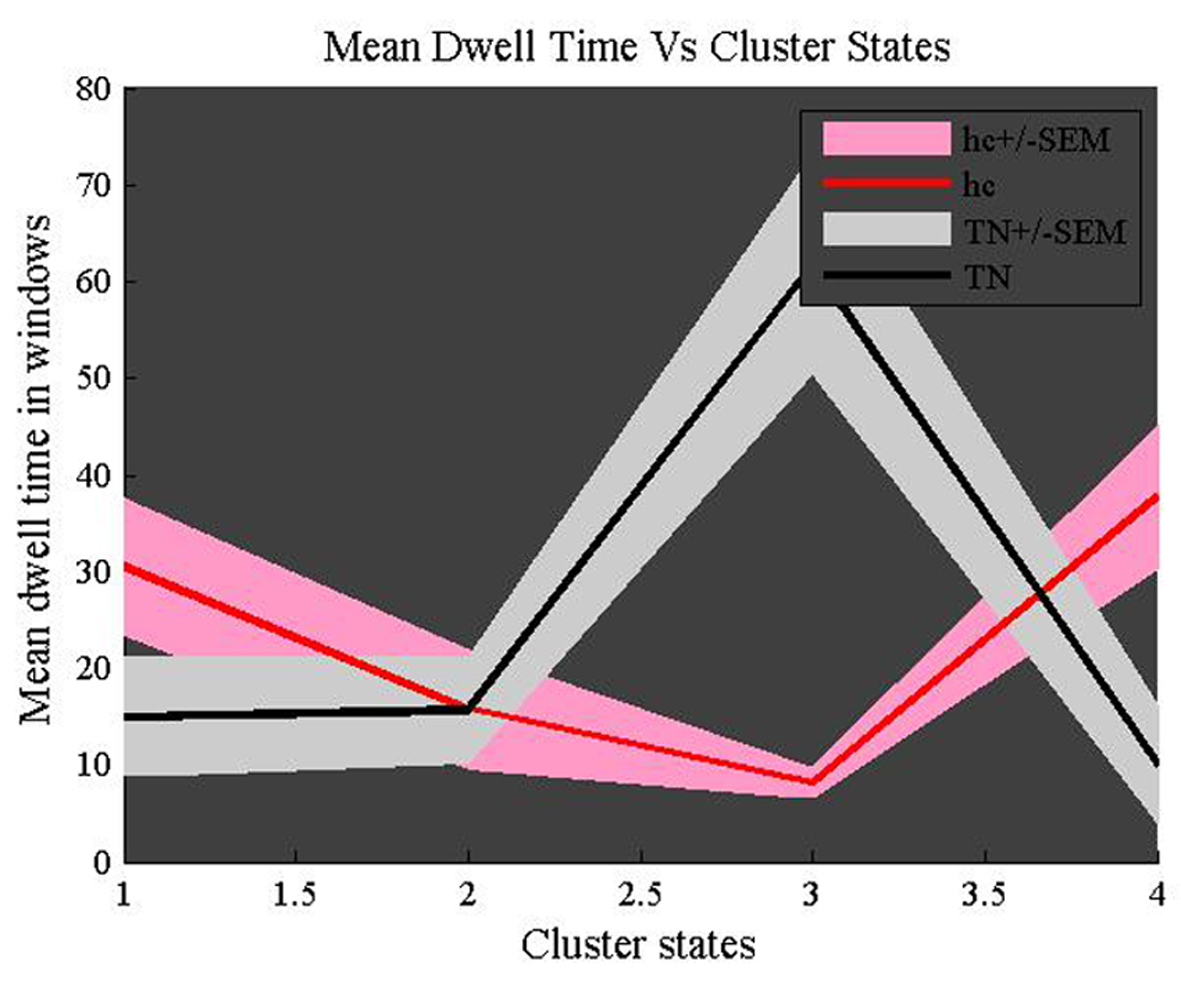
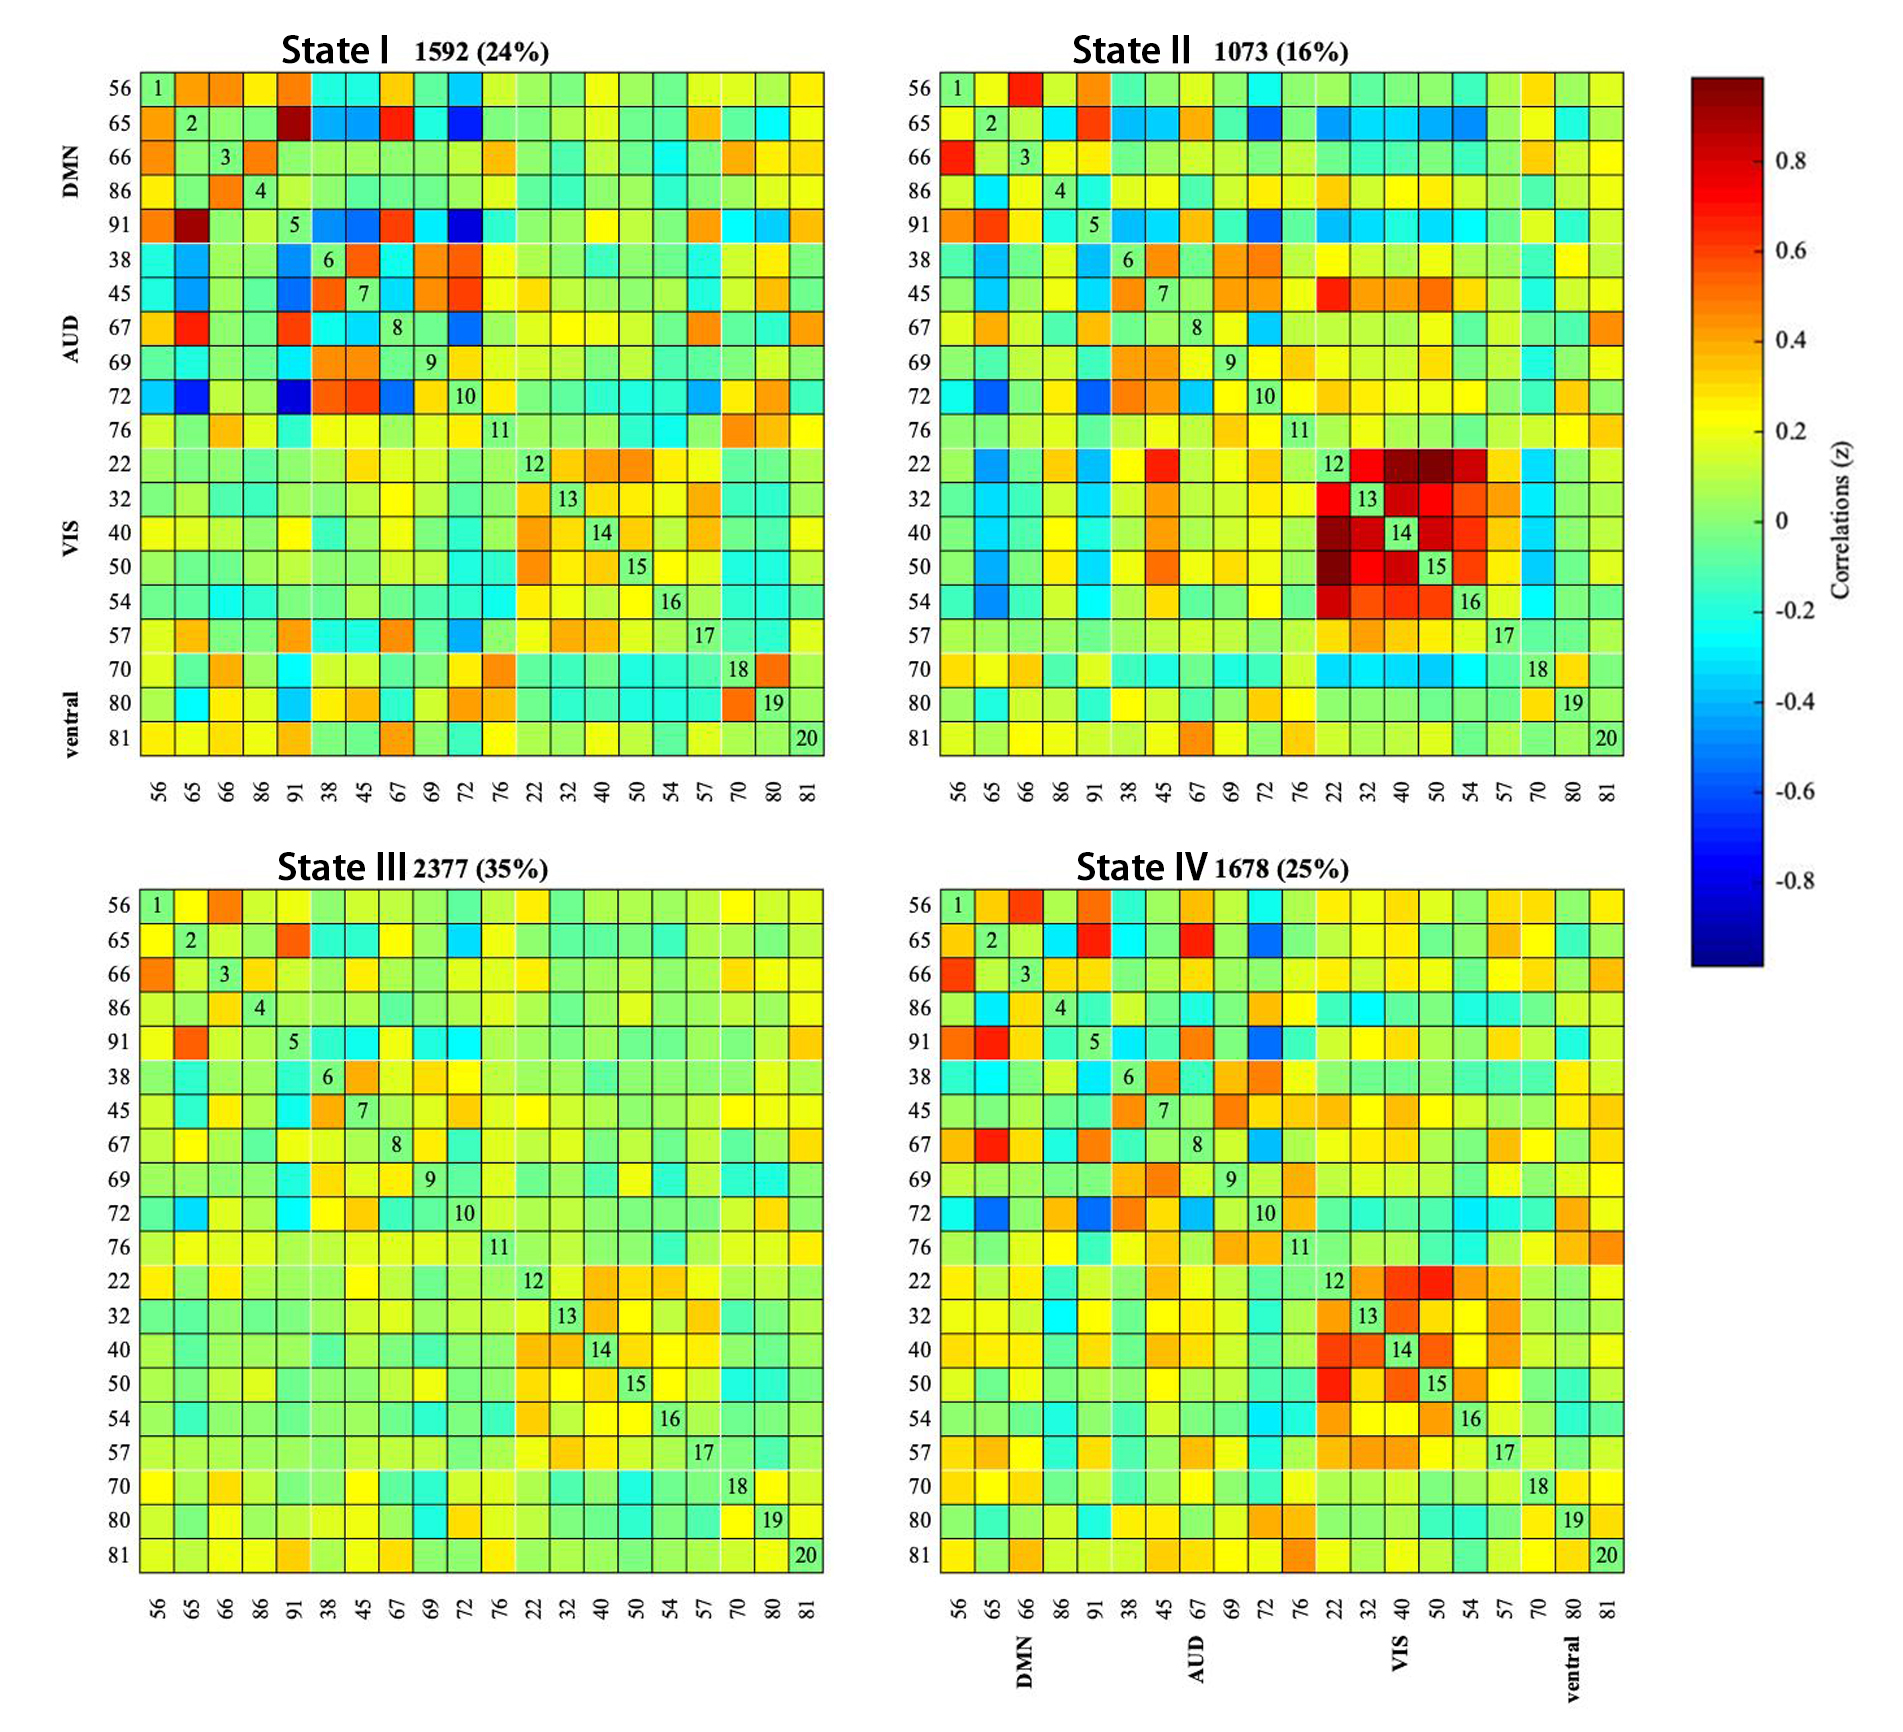
Compared with the control group, patients with TN showed a significant ReHo value increases in the bilateral inferior temporal gyrus, left cerebellum, inferior parietal lobule, middle frontal gyrus, supra marginal, precuneus, but decreases in the anterior cingulate, lateral cingulate gyrus (Voxel level, P<0.05, FWE correction). Furthermore, DMN, auditory network (AUD), visual network (VIS), and ventral attention network (VAN) constitute the functional networks. According to the results of dynamic analysis, we know that there are four distinct connectivity ‘states’ in the whole group. Compared with HC subjests, the proportion of patients with state III increases, while the proportion of state IV decreases. In addition, TN group networks connections (VIS-VAN, AUD-VIS, DMN-VIS) were reduced.Discussion and Conclusion
Our study indicates that TN patients exhibited significantly abnormal spontaneous brain activity in several brain regions that are involved in pain modulation and perceptions. Furthermore, Chronic pain in TN is characterized by altered temporal properties in dynamic connectivity. These findings on dynamic functional connectivity need to be validated in a longer study which is conducive to a deeper understanding of the functional dysfunction of TN.Acknowledgements
No Acknowledgements found.References
[1] Wang Y, Zhang X, Guan Q, Wan L, Yi Y, Liu CF. Altered regional homogeneity of spontaneous brain activity in idiopathic trigeminal neuralgia. Neuropsychiatr Dis Treat. 2015.
[2] Marinkovic S, Todorovic V, Gibo H, et al. The trigeminal vasculature pathology in patients with neuralgia. Headache 2007;47:1334–9.
[3] Xiang CQ, Liu WF, Xu QH, et al. Altered Spontaneous Brain Activity in Patients with Classical Trigeminal Neuralgia Using Regional Homogeneity: A Resting-State Functional MRI Study. Pain Pract. 2019;19(4):397-406.
[4] Huang T, Zhao Z, Yan C, et al. Altered spontaneous activity in patients with persistent somatoform pain disorder revealed by regional homogeneity. PLoS ONE. 2016;11: e0151360.
[5] Wang J, Zhang JR, Zang YF, et al. Consistent decreased activity in the putamen in Parkinson’s disease: a meta-analysis and an independent validation of resting-state fMRI. Gigascience. 2018;7:1–13.
[6] Diez-Cirarda M, Strafella AP, Kim J, Pena J, Ojeda N, Cabrera- Zubizarreta A, et al. Dynamic functional connectivity in Parkinson’s disease patients with mild cognitive impairment and normal cognition. Neuroimage Clin 2018; 17: 847–55.
Figures