3968
Functional Connectivity in Limbic System May Determine the Laterality in Temporal Lobe Epilepsy- A Graph-Theory Approach1Physics and Biomedical Engineering, Tehran University of Medical Sciences, Tehran, Iran (Islamic Republic of), 2Isfahan Neuroscience Research Center, Isfahan University of Medical Sciences, Isfahan, Iran (Islamic Republic of), 3Pars Advanced Medical Research Center, Pars Hospital, Tehran, Iran (Islamic Republic of), 4Research Center for Molecular and Cellular Imaging, Advanced Medical Technologies and Equipment Inst, Tehran University of Medical Sciences, Tehran, Iran (Islamic Republic of)
Synopsis
Temporal lobe epilepsy (TLE) is a disorder of altered brain networks. We evaluated the functional connectivity of the brain limbic system believed to be affected by TLE, based on resting state functional MRI and the graph network analysis. Our results showed that insula, posterior cingulate gyrus, and thalamus may undergo abnormal functional connectivity in terms of local degree in both right and left TLE compared to the healthy subjects. Furthermore, our results suggest that functional connectivity, as evaluated by local degree in insula and thalamus may have a potential application to help determine the laterality in cases of TLE.
INTRODUCTION
Temporal lobe epilepsy (TLE) is the most common form of focal epilepsy with a prevalence of approximately 50%. Surgery may be required as an effective treatment for a majority of those who are resistant to antiepileptic drugs[1]. Video scalp EEG and high-resolution MRI have been used as gold standards for presurgical evaluation protocols, where intracranial EEG is not an option[2]. However, difficulties in distinguishing the epileptogenic side of the brain make surgery challenging or even impossible in about one-third of drug-resistant TLE patients. We aimed to address this issue by evaluating the functional connectivity of the brain because based on the neuroimaging findings, TLE is a disorder of altered brain networks [3-5]. Since the limbic network is one of the major brain networks found to be affected by TLE [6-7], we examined the functional connectivity of the limbic system based on the graph network analysis.METHODS
Subjects Thirty-five individuals with TLE (13 left TLE, 22 right TEL) with an age range of 17-54 years and an average age of 30.4 (16 males, and 19 females) were studied. Seventeen age- and gender- matched healthy subjects were also examined as the control group. Only right-handed subjects participated in this study. Image acquisition All subjects were scanned with a 3-Tesla Siemens Magnetom Prisma MRI. Anatomical images were acquired for clinical diagnosis including transverse T1 weighted images (TR = 1840 ms, TE = 3.47 ms, matrix = 256x256, slice thickness = 1.0 mm). Resting-state functional MRI images covering the whole brain were acquired in the transverse plane using an echo planar imaging sequence (TR = 3000 ms, TE = 30 ms, flip angle = 90, matrix = 640x640; 2.4mm thickness). For each subject, the duration of each fMRI measurements was approximately 10 minutes, and 330 volumes were obtained. Neuroimaging Analysis The analysis included the following steps: pre-processing, extraction of the functional connectivity matrix (FCM) based on the AAL atlas, determination of threshold for binary FCM, construction graph network from FCM and extracting degree features, and ultimately statistical analysis. Pre-processing was performed using DPABI toolbox[8]. Then, the Pearson correlation was used to calculate functional connectivity between extracted time courses for the whole brain regions based on AAL atlas. We used the density thresholding method[9] to construct a binary connectivity matrix. According to graph theory[10], the brain can be modeled by a series of nodes and edges. The nodes are the segmented brain regions, and the edges are the functional connections between the brain regions. The binary graph was constructed based on the functional connectivity matrix. The ‘local degree’ feature for a node was defined as the sum of edges with in the same local network (not the whole brain) connected to the node. The local degree value was calculated as a function of network density (0-50%) for all regions within the limbic system consisting of inferior frontal gyrus orbital part (ORBinf), insula (INS), anterior and posterior cingulate gyrus (ACG and PCG), hippocampus (HIP), parahippocampus (PHIP), amygdala (Amy), fusiform gyrus (FFG), caudate (CAU), thalamus (THA), and superior temporal gyrus (STG). The analysis of the graph network was performed using BRAPH toolbox[11]. Finally, we used a nonparametric permutation test method for statistical analysis[12].RESULTS
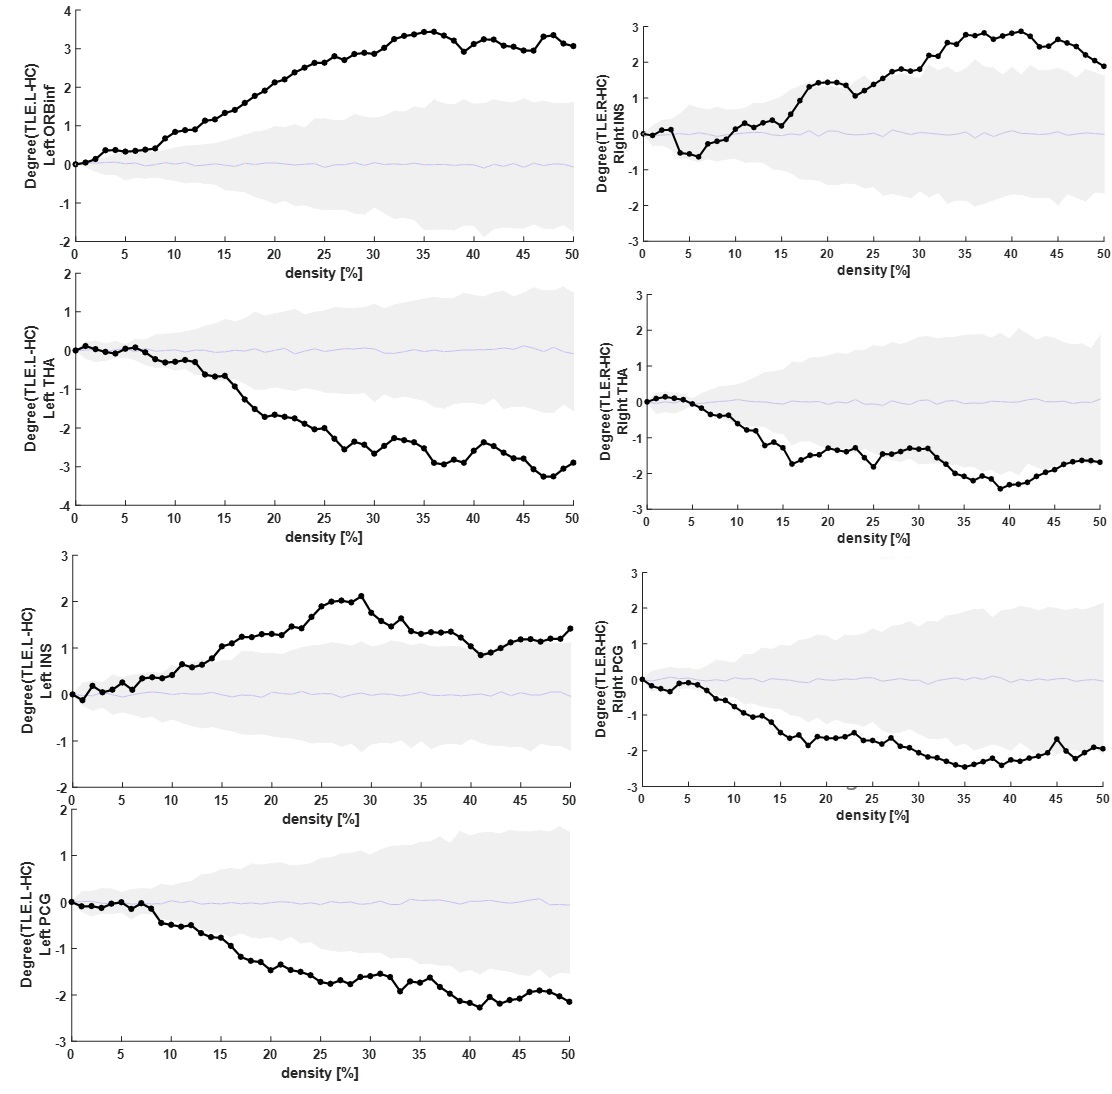
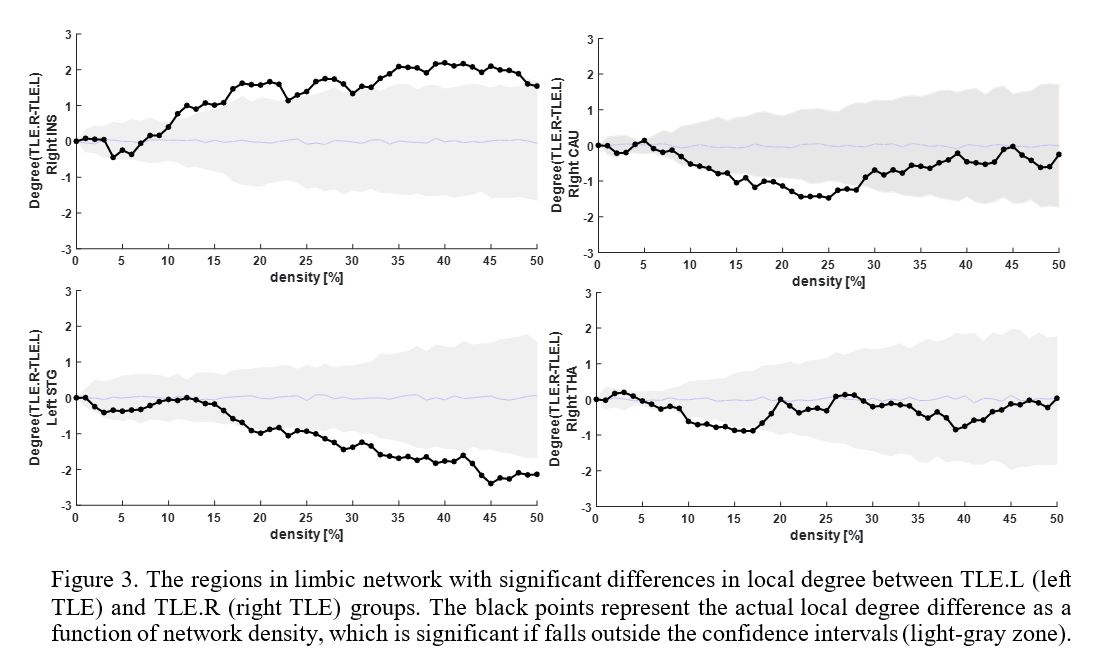
Figures 1 shows the differences in local degree values as a function of network density between TLE.R (right TLE) and TLE.L (left TLE) versus the healthy control (HC) groups in the right and left hemisphere of the limbic network, respectively. As compared to HC, the TLE.R subjects had significantly lower local degree values in the right THA and right PCG. In contrast, the local degree was significantly greater in the right ORBinf. On the other hand, the TLE.L subjects showed a significantly lower local degree in the left THA and left PCG compared to the HC group. In contrast, in the left ORBinf and left INS, the local degree was significantly greater in TLE.L than in the HC group. Comparing the local degree values as a function of network density between the TLE.L and TLE.R in the regions of the limbic system, the local degree was significantly lower in the right CAU, right THA and left STG regions, but significantly greater in the right INS (Figure 2).DISCUSSION
We determined the regions in the limbic system with abnormal functional connectivity in TLE subjects in concordance with the epileptogenic side. Our results showed that INS, PCG, and THA in the limbic system may undergo abnormal functional connectivity in terms of the local degree in both TLE.R and TLE.L compared to the control group. More importantly, the local degree of INS and THA was different between TLE.R and TLE.L groups: A greater local degree was observed in the INS region for TLE.R and in THA region for TLE.L.CONCLUSION
Our results suggest that functional connectivity, as evaluated by the local degree in insula and thalamus may have a potential application to help determine the laterality in cases of TLE. A further study with larger sample size is required to confirm the findings in this study.Acknowledgements
The authors must acknowledge the contribution of the Iranian National Brain Mapping Lab (NBNL) and their staffs for MRI data acquisition in this project.References
1. Téllez-Zenteno JF, Hernández-Ronquillo L. A review of the epidemiology of temporal lobe epilepsy. Epilepsy Res Treat. 2012;2012.
2. Duncan JS. Imaging and epilepsy. Brain a J Neurol. 1997;120(2):339-377.
3. Ma C, Ding J, Li J, et al. Resting-State Functional Connectivity Bias of Middle Temporal Gyrus and Caudate with Altered Gray Matter Volume in Major Depression. PLoS One. 2012;7(9). doi:10.1371/journal.pone.0045263.
4. Chiang S, Haneef Z. Graph theory findings in the pathophysiology of temporal lobe epilepsy. Clin Neurophysiol. 2014;125(7):1295-1305.
5. Zheng H, Xu L, Xie F, et al. The Altered Triple Networks Interaction in Depression under Resting State Based on Graph Theory. 2015;2015:9-12.
6. Jefferys JGR, Jiruska P, de Curtis M, Avoli M. Limbic network synchronization and temporal lobe epilepsy. In: Jasper’s Basic Mechanisms of the Epilepsies [Internet]. 4th Edition. National Center for Biotechnology Information (US); 2012.
7. D’Antuono M, Benini R, Biagini G, et al. Limbic network interactions leading to hyperexcitability in a model of temporal lobe epilepsy. J Neurophysiol. 2002;87(1):634-639.
8. Yan C-G, Wang X-D, Zuo X-N, Zang Y-F. DPABI: data processing & analysis for (resting-state) brain imaging. Neuroinformatics. 2016;14(3):339-351.
9. van den Heuvel MP, de Lange SC, Zalesky A, Seguin C, Yeo BTT, Schmidt R. Proportional thresholding in resting-state fMRI functional connectivity networks and consequences for patient-control connectome studies: Issues and recommendations. Neuroimage. 2017;152:437-449.
10. Bullmore E, Sporns O. Complex brain networks: graph theoretical analysis of structural and functional systems. Nat Rev Neurosci. 2009;10(3):186.
11. Mijalkov M, Kakaei E, Pereira JB, Westman E, Volpe G, Initiative ADN. BRAPH: A graph theory software for the analysis of brain connectivity. PLoS One. 2017;12(8):e0178798.
12. Nichols TE, Holmes AP. Nonparametric permutation tests for functional neuroimaging: a primer with examples. Hum Brain Mapp. 2002;15(1):1-25.
Figures