3966
Investigating the human brain information flow pattern based on resting-state functional magnetic resonance imaging1Department of Radiology, Beijing Tiantan Hospital, Beijing, China, 2School of Biomedical Engineering, Capital Medical University, Beijing, China, 3Clinical Science, Philips Healthcare, Guangzhou, China
Synopsis
Different
information flow patterns were found within low and high signal frequency bands
based on resting-state fMRI.
Introduction
The information flow of human brain reflects the neuron intrinsic relationship. Resting-state functional magnetic resonance imaging (rsfMRI), as a noninvasive imaging technique, could be used to map the human brain local activities and information flow pattern1,2. The exploration of human information flow contributes to the further understanding of the mechanism of neuron activities and interactions and is of great significance for human cognition, behavior and the neuropsychiatric disorders. To date, various computing and analyzing methods were proposed for the brain information flow analysis based on rsfMRI. These methods included model-based (e.g. dynamic causal model) and data-driven (e.g. Granger causality analysis (GCA)) ones which mainly focused on constructions of information communication-related functional and effective connectivity. In the last years, a few novel methods were proposed for the nonlinear interaction analysis including transfer entropy (TE) and convergent cross mapping (CCM), but they were rarely applied to the rsfMRI.Methods
In this work, we proposed a novel strategy to compute and analyze human brain information flow pattern based on rsfMRI by using data-driven methods (including Pearson’s correlation, mutual information, convergent cross mapping, linear Granger causality analysis, nonlinear kernel-based Granger causality analysis, non-parametric multiplicative regression Granger causality analysis and transfer entropy based on binning, K-nearest neighbor and permutation)3,4. Firstly, a novel efficient transfer entropy computing algorithm based on the permutation of the low-dimension embeding vectors were proposed. Then, new preferred information flow directions based on Granger causality analysis and convergent cross mapping were defined to represent the relative information flow. Besides, we generalized the application of transfer entropy and convergent cross mapping to the high spatio-temporal rsfMRI. Based on the above proposed methods, the information flow within different signal frequency bands and with different analyzing methods were explored based on high-temporal rsfMRI from Human Connectome Project (HCP)5,6.Results
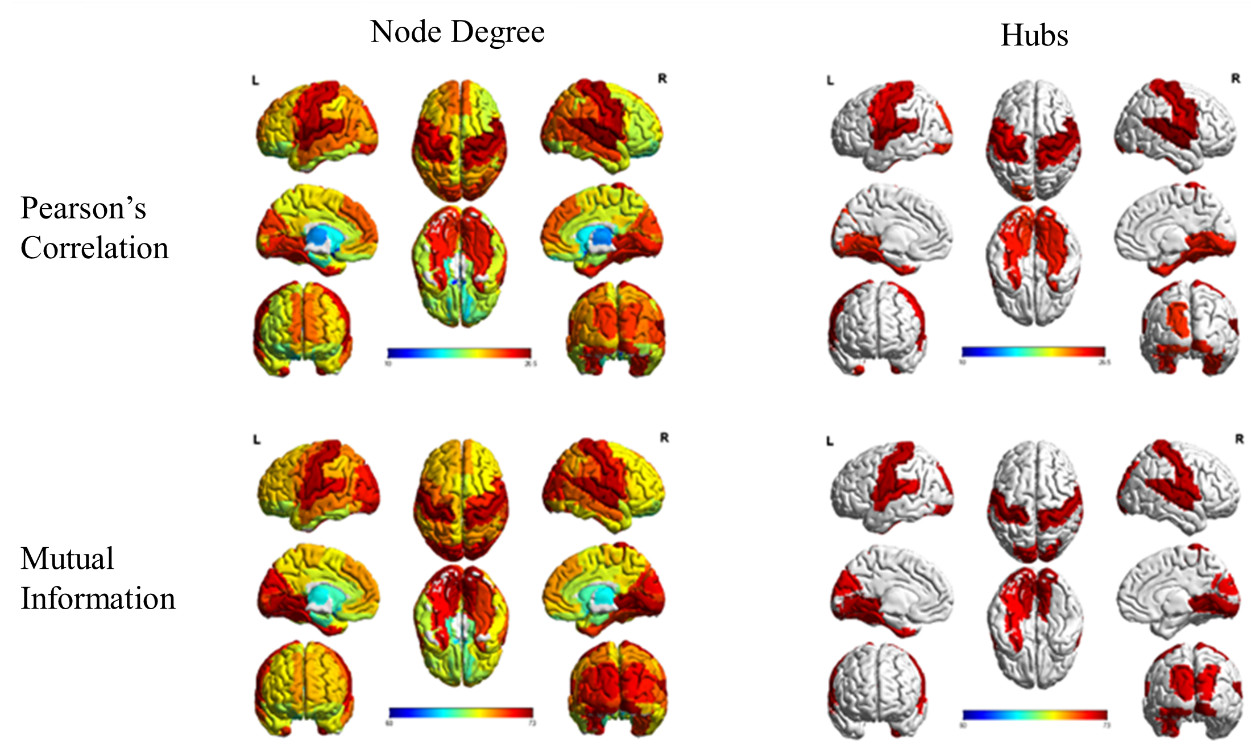
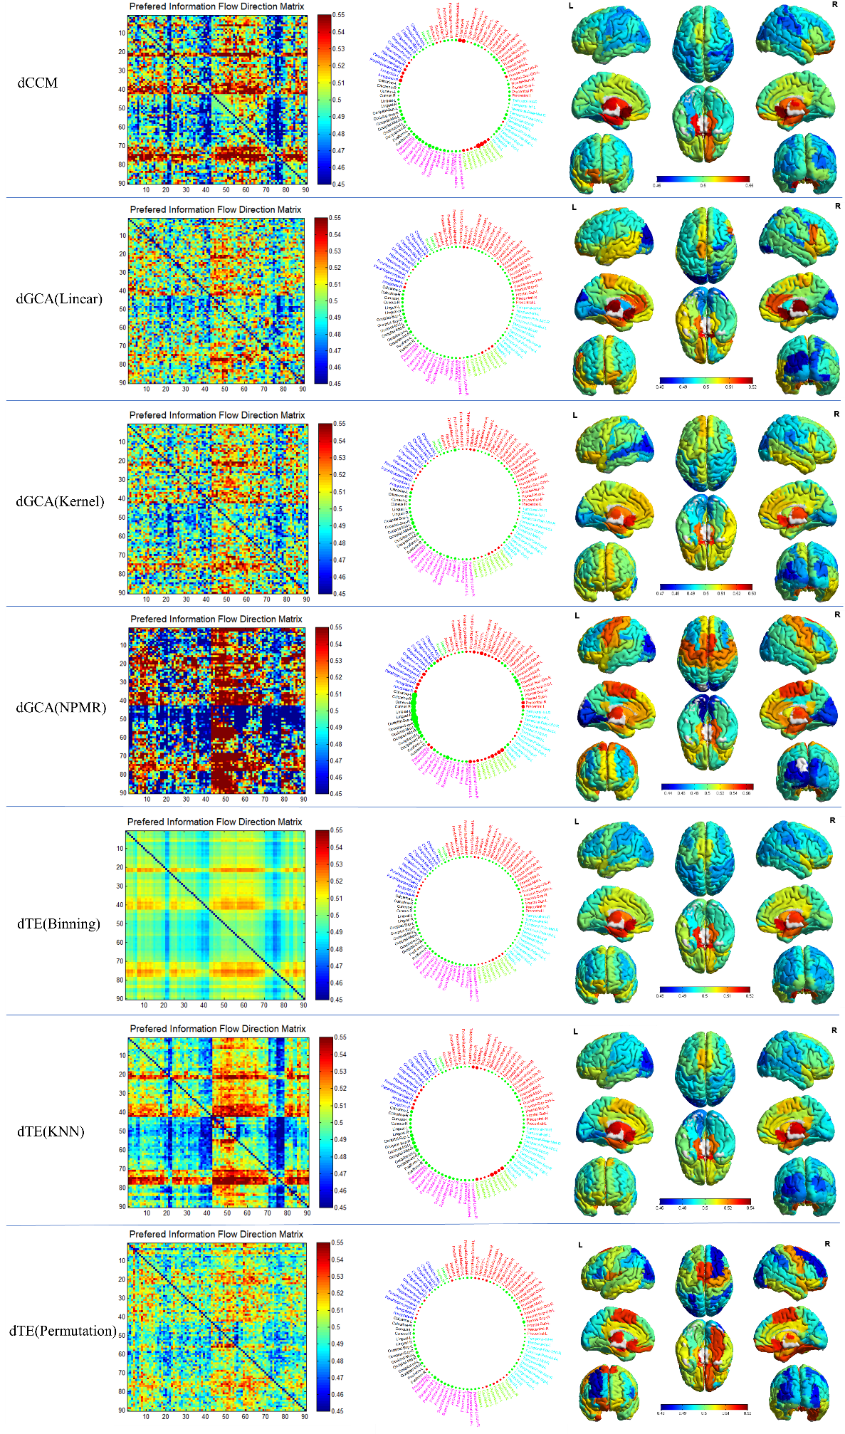
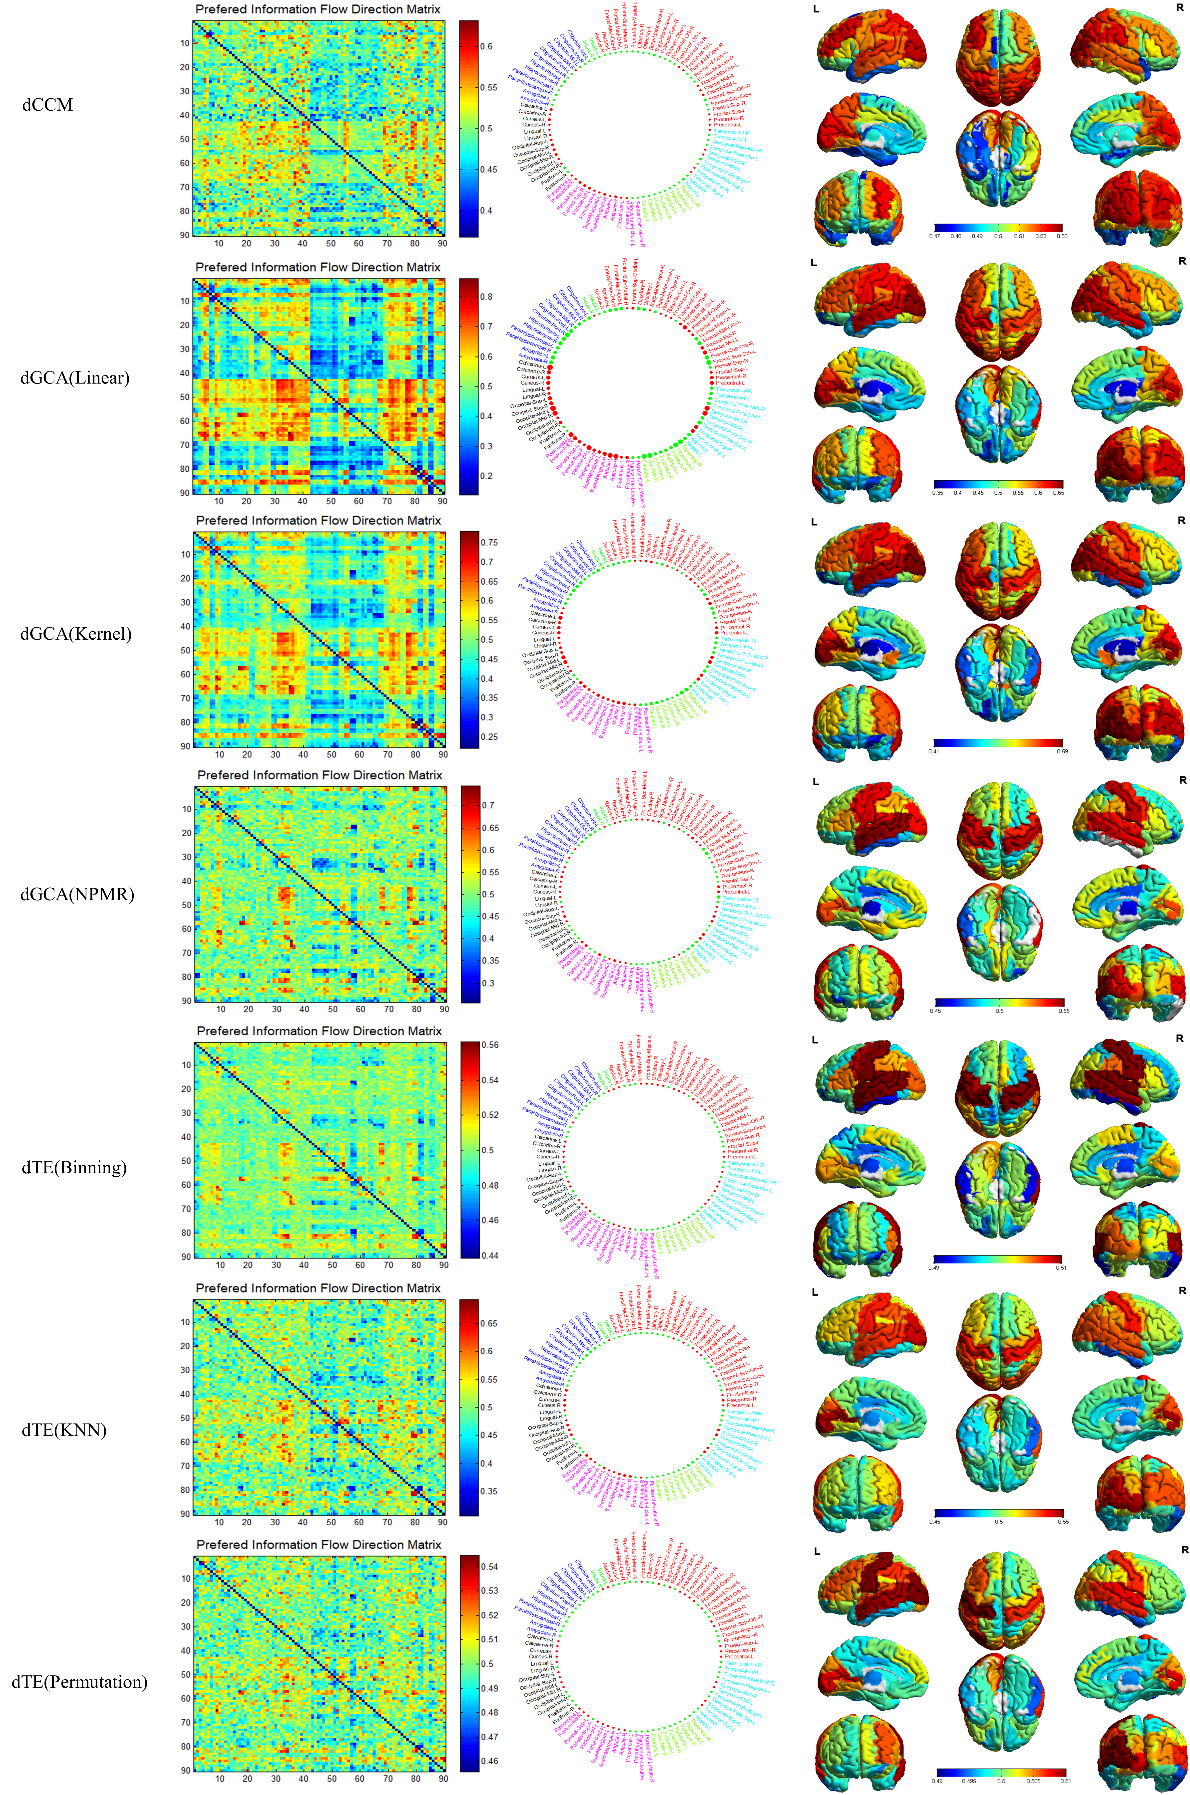
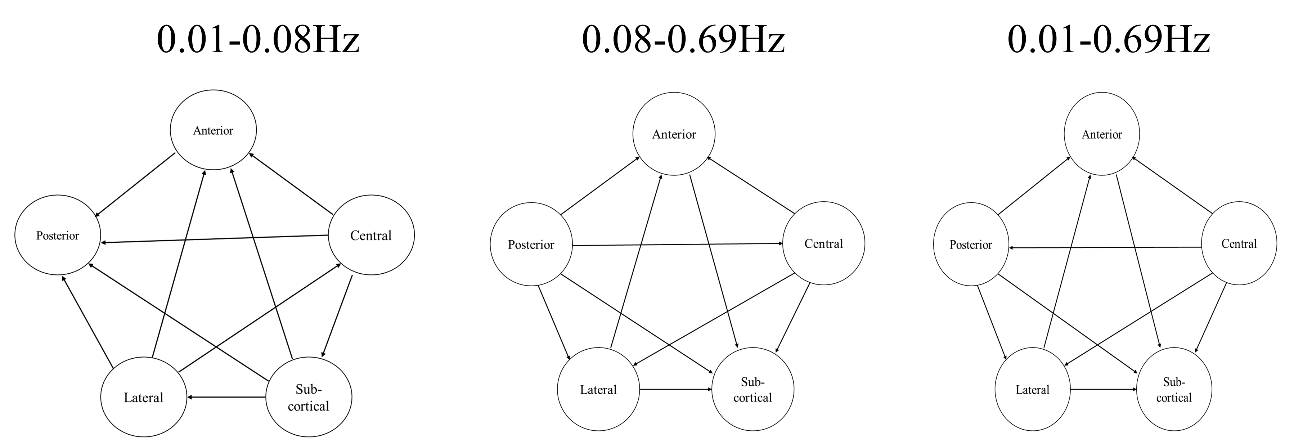
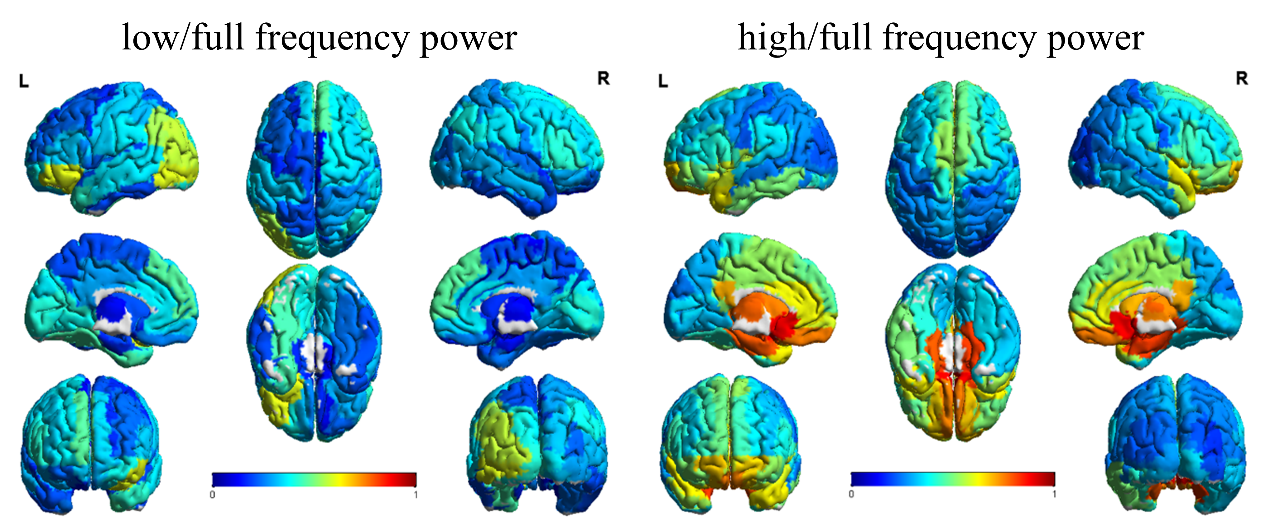
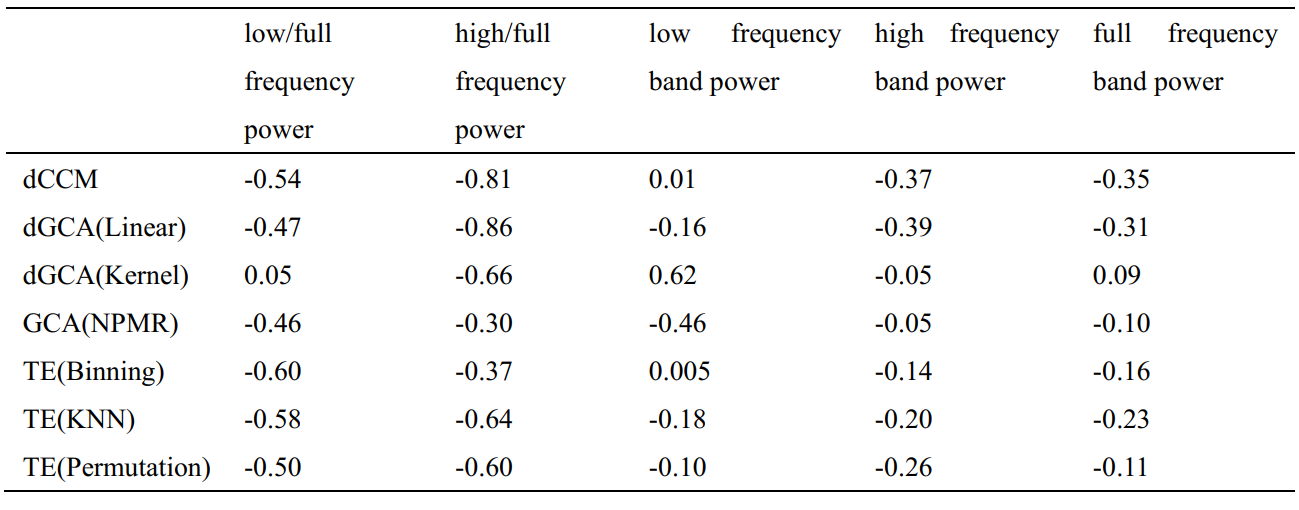
The results showed that in the low frequency band (0.01-0.08Hz), the distribution of brain information communication hubs were similar by using Pearson’s correlation and mutual information. The effective connectivity and preferred information flow direction networks constructed by convergent cross mapping, linear Granger causality analysis, kernel-based Granger causality analysis, non-parametric multiplicative regression Granger causality analysis and transfer entropy based on binning, K-nearest neighbor and permutation have similar topologies which results in similar information flow patterns. However, the information flow patterns derived from high frequency band (0.08-0.69Hz) and whole frequency band (0.01-0.69Hz) were changed especially for the preferred information flow directions showing opposite information flows to those derived from low frequency band (0.01-0.08Hz). Within the low frequency band, the information from sub-cortical nucleus, limbic lobe and a few brain regions of frontal and temporal lobe flows into occipital, parietal lobe and other brain regions of frontal and temporal lobe. But within the high and whole frequency bands, the information flow directions were adverse. Besides, significant negative correlations were found between the preferred information flow direction index and the relative power of low and high frequency bands respectively.Conclusion
The proposed computing and analyzing strategy has the ability to present the human brain information flow pattern. Furtherly, these proposed methods could be applied to investigate the underlying mechanism of human normal brain and neuropsychiatric disorders. More importantly, these altered information flow patterns might provide a reliable and objective imaging biomarkers and evidences for clinical disease diagnosis, prediction and evaluation.Acknowledgements
References
1. van Straaten ECW, Stam CJ. Structure out of chaos: Functional brain network analysis with EEG, MEG, and functional MRI. Eur Neuropsychopharm. 2013; 23:17-18.
2. Ta HX, Yoon CN, Holm L, et al. Inferring the physical connectivity of complex networks from their functional dynamics. Bmc Syst Biol. 2010; 4:70.
3. Stam CJ. Nonlinear dynamical analysis of EEG and MEG: review of an emerging field. Clin Neurophysiol. 2005; 116:2266-2301.
4. Avena-Koenigsberger A, Misic B, Sporns O. Communication dynamics in complex brain networks. Nat Rev Neurosci. 2018; 19:17-33.
5. Marcus DS, Harwell J, Olsen T, et al. Informatics and data mining tools and strategies for the human connectome project. Front Neuroinform. 2011; 5:4.
6. Barch DM. Resting-State Functional Connectivity in the Human Connectome Project: Current Status and Relevance to Understanding Psychopathology. Harvard Rev Psychiat. 2017; 25:209-217.
Figures