3965
Surface Based Connectivity Integration – A Processing Pipeline for High Resolution Integration of Structural and Functional Connectivity1Physics and Astronomy, University of Rochester, Webster, NY, United States, 2Biostatistics and Computational Biology, University of Rochester, Rochester, NY, United States, 3Computer Science, University of Sherbrooke, Sherbrooke, QC, Canada, 4Imaging Sciences, University of Rochester, Rochester, NY, United States, 5Neurology, University of Rochester, Rochester, NY, United States
Synopsis
The integration of structural and functional connectivity thus far has been limited to atlas-based parcellation studies. We present a novel atlas-free processing pipeline to explore the integration of structural and functional connectivity at high spatial resolution. This pipeline has been reliably replicated in other research subjects. We also introduce a dual-modality imaging feature that can be mapped to the gray-white matter surfaces. Early results demonstrate that structural and functional connectivity are likely strongly linked. This pipeline allows for the first time to perform connectivity analyses on individual white surfaces, opening up many more possibilities to future connectivity studies.
Introduction
The integration of structural (SC) and functional connectivity (FC) remains a necessary and challenging frontier for neuroscience research due to signal and image processing limitations. Diffusion (dMRI) and resting-state functional MRI (rs-fMRI) provide the signals in white (WM) and gray matter (GM) for SC and FC. Here we introduce a novel post-processing pipeline, Surface-Based Connectivity Integration (SBCI), to explore the integration of SC and FC on the GM-WM surface at high spatial resolution.Methods
Four healthy adults were selected from an ongoing study at the University of Rochester to develop a pipeline to analyze the integration of SC and FC at higher resolutions than ever before. Results from other subjects are similar to those presented. All imaging was conducted on a 3T (Siemens Prisma) scanner equipped with a 64-channel head coil (Erlangen, Germany). The protocol includes high-resolution T1-weighted (T1w) anatomical images using the MPRAGE sequence (TI=950ms, TE/TR=3.87ms/1,620ms, 1mm isotropic resolution). Diffusion imaging was performed using a 64 direction spin echo echo planar imaging (SE-EPI) sequence at two gradient strengths, b=1,000 and 2,000 (TE/TR=69.0ms/4300ms, Echo spacing=0.66ms, EPI factor=172, 1.5mm isotropic resolution). Functional imaging was acquired with a gradient echo EPI (GE-EPI) sequence (TE/TR=43.0ms/993ms, echo spacing=0.56ms, flip angle=70 degrees, EPI factor=128, 2mm isotropic resolution, 300 volumes).Image processing included diffusion preprocessing with TOPUP and EDDY in FMRIB’s Software Library (FSL)1, registration of the T1w and functional images to native diffusion space using ANTs2 and boundary-based registration3 respectively, and surface-based functional preprocessing (slice-timing and motion correction, smoothing, surface projection, and nuisance regression) using the FSFAST pipeline in Freesurfer4. Tractography was performed using the surface-enhanced tractography (SET)5 algorithm available through the Sherbrooke connectivity imaging laboratory scripts (Scilpy). SC matrices were calculated as streamline counts between vertices. FC was calculated via vertex-wise correlations with and without global signal regression (GSR). SC-FC similarity was calculated at each vertex by correlation of the SC and FC of every other vertex on the surface.
Connectivity integration analyses at three high resolutions included comparing SC and FC matrices and the FC across the brain with and without direct WM connections (FC given SC) and visualizing the SC-FC integrity on the GM-WM surface. SC and FC matrices were down-sampled to atlas resolution and visually inspected for consistency. FC given SC comparisons included with and without GSR, masking nearest neighbors, and within and across lobes.
Results
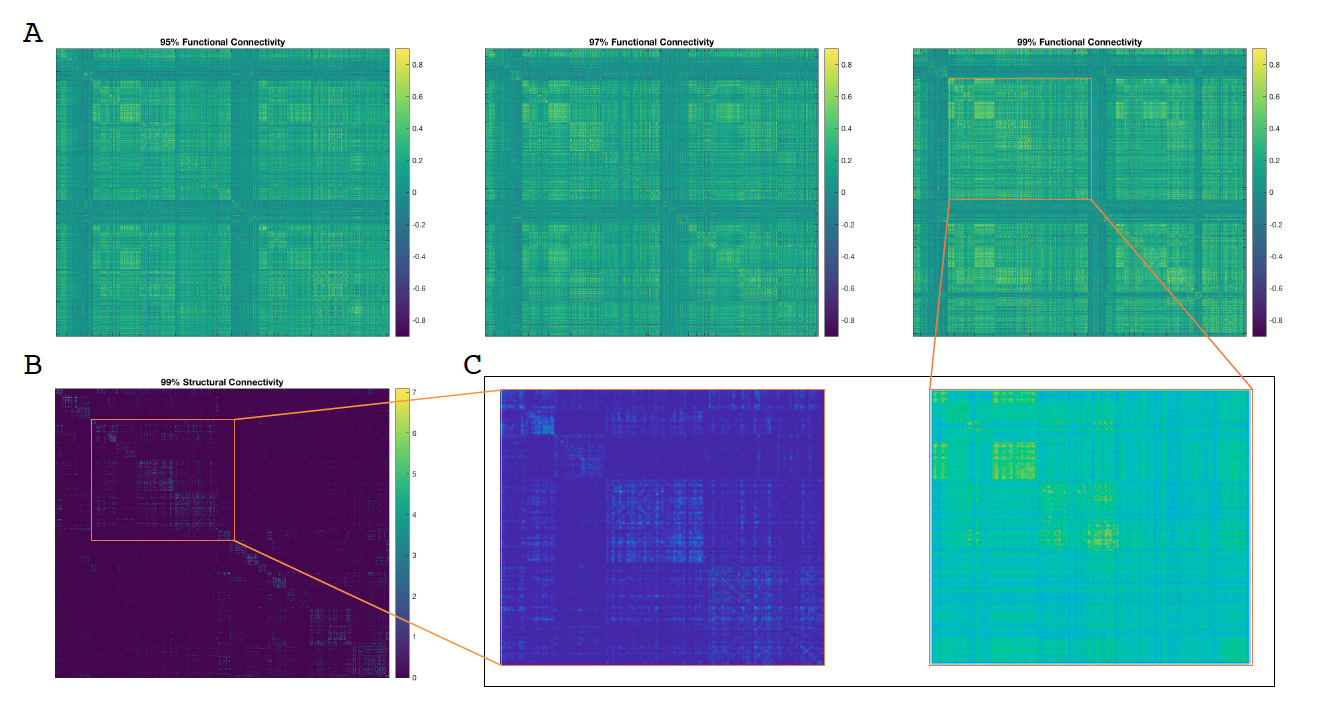
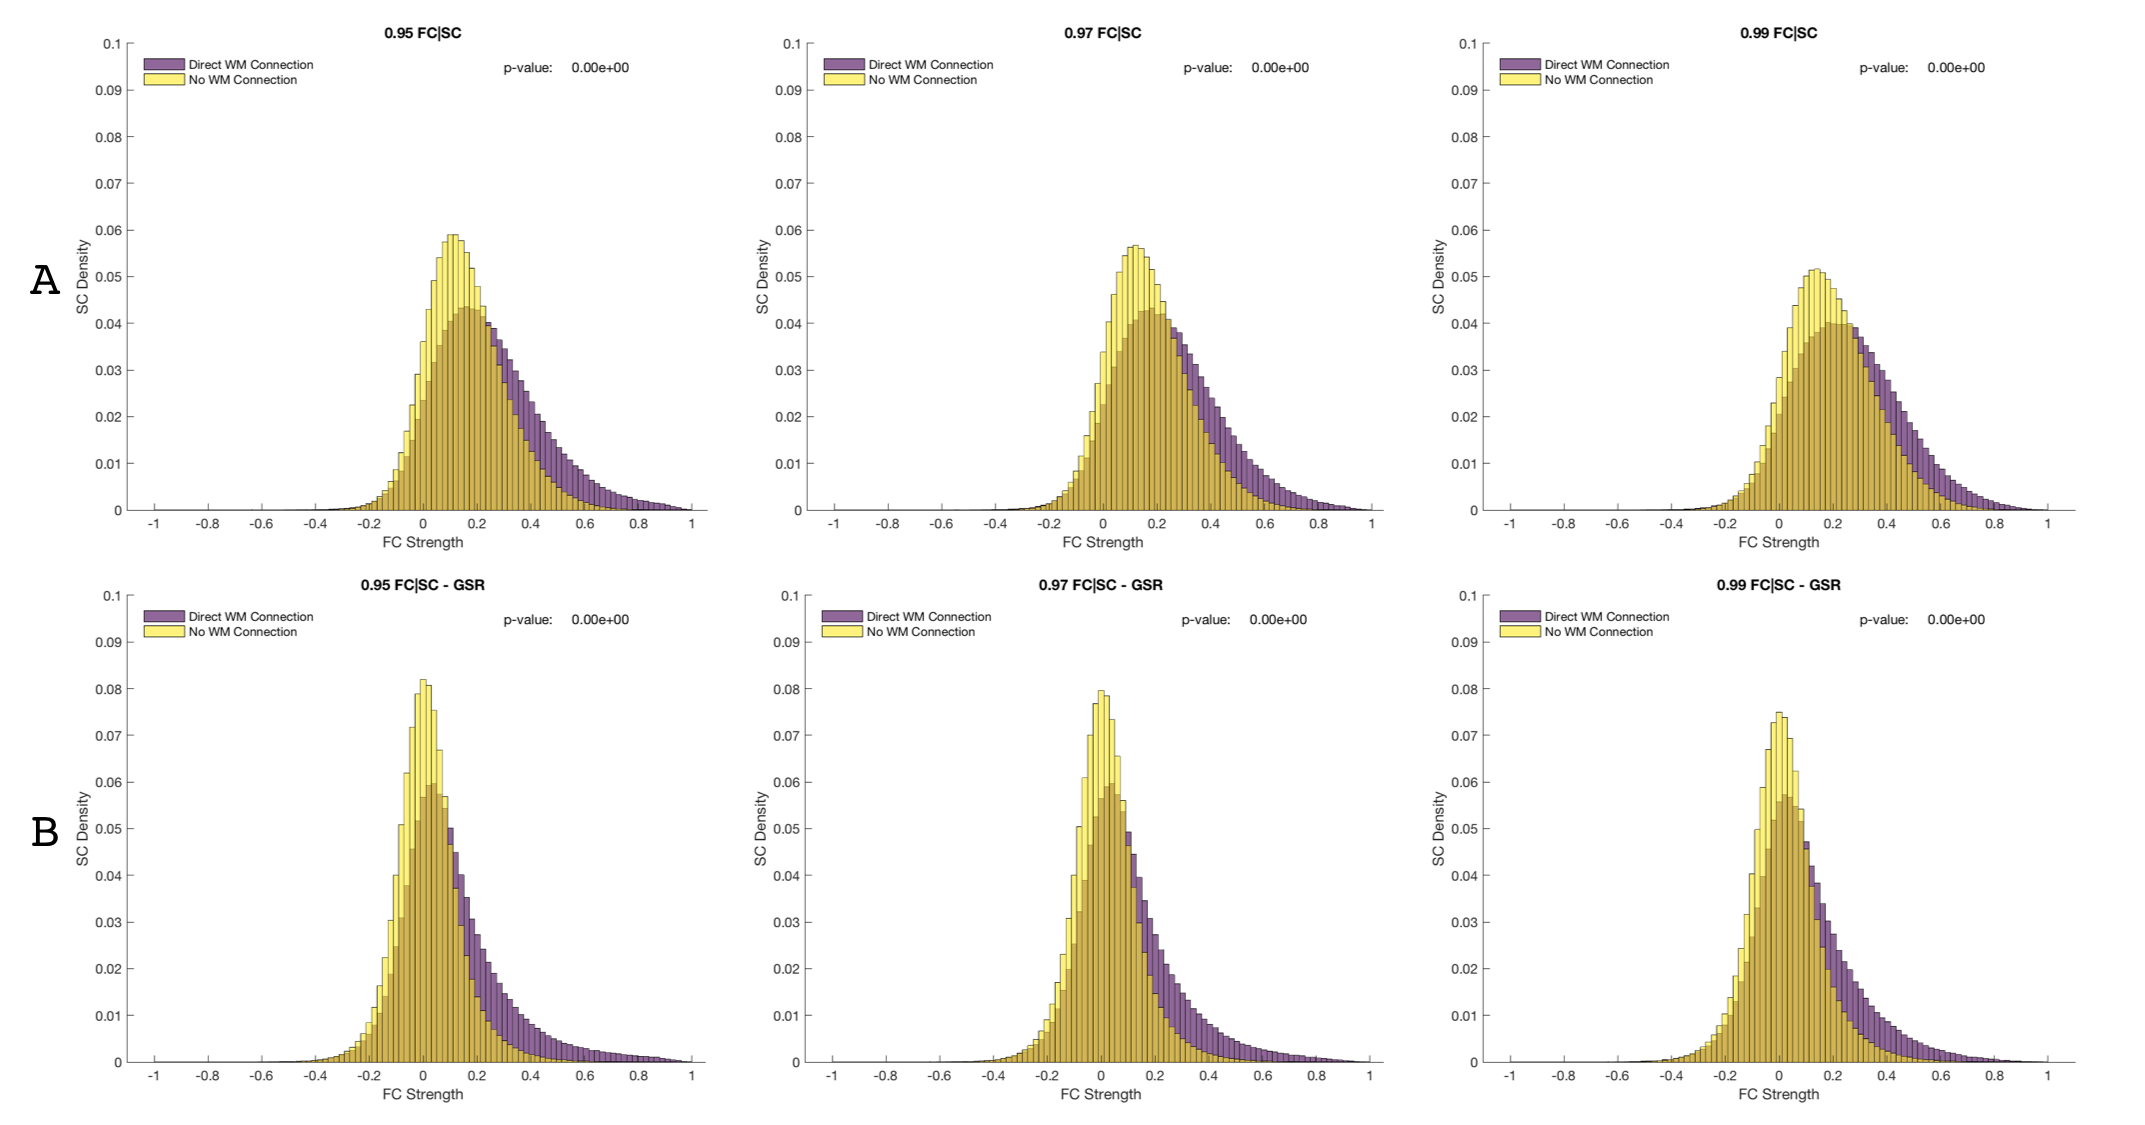
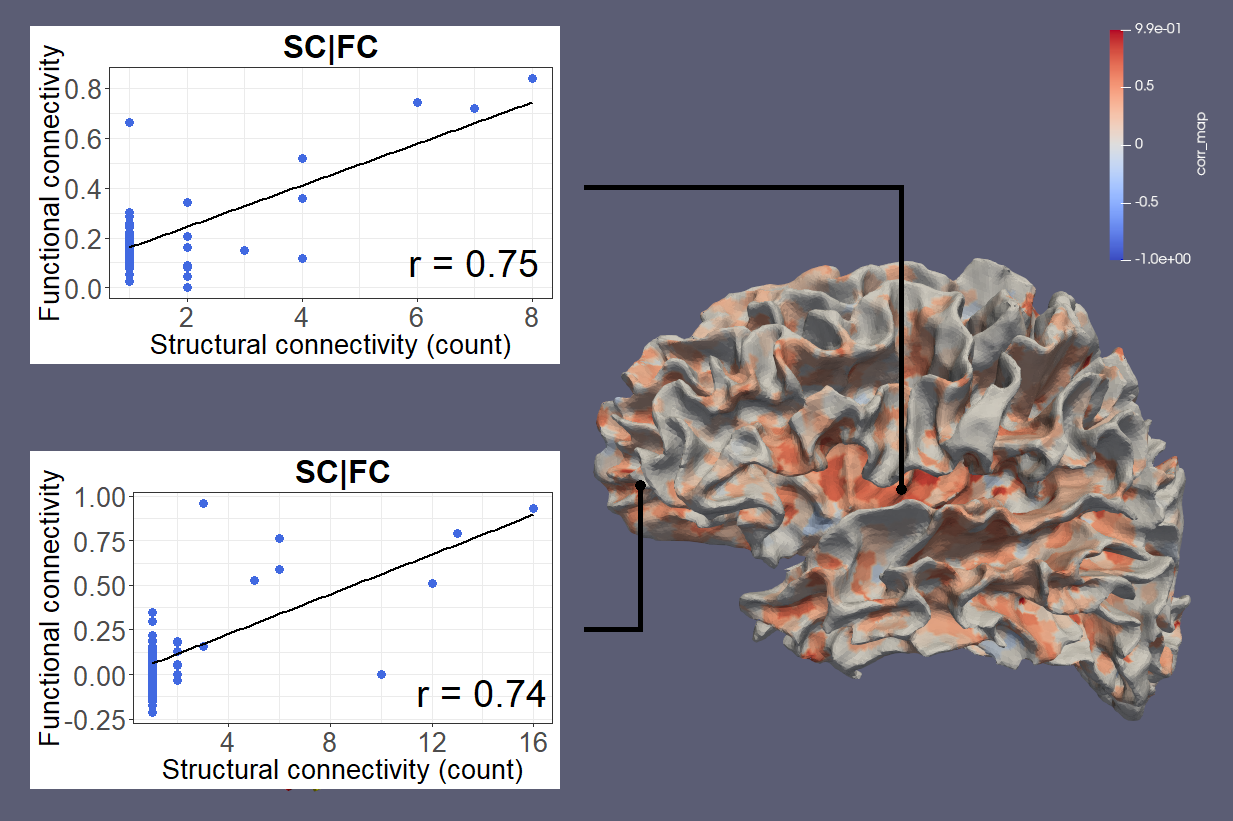
Figure 1 shows SC and FC matrices calculated after down-sampling by 95, 97, and 99% of the original number of vertices. Regional connection patterns are preserved at all resolutions, which also correspond to standard atlas resolution. Figure 2 compares distributions of FC given SC with and without GSR. At all resolutions, means of FC with and without WM connections with GSR are 0.09 and 0.017 while means without GSR are 0.22 and 0.15. Figure 3 shows FC given SC across and within the left and right frontal lobes. Mean functional correlations with WM connections are higher (0.1) within than across (0.05) brain lobes. Mean correlations without WM connections are also high within (0.02) than across (0.016) lobes. Figure 4 shows a vertex-wise representation of the correlation between and SC and FC.Discussion
Our processing pipeline shows for the first time in connectivity analysis that it is possible to explore SC, FC, and the integration of both on the GM-WM surface at the resolution of an anatomical image without the need of any parcellation atlas, which are typically limited to information from structural or functional features, only6. While methods to project functional signals to the brain surface are well established, SET now overcomes the lack of dMRI signal near the GM-WM boundary and allows tractography to be reliably extended to this surface, providing a starting point to interrogate relationships between SC and FC at any vertex-wise resolution, including standard atlas parcellations.Our results find expected structural and functional relationships throughout the brain, demonstrating that SC and FC are inherently linked7. These relationships may also provide insight into better brain parcellations by integrating features from multiple imaging modalities. FC is higher between vertices that have direct WM connections, short-range fibers are linked with higher FC than long-range fibers, and FC is higher within and between brain regions. Finally, we introduce a novel imaging feature, SC-FC integrity, that represents the similarity between SC and FC at a localized level and may be able to reveal pathological effects. This new feature may have the potential to reveal individual variations in brain networks or pathological changes to the connectome at a more detailed level than ever before8,9. Statistical evaluation across multiple subjects is required to quantify the clinical utility of the SC-FC integrity beyond providing individual surface maps of connectivity similarity.
Conclusion
SBCI demonstrates that it is possible to begin pushing the bounds of connectivity resolution via dMRI and rs-fMRI post-processing to explore new connectivity features on the GM-WM surface. This integrative approach to connectivity allows us to ask more complicated questions related to the human connectome, discover connectivity-inspired biomarkers, and explore connectivity without the limitations associated with current parcellated atlases.Acknowledgements
This work was supported by the NIH 5R01AG054328-03 and 5R01MH118020-02 grants. We would like to acknowledge the study coordinators and study participants.References
1. Jenkinson M, Beckmann C, Behrens T, Woolrich M, Smith S. FSL. NeuroImage, 62:782-90, 2012.
2. Avants B, Tustison N, Song G. Advanced Normalization Tools (ANTs) Release 1.5. University of Pennsylvania, 2011.
3. Greve, Douglas N, and Bruce Fischl. Accurate and robust brain image alignment using boundary-based registration. NeuroImage vol. 48,1: 63-72, 2009.
4. http://surfer.nmr.mgh.harvard.edu/
5. St-Onge E, Daducci A, Girard G, Descoteaux M. Surface-enhanced tractography (SET). NeuroImage. 169. 2017.
6. Yao Z, Hu B, Xie Y, Moore P, Zheng J. A review of structural and functional brain networks: small world and atlas. Brain Informatics, 2(1), 45-52, 2015.
7. Huang H, Ding M. Linking Functional Connectivity and Structural Connectivity Quantitatively: A Comparison of Methods. Brain connectivity, 6(2), 99–108, 2016.
8. Gratton C, Laumann T, Nielsen A, et al. Functional Brain Networks Are Dominated by Stable Group and Individual Factors, Not Cognitive or Daily Variation. Neuron. 98(2):439–452.e5, 2018.
9. Fox M, Grecius, M. Clinical Applications of Resting State Functional Connectivity. Frontiers in Systems Neuroscience. 4. 2010.
Figures