3963
Post-surgical human brain functional reorganization in gliomas: a longitudinal study
Francesca Saviola1, Lisa Novello1, Domenico Zacà1,2, Luciano Annicchiarico3,4, Luca Zigiotto3,4, Silvio Sarubbo3,4, and Jorge Jovicich1
1CIMeC, Center for Mind/Brain Sciences, University of Trento, Rovereto, Italy, 2Siemens Healthcare, Milano, Italy, 3Department of Neuroscience,, Division of Neurosurgery, S.Chiara Hospital, Trento, Italy, 4Structural and Functional Connectivity Lab, S.Chiara Hospital, Trento, Italy
1CIMeC, Center for Mind/Brain Sciences, University of Trento, Rovereto, Italy, 2Siemens Healthcare, Milano, Italy, 3Department of Neuroscience,, Division of Neurosurgery, S.Chiara Hospital, Trento, Italy, 4Structural and Functional Connectivity Lab, S.Chiara Hospital, Trento, Italy
Synopsis
The recent brain connectomic framework has introduced a shift in the study of brain tumors. Previously considered as a focal brain disease, brain tumors are nowadays also studied in the context of structural and functional neural networking disruptions and their cognitive consequences. In this longitudinal behavior and resting state functional MRI study, we investigate how tumor grade, behavior and functional connectivity in brain network hubs and their connections to non-hubs are affected following surgical tumor resection.
INTRODUCTION
Magnetic resonance imaging (MRI) offers a powerful non-invasive tool to quantify structural and functional connectivity (FC) changes during brain tumor (BT) development and post-intervention plasticity mechanisms. Recent studies show aberrant connectivity in BT patients compared to healthy controls, with widespread network topology changes1,2, decreased efficiency in communication flow throughout brain regions3 and increased number of structural connections in highly connected brain areas, called hubs4. Global connectome changes have been associated with cognitive performance in patients2, with associations between cognitive domains and functional networks5,6. However, these cross-sectional studies have the limitation of mixing effects from different disease stages. Here we investigate longitudinal changes of human brain FC related to cognitive functions following awake brain surgery, which allows using each subject’s pre-surgery data point as its own control over time. The long-term goal is to predict longitudinal mechanisms of spread of disease and treatment response by means of FC changes.MATERIALS AND METHODS
A total of 33 BT patients (10 females; subtypes: 17 High-grade Gliomas (HGG), 11 Low-grade Gliomas (LGG), 4 Cavernomas, 1 Mesial temporal sclerosis; age (mean, SD) 49±15 years) with different treatments participated in this longitudinal study. Patients were studied using a 1.5T GE MRI system acquiring structural and resting-state functional MRI (rs-fMRI)7 together with neuropsychological assessments before, approximately 6-month post-surgery and then every three or six months as follow-up. Rs-fMRI sessions and their respective T1-weighted images were pre-processed using standard steps7 in SPM128 and then warped in MNI space. To construct FC matrices for each patient at every timepoint a functional parcellation atlas9 was used defining 333 nodes belonging to different brain functional networks. A FC matrix per subject per session was created by calculating absolute value of Pearson’s correlation coefficients between time series from all atlas regions and then used as weighted measures of FC between nodes of the network. Functional hubs were defined as the nodes belonging to default mode network (DMN) and fronto-parietal network (FPN) in the reference atlas9-13. Non-hubs were defined as regions belonging to primary sensory functional networks and any other nodes remaining from hubs selection in the parcels. FC metrics were derived as functional connections: (i) within DMN, (ii) within FPN, (iii) within hubs, (iv) between hubs and non-hubs, (v) within non-hubs. For each subject, FC was also investigated by using Independent Component Analysis (ICA)14. Longitudinal sessions were concatenated for decomposition with 20 components and then dual regression was used to derive rs-fMRI networks for each subject at each time point to investigate consistency with reference parcellation atlas9. FC metrics were normalized for mean intra-individual connectivity before performing statistical analysis by means of the following two linear mixed models:- Neuropsychological measures ~ Months+Age+Gender+Lateralization+Tumor grade+Treatment+(1 | Patient)+ε
- Functional Connectivity ~ Months+Age+Gender+Lateralization+Tumor grade+Treatment+Neuropsychological measures+(1 | Patient)+ε
RESULTS
Quality assurance of pre-processed rs-fMRI data showed no strong head movement effects (motion < 2 mm) or image artifacts, despite surgical resections. ICA analysis revealed good agreement with known rs-fMRI networks, resembling atlas parcels (Figure 1). Neuropsychologically, long-term memory (LTM) and naming scores improved while short-term memory (STM) worsens (Figure 2). FC metrics showed subtle but significant longitudinal effects, after surgical resection (Figure 3): (i) increase of FC within DMN (p-=.014, Cohen’s d=0.78), (ii) increase of FC between hubs and non-hubs regions (p=.045, Cohen’s d=0.63), and (iii) decrease of FC within non-hubs regions (p=.045, Cohen’s d=-0.63). No significant longitudinal effects were found for FC within FPN and within hubs. Moreover, considering only BT stage and regardless of other covariates, the higher the tumor grade at baseline the lower FC between hubs (p=.048, Cohen’s d=-0.79) and non-hubs regions and the higher FC within non-hubs regions (p=.047, Cohen’s d=0.79). The association between neuropsychological scores and FC showed that, regardless of other covariates, FC within hubs increased with memory scores in different ways: DMN FC was associated to LTM and FPN FC to STM.DISCUSSION
We discuss the results in terms of network hubs and tumor grade. With respect to hubs, FC in DMN, a network widely associated to LTM15-17, longitudinally increases to potentially maintain the behavioral performance as a functional compensation mechanism. Such a compensatory effect was longitudinally absent in FPN, better associated to STM18,19, which is consistent with the observed short-term score decrease over time. With respect to tumor grade, we replicate previous results showing that connectomic profiles distinctly relate to tumor grade2. Indeed, at baseline HGG show reduced FC in hub-non-hub networks and increased FC within non-hubs networks while compared to LGG. Our study adds information about the temporal development of these effects. Longitudinally, we see that compensation effects within these networks are stronger in HGG than in LGG. In other words, fast pathology development typical of HGG may induce larger network disruptions which need stronger functional compensation mechanisms relative to those needed in LGG11.CONCLUSIONS
To the best of our knowledge, this is the first pre/post brain tumor surgery study investigating longitudinal functional brain reorganization and resulting cognitive signatures. This study highlights the role of network hubs, such as DMN and FPN, in post-surgical recovery of cognitive functions and therefore stresses the importance of considering these functional networks in pre-surgical planning to minimize their damage, especially in HGG.Acknowledgements
No acknowledgement found.References
- Carrera, E., & Tononi, G. (2014). Diaschisis: past, present, future. Brain, 137(9), 2408-2422.
- Derks, J., Dirkson, A. R., de Witt Hamer, P. C., van Geest, Q., Hulst, H. E., Barkhof, F., ... & Douw, L. (2017). Connectomic profile and clinical phenotype in newly diagnosed glioma patients. NeuroImage: Clinical, 14, 87-96.
- Xu, H., Ding, S., Hu, X., Yang, K., Xiao, C., Zou, Y., ... & Qian, Z. (2013). Reduced efficiency of functional brain network underlying intellectual decline in patients with low-grade glioma. Neuroscience letters, 543, 27-31.
- Douw, L., Miller, J. J., Steenwijk, M. D., Stufflebeam, S. M., & Gerstner, E. R. (2019). Altered structural hub connectivity and its clinical relevance in glioma. bioRxiv, 610618.
- Maesawa, S., Bagarinao, E., Fujii, M., Futamura, M., Motomura, K., Watanabe, H., ... & Wakabayashi, T. (2015). Evaluation of resting state networks in patients with gliomas: connectivity changes in the unaffected side and its relation to cognitive function. PLoS One, 10(2), e0118072.
- Liu, D., Hu, X., Liu, Y., Yang, K., Xiao, C., Hu, J., ... & Liu, H. (2019). Potential Intra-or Cross-Network Functional Reorganization of the Triple Unifying Networks in Patients with Frontal Glioma. World neurosurgery.
- Zacà, D., Jovicich, J., Corsini, F., Rozzanigo, U., Chioffi, F., & Sarubbo, S. (2018). ReStNeuMap: a tool for automatic extraction of resting-state functional MRI networks in neurosurgical practice. Journal of Neurosurgery, 1(aop), 1-8.
- Ashburner, J., Barnes, G., Chen, C., Daunizeau, J., Flandin, G., Friston, K., ... & Penny, W. (2014). SPM12 manual. Wellcome Trust Centre for Neuroimaging, London, UK.
- Gordon, E. M., Laumann, T. O., Adeyemo, B., Huckins, J. F., Kelley, W. M., & Petersen, S. E. (2014). Generation and evaluation of a cortical area parcellation from resting-state correlations. Cerebral cortex, 26(1), 288-303.
- Buckner, R. L., Sepulcre, J., Talukdar, T., Krienen, F. M., Liu, H., Hedden, T., ... & Johnson, K. A. (2009). Cortical hubs revealed by intrinsic functional connectivity: mapping, assessment of stability, and relation to Alzheimer's disease. Journal of neuroscience, 29(6), 1860-1873.
- Van Den Heuvel, M. P., & Pol, H. E. H. (2010). Exploring the brain network: a review on resting-state fMRI functional connectivity. European neuropsychopharmacology, 20(8), 519-534.
- Zanto, T. P., & Gazzaley, A. (2013). Fronto-parietal network: flexible hub of cognitive control. Trends in cognitive sciences, 17(12), 602-603.
- Power, J. D., Schlaggar, B. L., Lessov-Schlaggar, C. N., & Petersen, S. E. (2013). Evidence for hubs in human functional brain networks. Neuron, 79(4), 798-813.
- Smith, S. M., Jenkinson, M., Woolrich, M. W., Beckmann, C. F., Behrens, T. E., Johansen-Berg, H., ... & Niazy, R. K. (2004). Advances in functional and structural MR image analysis and implementation as FSL. Neuroimage, 23, S208-S219.
- Wirth, M., Jann, K., Dierks, T., Federspiel, A., Wiest, R., & Horn, H. (2011). Semantic memory involvement in the default mode network: a functional neuroimaging study using independent component analysis. Neuroimage, 54(4), 3057-3066.
- Gardini, S., Venneri, A., Sambataro, F., Cuetos, F., Fasano, F., Marchi, M., ... & Caffarra, P. (2015). Increased functional connectivity in the default mode network in mild cognitive impairment: a maladaptive compensatory mechanism associated with poor semantic memory performance. Journal of Alzheimer's Disease, 45(2), 457-470.
- Philippi, C. L., Tranel, D., Duff, M., & Rudrauf, D. (2014). Damage to the default mode network disrupts autobiographical memory retrieval. Social cognitive and affective neuroscience, 10(3), 318-326.
- Wallis, G., Stokes, M., Cousijn, H., Woolrich, M., & Nobre, A. C. (2015). Frontoparietal and cingulo-opercular networks play dissociable roles in control of working memory. Journal of Cognitive Neuroscience, 27(10), 2019-2034.
- Babiloni, C., Babiloni, F., Carducci, F., Cincotti, F., Vecchio, F., Cola, B., ... & Rossini, P. M. (2004). Functional frontoparietal connectivity during short-term memory as revealed by high-resolution EEG coherence analysis. Behavioral neuroscience, 118(4), 687.
Figures
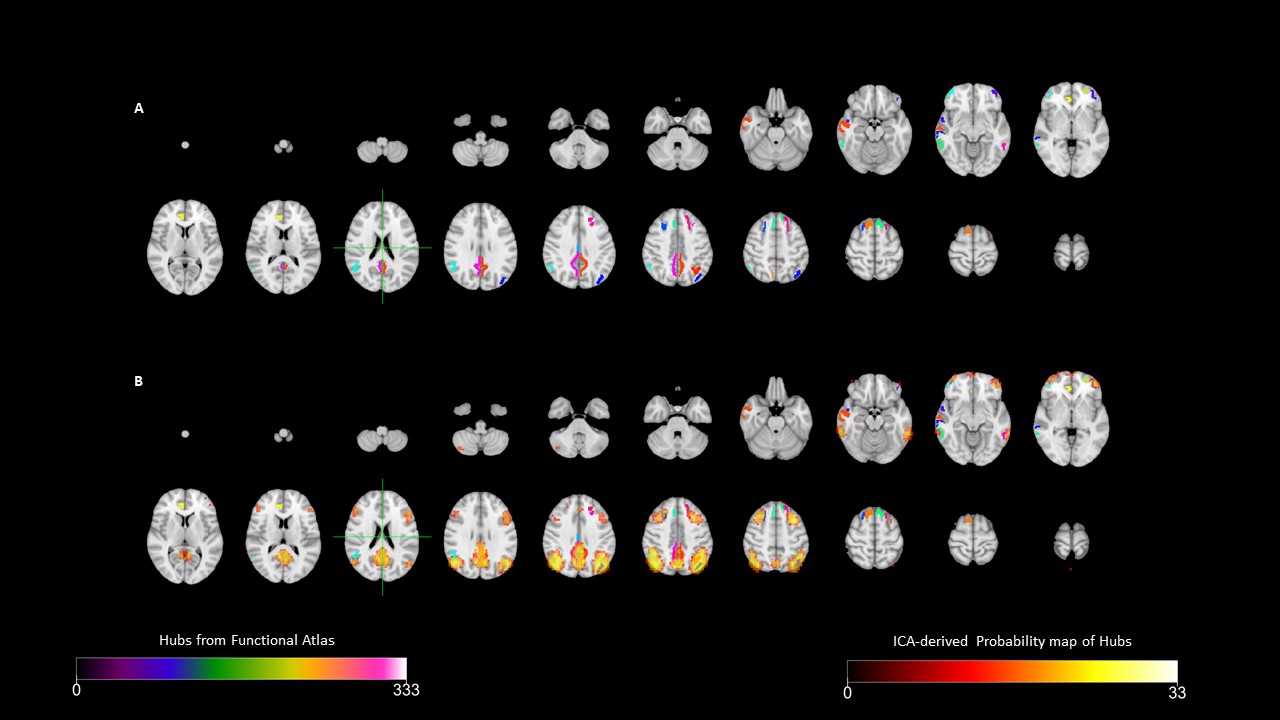
Functional parcellation of hubs quality check. Panel A represents cortical regions of the atlas
defined as hubs in the functional parcellation9. Panel B represents
the group probability map of the default mode network (DMN) with left and right fronto-parietal networks (FPN) as derived
from Independent Component Analysis (ICA), with the overlay of the atlas parcellation areas (panel A).
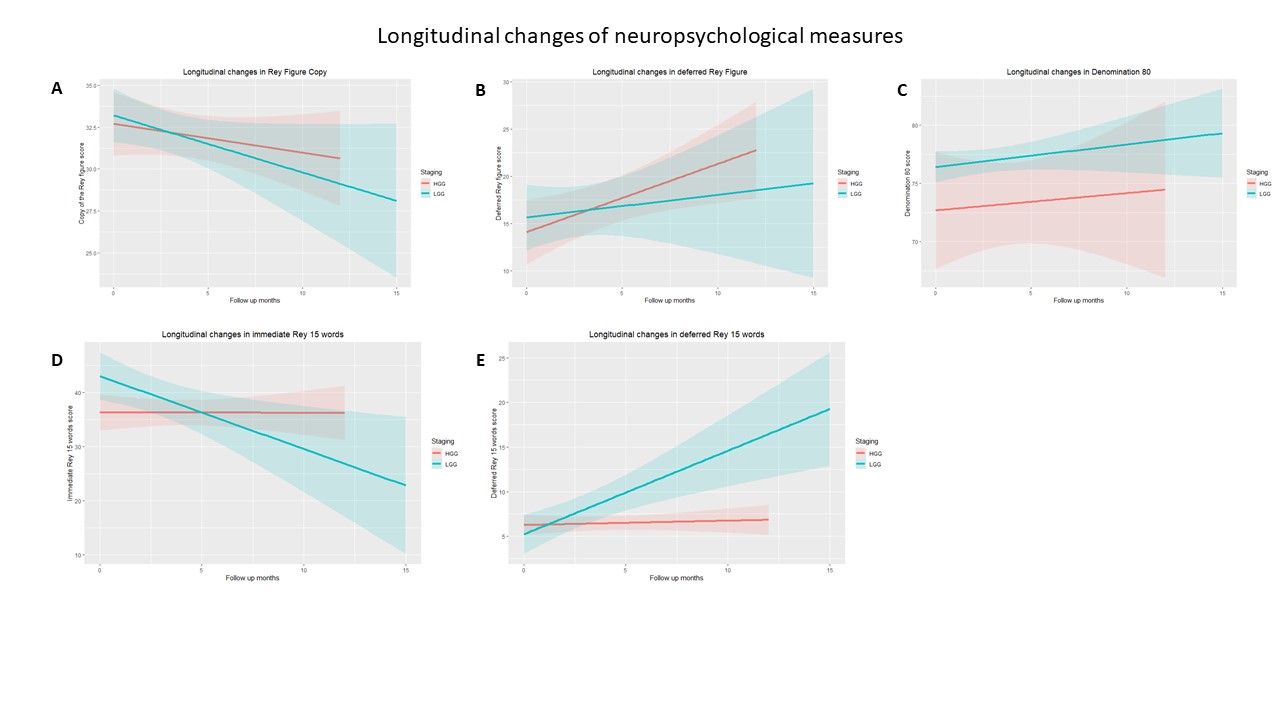
Neuropsychological longitudinal profile. Panel A and D show negative longitudinal effect on short-term
memory measures: Copy of Rey figure (p-value=.019,
Cohen’s d=-0.76) and 15 immediate Rey
words (p-value=.038, Cohen’s d=-0.67). Panel B and E show
positive longitudinal effect on long-term memory measures: deferred Rey figure (p-value=.01, Cohen’s d=0.85) and 15 deferred Rey words (p-value=.016, Cohen’s d=0.79).
Panel C shows positive longitudinal effect on naming measure Denomination 80 (p-value=.017, Cohen’s d=0.79). HGG:
High-grade glioma, LGG: Low-grade glioma.
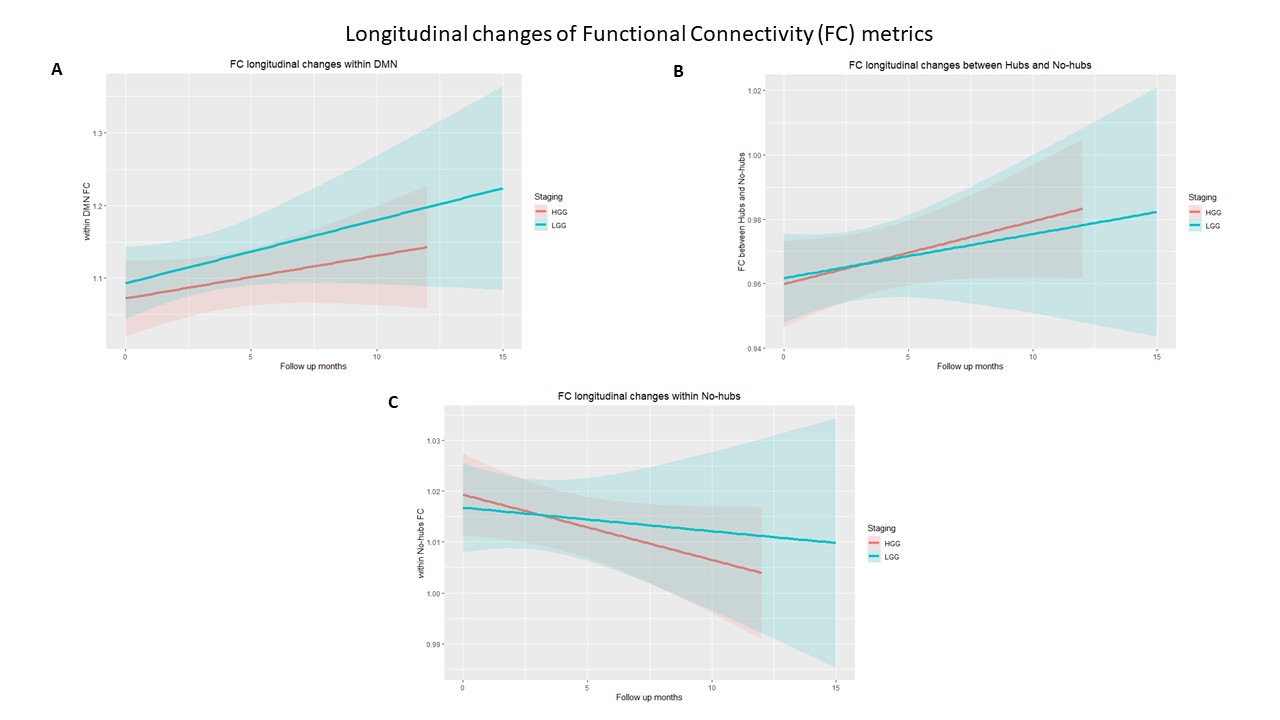
Functional connectivity longitudinal changes. Panel A shows positive longitudinal effects on within default mode network (DMN) functional connections (p-value=.014,
Cohen’s d=0.78). Panel B shows
positive longitudinal effects between hubs and non-hubs functional connections (p-value=.045, Cohen’s d=0.63). Panel C shows negative longitudinal effects on within
non-hubs functional connections (p-value=.045,
Cohen’s d=-0.63). HGG: High-grade
glioma, LGG: Low-grade glioma.