3962
Improved Between-group Effect Size via Multisite Functional Connectivity Normalization1Bioengineering, University of California, Riverside, Riverside, CA, United States, 2Center for Advanced Neuroimaging, University of California, Riverside, Riverside, CA, United States
Synopsis
Multisite databases allow for increased statistical power and enhanced reproducibility, however data pooled across sites are often acquired with different scanners and/or protocols, leading to significant site-dependent variances and thereby reduced effects in group analyses. We quantified the functional connectivity variance associated with the Autism Brain Imaging Data Exchange, a multisite resting state functional MRI database, and demonstrate how normalization functional connectivity results led to increased effect size when measuring established functional connectivity changes in autistic subjects as compared to healthy controls.
Introduction
Multisite databases allow for accelerated data acquisition, increased statistical power, enhanced reproducibility, and a wider scope of symptoms associated with psychiatric disorders to be captured in neuroimaging studies. However, resting state fMRI (rsfMRI) data pooled across sites are often acquired with different protocols and scanners, which can lead to significant site-dependent variances in the data1–4. This variance may reduce group effects and hinder the development of functional markers for psychiatric disorders. Few studies report the ability to mitigate site effects on resting state data post-acquisition1,2. General Linear Model harmonization and a method called ComBat have been used to adjust functional connectivity (FC) values for site differences, however these methods are known to eliminate biologically meaningful information1,2. Here, we examine the effects of site on resting state FC in the Autism Brain Imaging Data Exchange (ABIDE), a consortium of rsfMRI data across 17 international sites composed of 539 Autistic (ASD) subjects and 573 healthy controls (HCs)5. We then demonstrate how normalization of the FC matrices leads to increased effect size when measuring established FC changes in ASD subjects as compared to HCs.Methods
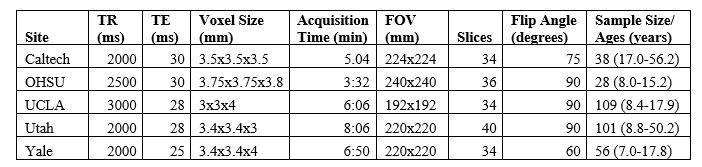
The ABIDE I preprocessed data from sites with the Siemens Trio 3T scanner (California Institute of Technology, Oregon Health and Science University, University of California Los Angeles, University of Utah, and Yale University) were used in the analysis5. Scan parameters and sample sizes from the aforementioned sites are described in Table 1. The rsfMRI data were preprocessed using the C-PAC pipeline of the ABIDE Preprocessed Connectome Project (http://preprocessed-connectomes-project.org/abide/) initiative. The Thomas Yeo 17 network mask was used to parcellate the brains of all subjects6. Pearson’s correlation coefficients were determined and a 17x17 FC correlation matrix was created for each subject. The effect of site on FC was determined by performing a Kruskal-Wallis one-way ANOVA to analyze the FC variance of HCs from different sites.The default mode network (DMN) is a core brain network responsible for processing information about self and others, and there is thought to be a potential link between aberrant DMN FC and social deficits in ASD7. Previous work has shown hyperconnectivity within the DMN during resting state in ASD compared to HCs8,9. The Salience network (SN) is responsible for orienting attentional resources to environmental stimuli that are the most important to attend to10. Previous work has also shown that at resting state, ASD is associated with hyperconnectivity between the SN and primary sensory processing areas, such as the visual network, which is thought to contribute to sensory over-responsivity symptoms of ASD11. To ascertain whether normalization increased the effect size of FC differences between the subject groups among the networks of interest, the FC matrices were normalized by z-score for each subject. Cohen’s d was used to measure effect size before and after normalization. It is suggested that d=0.2 is considered to be a small effect size, 0.5 represents a medium effect size and 0.8 represents a large effect size12.
Results
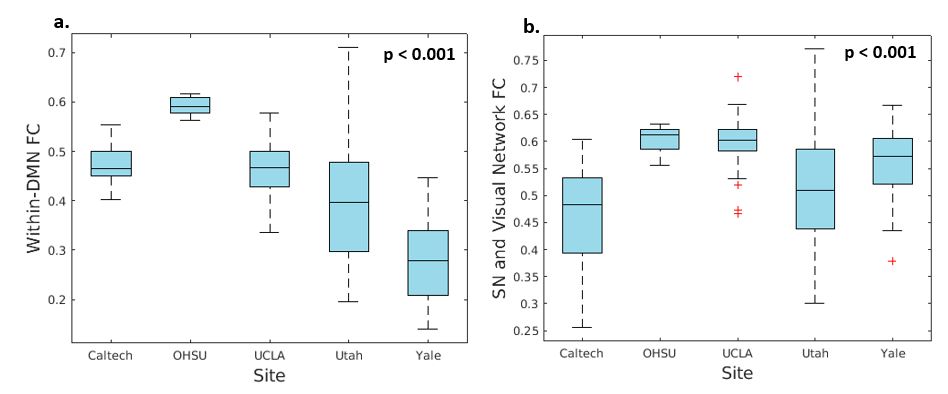
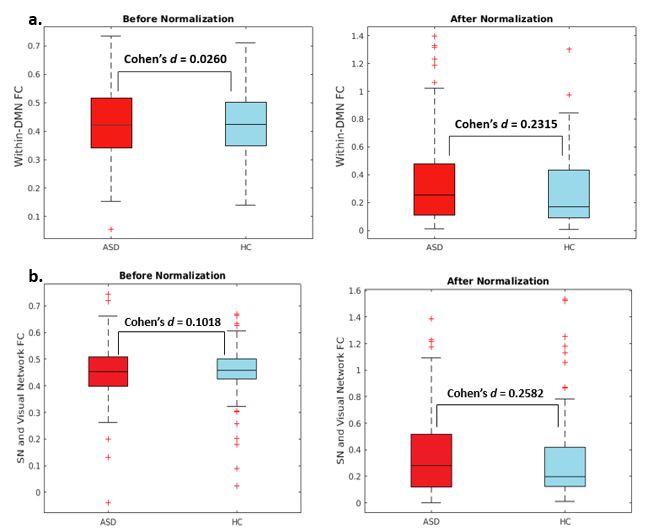
Out of all of the combinations of networks in the FC matrices of HCs, 98.5% showed a significant effect of site (p<0.05). The Kruskal-Wallis test showed that there was a significant difference in FC within the DMN of HCs between the different sites, χ2(4)=65.922,p<0.001 (Figure 1a), and between the SN and visual network between different sites, χ2(4)=36.204,p<0.001 (Figure 1b). A post hoc pairwise comparison test showed that there was a significant difference between nine of the ten pairs of sites for within-DMN FC (p<0.05) and seven of the ten pairs of sites for between SN and visual network FC (p<0.05).As shown in Figure 2a, Cohen’s d of the within-DMN FC comparing ASD subjects to HCs was significantly improved after normalization (d=0.2315,p=0.114) as compared to before (d=0.0260,p=0.966). The Cohen’s d of the SN and visual network FC comparing ASD subjects to HCs before normalization was 0.1018 (p=0.387) and significantly improved (d=0.2582,p=0.089) after z-scoring as shown in Figure 2b.
Discussion
FMRI data acquired across different sites using heterogeneous scanning protocols can result in inconsistent FC results. This site-induced variability may decrease the statistical power to detect changes in the brain related to ASD1–4. FC within-DMN as well as between the SN and visual network, is known to be increased compared to HCs in single site studies8,9,11. Prior to normalization, the effect size of within-DMN FC and between SN and visual network FC between the diagnostic groups was negligible, however after normalization, the effect size increased, showing greater consistency with previous work8,9,11. Thus it is possible that normalization mitigates some of the effects of the heterogeneity associated with multisite pooling of rsfMRI data.Conclusion
Considerable variability exists in multisite fMRI data, and FC normalization increases the effect size in group comparison of pooled data. Our future work will focus on post-acquisition harmonization after determining how specific scanning parameters affect FC results.Acknowledgements
We acknowledge the use of the ABIDE data set.References
1. Yu, M. et al. Statistical harmonization corrects site effects in functional connectivity measurements from multi-site fMRI data. Hum. Brain Mapp. 39, 4213–4227 (2018).
2. Yamashita, A. et al. Harmonization of resting-state functional MRI data across multiple imaging sites via the separation of site differences into sampling bias and measurement bias. PLoS Biol. 17, e3000042 (2019).
3. Rane, S. et al. The effect of echo time and post-processing procedure on blood oxygenation level-dependent (BOLD) functional connectivity analysis. Neuroimage 95, 39–47 (2014).
4. Dansereau, C. et al. Statistical power and prediction accuracy in multisite resting-state fMRI connectivity. Neuroimage 149, 220–232 (2017).
5. Di Martino, A. et al. The autism brain imaging data exchange: towards a large-scale evaluation of the intrinsic brain architecture in autism. Mol. Psychiatry 19, 659–667 (2014).
6. Yeo, B. T. T. et al. The organization of the human cerebral cortex estimated by intrinsic functional connectivity. J. Neurophysiol. 106, 1125–1165 (2011).
7. Molnar-Szakacs, I. & Uddin, L. Q. Self-processing and the default mode network: interactions with the mirror neuron system. Front. Hum. Neurosci. 7, 571 (2013).
8. Lynch, C. J. et al. Default mode network in childhood autism: posteromedial cortex heterogeneity and relationship with social deficits. Biol. Psychiatry 74, 212–219 (2013).
9. Uddin, L. Q. et al. Salience network-based classification and prediction of symptom severity in children with autism. JAMA Psychiatry 70, 869–879 (2013).
10. Toyomaki, A. & Murohashi, H. ‘Salience network’ dysfunction hypothesis in autism spectrum disorders: Sensory abnormality. Jpn. Psychol. Res. 55, 175–185 (2013).
11. Green, S. A., Hernandez, L., Bookheimer, S. Y. & Dapretto, M. Salience Network Connectivity in Autism Is Related to Brain and Behavioral Markers of Sensory Overresponsivity. J. Am. Acad. Child Adolesc. Psychiatry 55, 618–626.e1 (2016).
12. Cohen, J. Statistical Power Analysis for the Behavioral Sciences, Second Edition. (1988).
Figures