3961
Detection of tiny oscillatory magnetic fields toward low-field fMRI: A phantom and simulation study
Hiroyuki Ueda1, Yosuke Ito1, Takenori Oida1, Yo Taniguchi2, and Tetsuo Kobayashi1
1Electrical Engineering, Kyoto University, Kyoto, Japan, 2Hitachi, Ltd., Kokubunji, Japan
1Electrical Engineering, Kyoto University, Kyoto, Japan, 2Hitachi, Ltd., Kokubunji, Japan
Synopsis
To detect neural activities using a low-field MRI, we focused on spin-lock techniques, which are potentially effective tools for low-field functional MRI (fMRI). First, we estimated the magnetic field strength generated from neural activities using an equivalent current dipole model. Subsequently, we compared two spin-lock techniques by simulation and phantom experiments. It was found that the lowest detectable field strength was several tens pT in the simulation, whereas the experimental one was 2.34 nT. In future work, we plan to improve SNR using noise-reduction processing to realize the low-field fMRI.
INTRODUCTION
BOLD-fMRI has a spatiotemporal limitation deriving from slow and widespread hemodynamic responses to neural activities. To overcome this limitation, some neuronal current MRI (ncMRI)1 techniques observed phase shift in MR signals caused by the neural activities had been reported. However, these methods were difficult to measure high-frequency signals or steady-state responses. Then, we focused on the spin-lock preparation sequences2–5, which can select target frequencies without such constraints. In addition, the signal displacement obtained by those sequences is independent of static magnetic fields, that is, we can apply those even to the low-field MRI. Despite the advantages that the low-field MRI scanners are cheaper and safer, there is no report that shows the feasibility of the low-field fMRI using the spin-lock preparation sequences. In this study, we investigated the magnetic field sensitivity required to identify the neural activities based on simulations using an equivalent current dipole model. We also carried out phantom experiments and compared their results with simulation results to demonstrate the feasibility of the spin-lock sequences toward low-field fMRI.METHODS
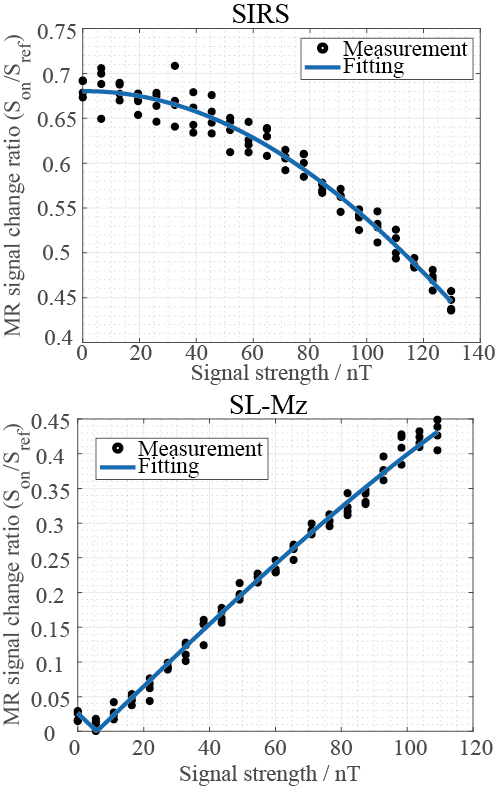
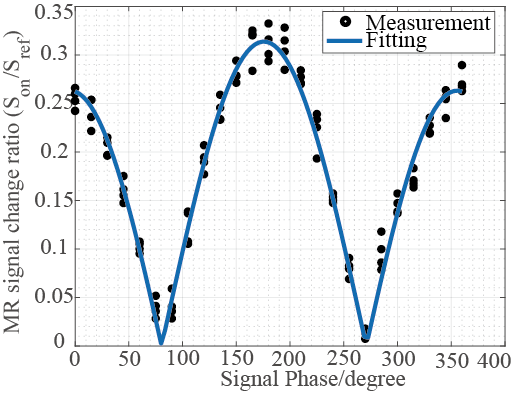
First, we estimated the magnetic fields generated by the neural activities using the equivalent current dipole model as the field strength in a voxel near the source. The dipole moment density was reported as 0.5-1.0 nAm/6. We solved Heller’s equation7, assuming that the activation area was , the current dipole moment was 6.25 nAm and its position was 4cm depth from the surface of a conducting sphere with the diameter of 25 cm. Then, we varied the dipole moment from 0 to 100nAm and got the maximum absolute value of magnetic field. Second, we compared two spin-lock preparation sequences; the stimulus-induced rotary saturation (SIRS)2 and the method proposed by Trong et al. 5, called the spin-locked Mz (SL-Mz) in this study. We simulated MR signals acquired by these sequences based on the Bloch equation8. Then, we carried out phantom experiments with a 0.3-T MRI scanner (HITACHI, AIRIS-Vento). A loop coil, which worked as a source of the magnetic field, was installed in the phantom filled with saline solution. The loop coil was connected to a function generator via a low pass filter whose cutoff frequency was 5 kHz. We applied a 100-Hz sinusoidal wave from the function generator. We observed MR signal changes as a function of signal amplitude and phase, and carried out curve fitting considering the RF accuracy.RESULTS
Figures.1 and 2 show the z component of magnetic field () generated by a current dipole and the in a voxel as function of dipole moment, respectively. Assuming that neural activity corresponds to the order of 10nAm9, the Bz in a voxel near the current dipole was calculated to be from tens to thousands pT. Its variation depended on the activation area, the current dipole moment and dipole position. The experimental results are shown in figs.3 and 4. The MR signal change ratios were calculated as MR signals with the target magnetic fields divided by T2-weight images. On the curve fitting results, we showed the estimated fitting parameters in Table. 1(a) and 1(b). The conversion rate in the table was the magnetic field (nT) divided by the function generator output (Vpp). In the case of SIRS, the estimated flip angle was 16.67 degree shifted from the set value due to the scanner limitation. However, overall, the results showed good agreement with the theory. SIRS could not detect 7.01 nT with t-test, but on the SL-Mz whose noise distribution cannot be assumed as Gaussian, there was significant difference between 0 nT and 2.34 nT with the Wilcoxon signed-rank test. Likewise, on MR signal change as function of signal phase, the empirical result also agreed with the theory, as shown in Table 1(c).DISCUSSION
The estimated magnetic fields generated by neural activities in a voxel were larger than that detectable with the spin-lock techniques reported in Jiang et al.10 and Trong et al 5. On the MR signal change as functions of signal strength and phase, the experimental results were reasonable considering RF accuracy because the values estimated by curve fitting were also reasonable. The sensitivity threshold of SL-Mz was 2.34nT, corresponding to magnetic field generated by about 75.07nAm dipole moment. SL-Mz can measure big neural activity, but it’s desirable to improve sensitivity threshold to measure smaller one. Then, it will be effective to improve SNR using deep learning or signal processing.CONCLUSION
Simulation results showed that the field strength generated from neural activites in the brain may the range from tens to thousands pT. According to the experimental results, SL-Mz was more sensitive to tiny oscillating magnetic fields than SIRS. However, SL-Mz in the low-field MRI can detect 2.34nT magnetic field o equivalent to one generated by more than 75.07nAm due to its lower SNR. In our future works, we will apply noise-reduction processing to improve SNR sufficient to detect small neural activities.Acknowledgements
This work was partially supported by a Grant-in-Aid for Research (15H01813) from the Ministry of Education, Culture, Sports, Science and Technology (MEXT), Japan and a scholarship from the Iwadare Scholarship Foundation, Japan.References
- Xiong J, Fox PT, Gao JH. Directly mapping magnetic field effects of neuronal activity by magnetic resonance imaging. Hum Brain Mapp. 2003;20(1):41-49. doi:10.1002/hbm.10124
- Witzel T, Lin FH, Rosen BR, Wald LL. Stimulus-induced Rotary Saturation (SIRS): A potential method for the detection of neuronal currents with MRI. Neuroimage. 2008;42(4):1357-1365. doi:10.1016/j.neuroimage.2008.05.010
- Sheng J, Liu Y, Chai Y, Tang W, Wu B, Gao JH. A comprehensive study of sensitivity in measuring oscillatory magnetic fields using rotary saturation pulse sequences. Magn Reson Imaging. 2016;34(3):326-333. doi:10.1016/j.mri.2015.11.007
- Chai Y, Bi G, Wang L, et al. Direct detection of optogenetically evoked oscillatory neuronal electrical activity in rats using SLOE sequence. Neuroimage. 2016;125:533-543. doi:10.1016/j.neuroimage.2015.10.058
- Truong TK, Roberts KC, Woldorff MG, Song AW. Toward direct MRI of neuro-electro-magnetic oscillations in the human brain. Magn Reson Med. 2019;81(6):3462-3475. doi:10.1002/mrm.27654
- Murakami S, Okada Y. Invariance in current dipole moment density across brain structures and species: Physiological constraint for neuroimaging. Neuroimage. 2015;111:49-58. doi:10.1016/j.neuroimage.2015.02.003
- Heller L, Ranken D, Best E. The magnetic field inside special conducting geometries due to internal current. IEEE Trans Biomed Eng. 2004;51(8):1310-1318. doi:10.1109/TBME.2004.827554
- Ueda H, Seki H, Ito Y, Oida T, Taniguchi Y, Kobayashi T. Dynamics of magnetization under stimulus-induced rotary saturation sequence. J Magn Reson. 2018;295:38-44. doi:10.1016/j.jmr.2018.07.004
- Hämäläinen M, Hari R, Ilmoniemi RJ, Knuutila J, Lounasmaa O V. Magnetoencephalography theory, instrumentation, and applications to noninvasive studies of the working human brain. Rev Mod Phys. 1993;65(2):413-497. doi:10.1103/RevModPhys.65.413
- Jiang X, Sheng J, Li H, et al. Detection of subnanotesla oscillatory magnetic fields using MRI. Magn Reson Med. 2016;75(2):519-526. doi:10.1002/mrm.25553
Figures
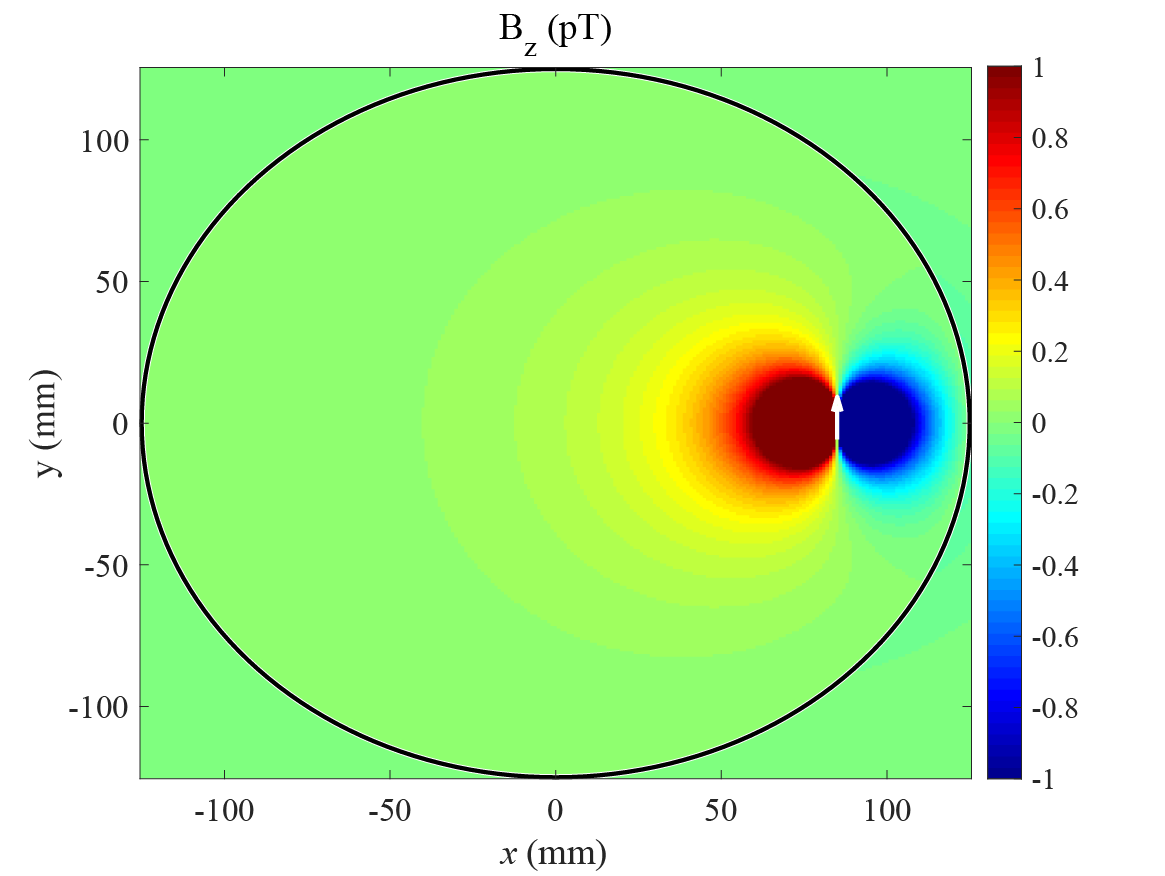
Figure 1. z component of magnetic field (Bz) generated from a tangential equivalent current
dipole located at (85mm,0mm). The white arrow is dipole moment (0,6.25nAm,0).
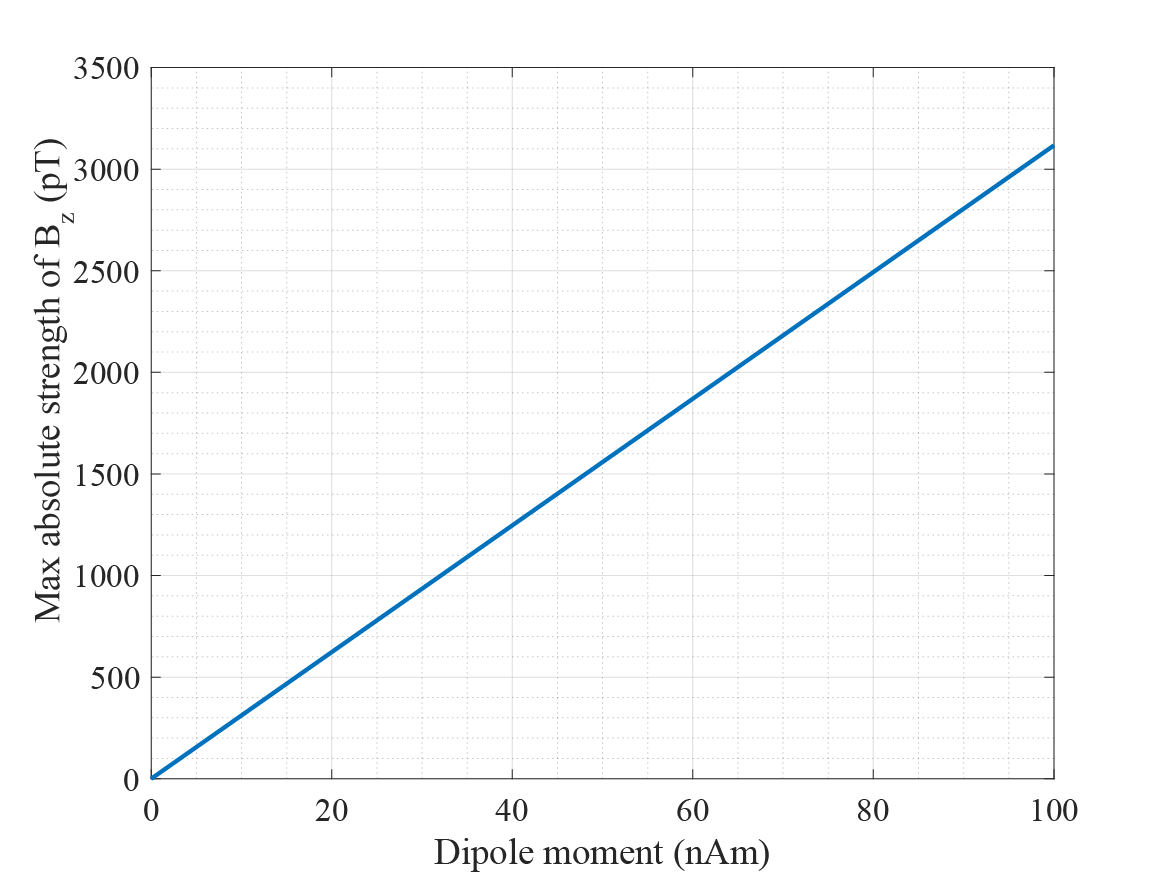
Figure 2. Bz in a 2.5 isotropic
voxel as a function of dipole moment.
Figure
3. MR
signal change ratios as a function of signal strength with SIRS and SL-Mz.
Figure
4. MR
signal change ratios as a function of signal phase with SL-Mz.
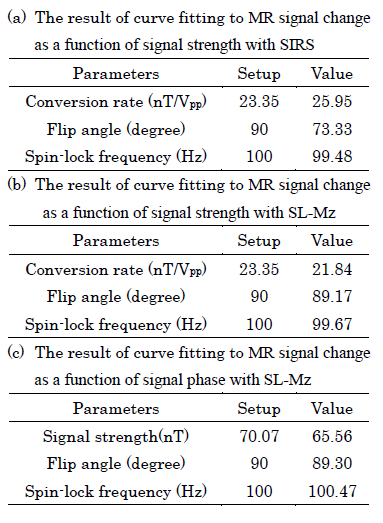
Table
1. The estimated parameters