3960
Cohesive parcellation of rsfMRI using constrained hierarchical clustering1Imaging Sciences, Cleveland Clinic, Cleveland, OH, United States
Synopsis
Most connectivity-based parcellations of rsfMRI are synthesized from the dense connectome. However, the mean parcel signal is typically used for data reduction prior to network analysis. This results in representative parcel time series that are poorly correlated to their member voxels (poor parcel cohesion). We propose an adjacency-constrained, agglomerative hierarchical clustering framework that uses parcel cohesion as a linkage criteria. This results in parcels with mean time series that are significantly more representative of their member voxels. This parcellation is easily interpretable and well-suited for downstream analyses.
Introduction
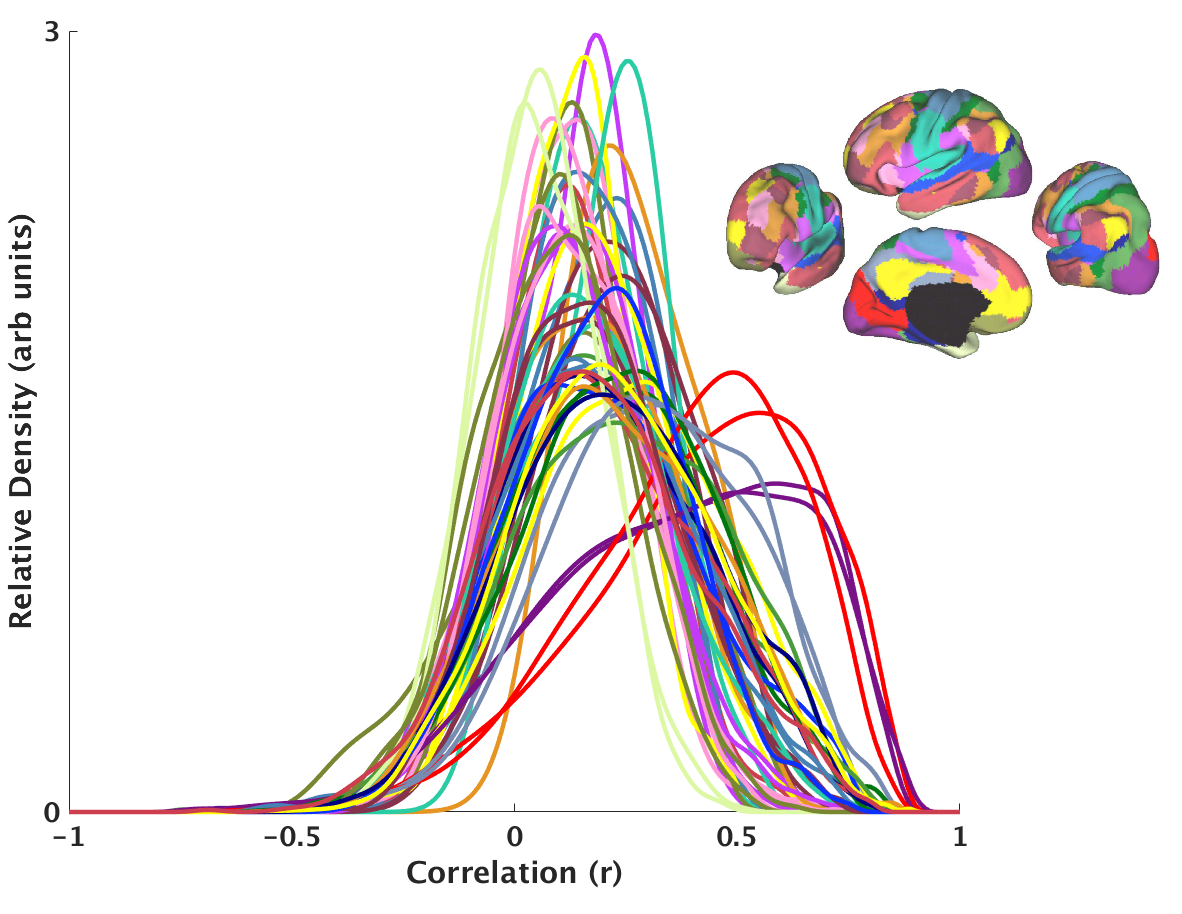
The data burden for rsfMRI analysis rises exponentially with increasing resolutions available at ultrahigh field MRI. Therefore, a fundamental preprocessing step in brain network analysis is to spatially subdivide the data, treating each parcel of voxels as a separate node in the network1. Most parcellation methods based on rsfMRI connectivity are synthesized from the dense connectome2, including Gaussian mixture models, k-means, hierarchical clustering, spectral clustering, and gradient-based approaches. However, most network analyses begin by reducing each parcel to a single time series, typically with a simple mean across voxels3. This asymmetry between how parcels are formed and how they are used assumes that the parcel time series adequately represents its member voxels. This is not the case in commonly employed parcellation methodologies4. Figure 1 shows the histrograms of temporal correlation of the all voxel-level timeseries to the “representative” parcel timeseries for a commonly used functional parcellation5. It is evident that most of the voxels in this parcellation are poorly correlated to their representative signals. We propose to parcellate the brain based on optimizing this representative parcel time series, thus ensuring that the way parcels are synthesized corresponds to the way they are used in subsequent network analysis.Methods
Task-free fMRI was performed on five healthy adults with a Siemens Magnetom 7T (Siemens Medical Solutions, Erlangen, Germany) using a 32-channel receive/single channel transmit coil (Nova Medical, MA, USA). Whole brain rsfMRI data were acquired using multi-band EPI with 81 contiguous 1.5 mm thick axial slices (MB factor = 3, TE/TR = 21/2800 ms, 128 volumes, 70° flip, 1602 matrix, 192 mm2 FOV, in-plane resolution = 1.2 mm2). High resolution T1 weighted images were also acquired for anatomical context. rsfMRI data were brain extracted and corrected for motion, slice timing, and physiologically based nuisances6-7. Anatomical data were segmented and aligned to the rsfMRI data, and all gray matter voxels were extracted for parcellation. A parcel time series is the mean of its member voxel time series. We define parcel cohesion as the mean of the correlations between this parcel time series and its member voxels. Parcel cohesion represents a monothetic statistic starting at 1 (each voxel is a parcel) that falls as parcels are merged together, reaching a minimum when all voxels belong to a single parcel. This cohesion is used as a linkage criterion in an adjacency-constrained, agglomerative hierarchical clustering framework. Parcels were created by cutting the hierarchical tree at a parcel cohesion threshold of 0.5. To facilitate agglomeration under an adjacency constraint, all gray matter voxels were separated into four major segments (right cortex, left cortex, right subcortex, left subcortex) before clustering.Results
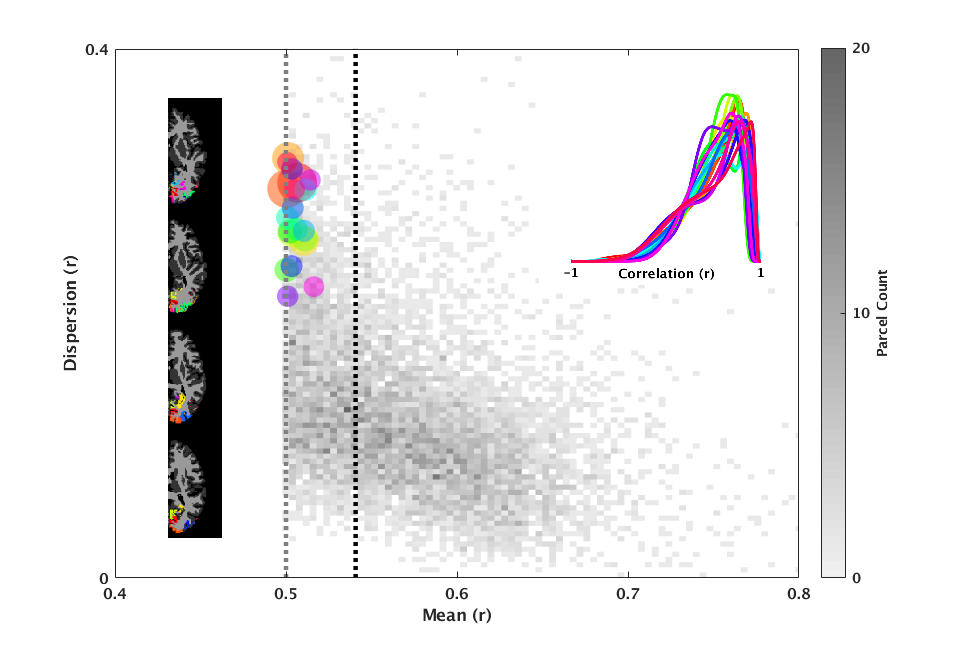
Figure 2 shows the distribution of parcel cohesion using the proposed clustering framework for the left cortex of a representative subject. 8458 parcels were created from 100,451 voxel time series, leading to an 11.9-fold reduction in the data. The size-weighted mean of parcel cohesion was 0.54 (black dotted line), and all parcels had a cohesion greater than 0.5 (grey dotted line). The largest 20 parcels are highlighted in color and shown in the left inset, while their intra-parcel histograms (similar to Figure 1) are shown in the right inset. Over all subjects and all grey matter segments, there was a 12.1 +/- 0.4-fold reduction of the data with size-weighted mean parcel cohesion of 0.55 +/- 0.19. The largest parcels are located in the visual processing areas, including the calcarine sulcus, cuneus, and lingual gyrus.Discussion
We present a data parcellation methodology that requires both spatial adjacency of all voxels within a parcel and a requirement of intra-parcel temporal correlation of all voxels. The resulting parcels’ timeseries thus are representative of all underlying voxels, unlike all current parcellation methods. Our cohesion-based parcellation significantly reduces the data burden, however not to the extent of previously published connectivity-based parcellations. The parcels resulting from our method cover a wide range of sizes and spatial distributions, with the largest parcels occurring near the occipital pole.Conclusion
The proposed cohesion-based parcellation framework significantly reduces the data burden for subsequent rsfMRI connectivity and network analysis. The resulting parcels generate time series that are internally coherent with their members. This represents an easily understood standard for downstream interpretation of any analysis based on these parcels. The granular distribution of cohesion-based parcels form an ideal basis for many downstream analyses including connectivity fingerprinting, independent components analysis, and measures of regional homogeneity8. The wide range of parcel sizes and their spatial distribution deserves further exploration. Further comparison to existing parcellation frameworks is also required.Acknowledgements
This work was supported by the Imaging Institute, Cleveland Clinic.
Authors acknowledge technical support by Siemens Medical Solutions.
References
1. Thirion B, et al. Which fMRI clustering gives good brain parcellations? Front Neurosci. 2014;167:1-13.
2. Eickhoff S, et al. Conectivity-based parcellation: critiques and implications. Hum Brain Mapp. 2015;36(12):5771-92.
3. Power J, et al. Functional network organization of the human brain. Neuron. 2011;72(4):665-78.
4. Arslan S, et al. Human brain mapping: a systematic comparison of parcellation methods for the human cerebral cortex. NeuroImage. 2018;170:5-30.
5. Yeo BT, et al. The organization of the human cerebral cortex estimated by intrinsic functional connectivity. J Neurophysiol. 2011;106(3):1125-65.
6. Beall E and Lowe M. SimPACE: generating simulated motion corrupted BOLD data with synthetic-navigated acquisition for the development and evaluation of SLOMOCO: a new, highly effective slicewise motion correction. NeuroImage. 2014;101:21-34.
7. Beall E. Adaptive cyclic physiologic noise modeling and correction in functional MRI. 2010;187(2):216-28.
8. Blumensath T, et al. Spatially constrained hierarchical parcellation of the brain with resting-state fMRI. NeuroImage. 2013;76:313-24.
Figures