3956
An optimized pipeline for functional network identification in rat brain with resting-state fMRI1Ecole Polytechnique Fédérale de Lausanne, Lausanne, Switzerland
Synopsis
Resting state fMRI (rs-fMRI) is a widely used technique for identifying resting state networks (RSNs) and investigating brain disorders. However, the characterization of RSNs can be seriously hindered by the presence of random and structural noise in the measured fMRI signal. Most tools that correct for these effects are tailored for human brain and are not readily transposable to rat data. Here we propose a data processing pipeline for rat rs-fMRI data which can robustly remove artefacts and clean the rs-fMRI data. We report the performance of the pipeline for analyzing rat RSNs and discriminating between control and disease groups.
Introduction
Resting state functional MRI (rs-fMRI) has been a widespread and powerful tool for investigating functional connectivity (FC) and brain disorders. Functional connectivity is evaluated by measuring the temporal correlation of rs-fMRI time courses between different brain regions1.However, functional connectivity analysis can be seriously influenced by artefacts because rs-fMRI signal is very sensitive to the presence of structural noise from non-neural sources such as field inhomogeneity, motion, cardiac and respiratory cycles2. In addition, random (thermal) noise confounds the identification of structured components, be they functional signal or artefactual. Therefore, it is essential to first reduce thermal noise and then correctly identify and remove non-neural artefacts from rs-fMRI signals through proper data processing methods. Furthermore, existing tools that correct for these effects are tailored for human brain and are not readily transposable to rat data.
Here, we established a data processing pipeline that can robustly remove random and structured noise from rat rs-fMRI data. We show that: I) denoising based on Marchenko-Pastur PCA (MPPCA)3, initially introduced to diffusion MRI, can be applied to rs-fMRI data; II) FMRIB’s ICA-based Xnoiseifier (FIX)4 which has been widely applied to human datasets for automatic artefact classification and data cleaning can be applied to rat data. We trained and provide a new FIX classifier for rat. The pipeline is tested on control rats and on a rat model of sporadic Alzheimer’s disease.
Methods
All experiments were approved by the local Service for Veterinary Affairs. Male Wistar rats (N=17) (236±11 g) underwent a bilateral icv-injection of either streptozotocin (3 mg/kg, STZ group, N=9) or buffer (control group, N=8). Rats were scanned at four timepoints (2, 6, 13 and 21 weeks) following surgery, on a 14T Varian system. Briefly, rats were anesthetized using isoflurane for initial setup and promptly switched to medetomidine sedation (bolus: 0.1mg/kg, perfusion: 0.1mg/kg/h), which preserves neural activity and vascular response better than isoflurane. Resting-state fMRI data were acquired using a two-shot gradient-echo EPI sequence as follows: TE/TR=10/800ms; Matrix: 64x64; FOV: 23x23mm2; 8 1.12-mm slices; 370 repetitions (TA=10’). 112 rs-fMRI datasets were acquired.The data processing pipeline (Fig.1) incorporated brain masking, MPPCA-denoising, distortion correction5, slice-timing correction, spatial smoothing6(Gaussian kernel: 0.36x0.36x1mm3), image registration to a rat brain atlas with 28 atlas-defined ROIs automatically segmented and independent component analysis (ICA) with high-pass temporal filtering (f>0.01Hz) and 40 independent components (IC’s). IC’s were manually sorted between signal and artefact on 40 datasets to train a rat FIX classifier. All datasets were then run through the classifier and artefactual IC’s removed from the data. Then, “cleaned” fMRI data were used to compute individual functional connectivity matrices by calculating partial correlation with global signal as the control variable7 between 28 ROIs.
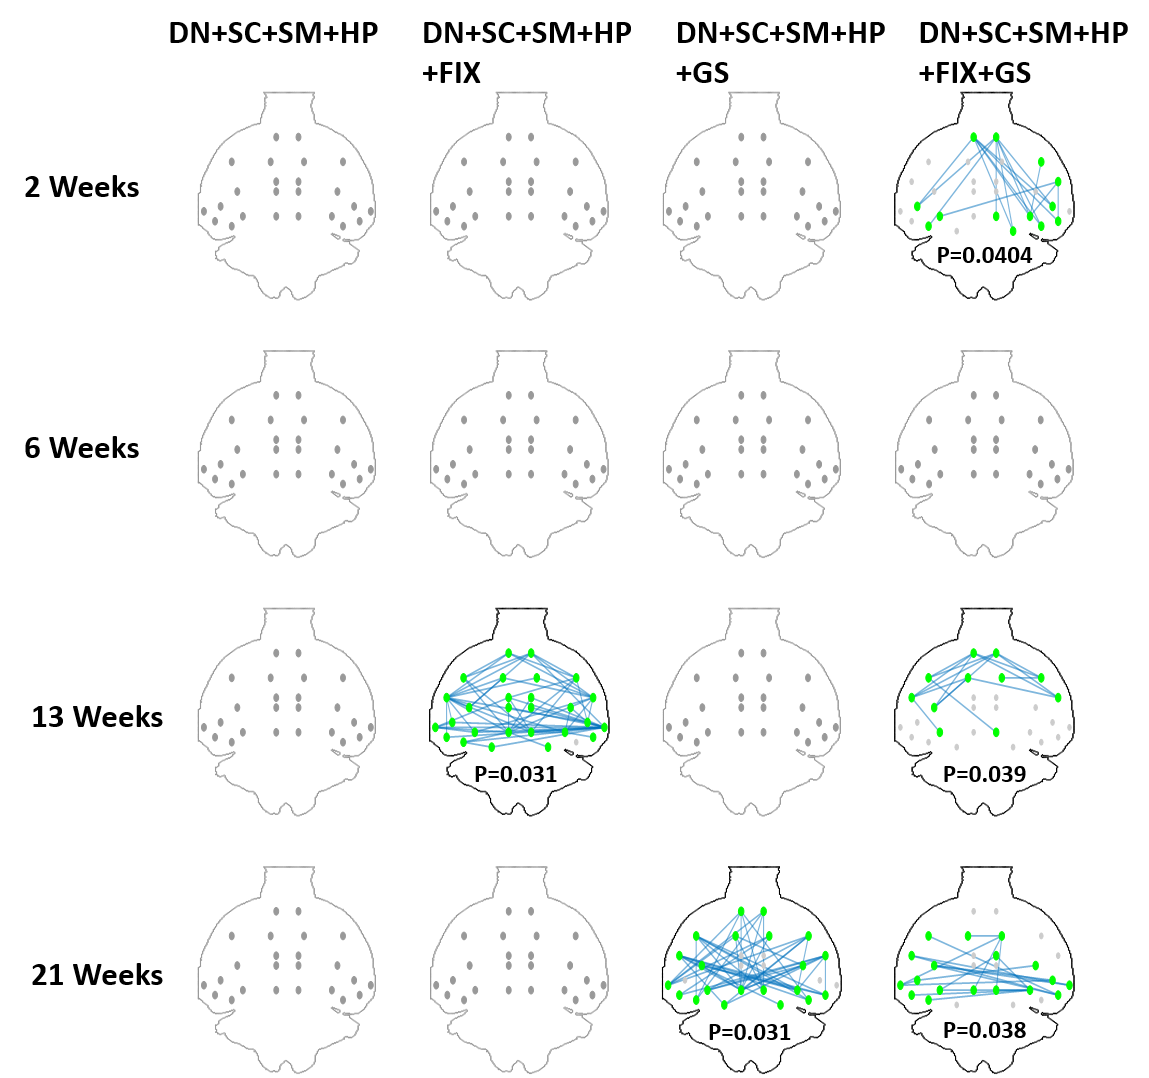
STZ - CTL group difference test in functional connectivity at each timepoint were performed using Network Based Statistic (NBS) Toolbox8.
The effect of excluding FIX-ICA and/or partial correlation from our optimized pipeline was assessed in terms of standard deviation of functional connectivity matrices in healthy CTL group and in terms of significant group differences at each timepoint.
Results and Discussion
The temporal signal-to-noise ratio (tSNR)9 after MPPCA-denoising was improved by 55% on average.Compared to manual classification, FIX auto-classification generated very similar results, with 93% recall and 95% precision on average (Fig.2).
Four different data processing pipelines were evaluated in terms of intra-group standard deviation of Z-transformed correlation matrices in the CTL group (Fig.3), and inter-group (CTL vs STZ) significant difference in functional connectivity (Fig.4) at each timepoint. Our proposed pipeline (DN+SC+SM+HP+FIX+GS) obtained the minimal intra-group variability in the healthy control group while other procedures excluding FIX and/or GS have higher variability, and it also yielded the most meaningful and consistent inter-group differences consistent with previous reports of acute impairment (2 weeks), transient recovery (6 weeks) and chronic degeneration (13 weeks on) in terms of memory performance10.
Conclusions
We proposed a new data processing pipeline for rat rs-fMRI data which includes denoising, an ICA auto-classifier to remove structured noise, and controlling for the global signal. MPPCA-denoising improved the tSNR substantially. A new FIX ICA classifier was built for rat rs-fMRI data which can be readily shared.Importantly, we show that FIX ICA cleaning and co-varying for the global signal each play a critical role in minimizing the intra-group variability and in detecting inter-group differences.
This rat rs-fMRI processing pipeline will be publicly available shortly and will hopefully improve the sensitivity and reproducibility of rs-fMRI studies on rat models of disease and injury.
Acknowledgements
The authors thank Mario Lepore, Stefan Mitrea and Analina da Silva for assistance with animal setup and monitoring. This work was supported by the Centre d'Imagerie BioMedicale (CIBM) of the University of Lausanne, the Swiss Federal Institute of Technology Lausanne, the University of Geneva, the Centre Hospitalier Universitaire Vaudois and the Hôpitaux Universitaires de Genève.References
1. Biswal, B., Yetkin, F. Z., Haughton, V. M. & Hyde, J. S. Functional connectivity in the motor cortex of resting human brain using echo-planar MRI. Magn. Reson. Med. 34, 537–541 (1995).
2. Birn, R. M. The role of physiological noise in resting-state functional connectivity. NeuroImage 62, 864–870 (2012).
3. Veraart, J. et al. Denoising of diffusion MRI using random matrix theory. NeuroImage 142, 394–406 (2016).
4. Salimi-Khorshidi, G. et al. Automatic denoising of functional MRI data: Combining independent component analysis and hierarchical fusion of classifiers. NeuroImage 90, 449–468 (2014).
5. Smith, S. M. et al. Advances in functional and structural MR image analysis and implementation as FSL. NeuroImage 23 Suppl 1, S208-219 (2004).
6. Beckmann, C. F. & Smith, S. M. Probabilistic independent component analysis for functional magnetic resonance imaging. IEEE Trans. Med. Imaging 23, 137–152 (2004).
7. Smith, S. M. et al. Network modelling methods for FMRI. NeuroImage 54, 875–891 (2011). 8. Zalesky, A., Fornito, A. & Bullmore, E. T. Network-based statistic: Identifying differences in brain networks. NeuroImage 53, 1197–1207 (2010).
9. Reynaud, O., da Silva, A. R., Gruetter, R. & Jelescu, I. O. Multi-slice passband bSSFP for human and rodent fMRI at ultra-high field. J. Magn. Reson. 305, 31–40 (2019).
10. Knezovic, A. et al. Staging of cognitive deficits and neuropathological and ultrastructural changes in streptozotocin-induced rat model of Alzheimer’s disease. J. Neural Transm. Vienna Austria 1996 122, 577–592 (2015).
Figures
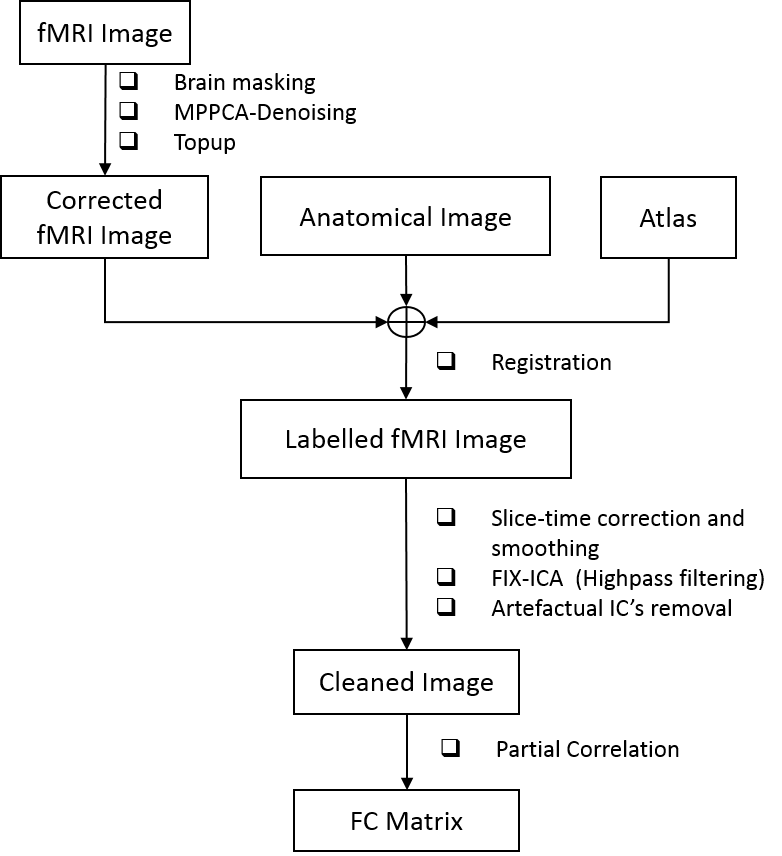
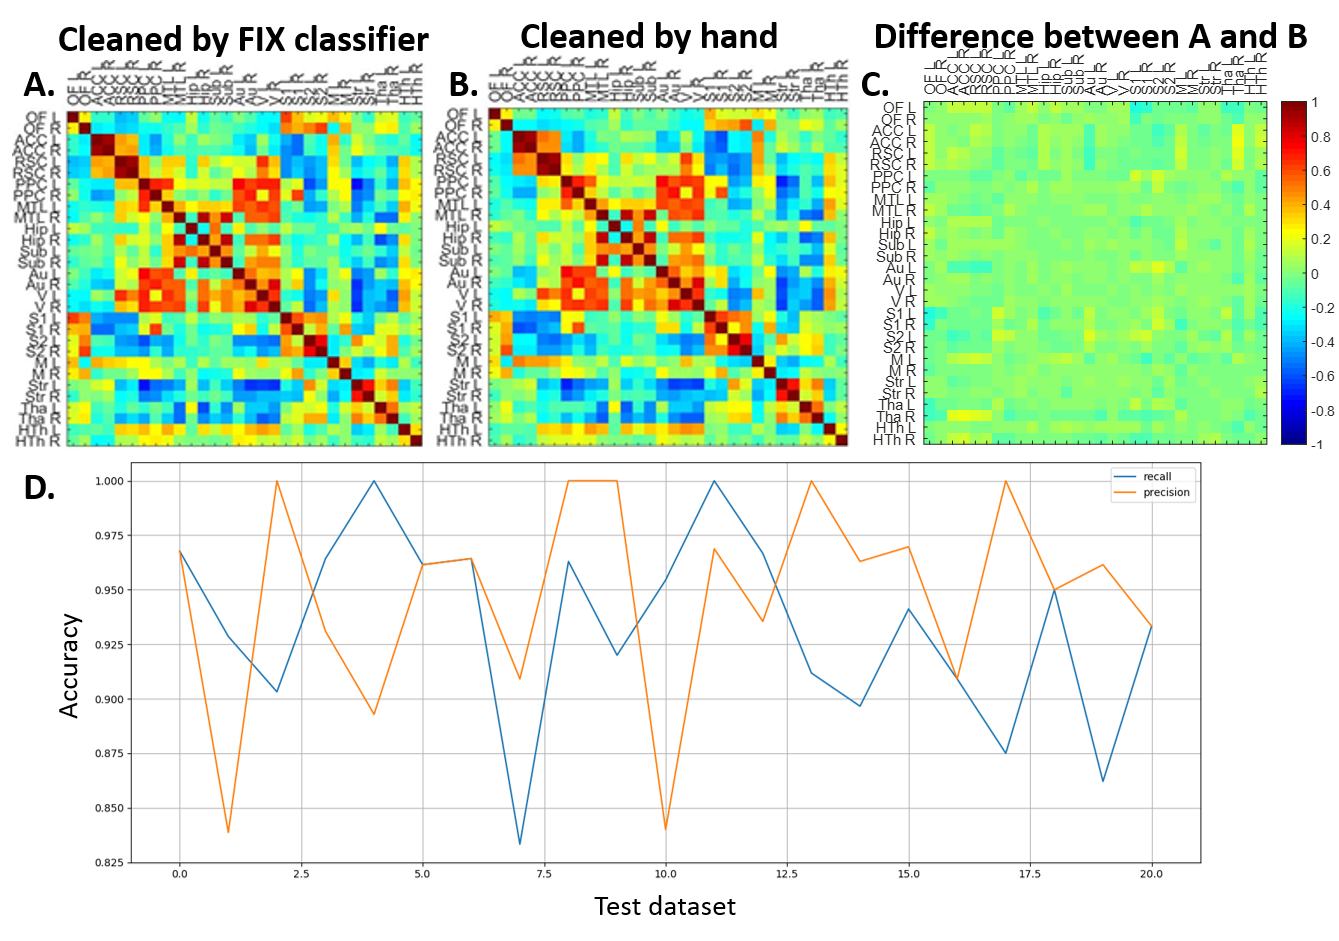
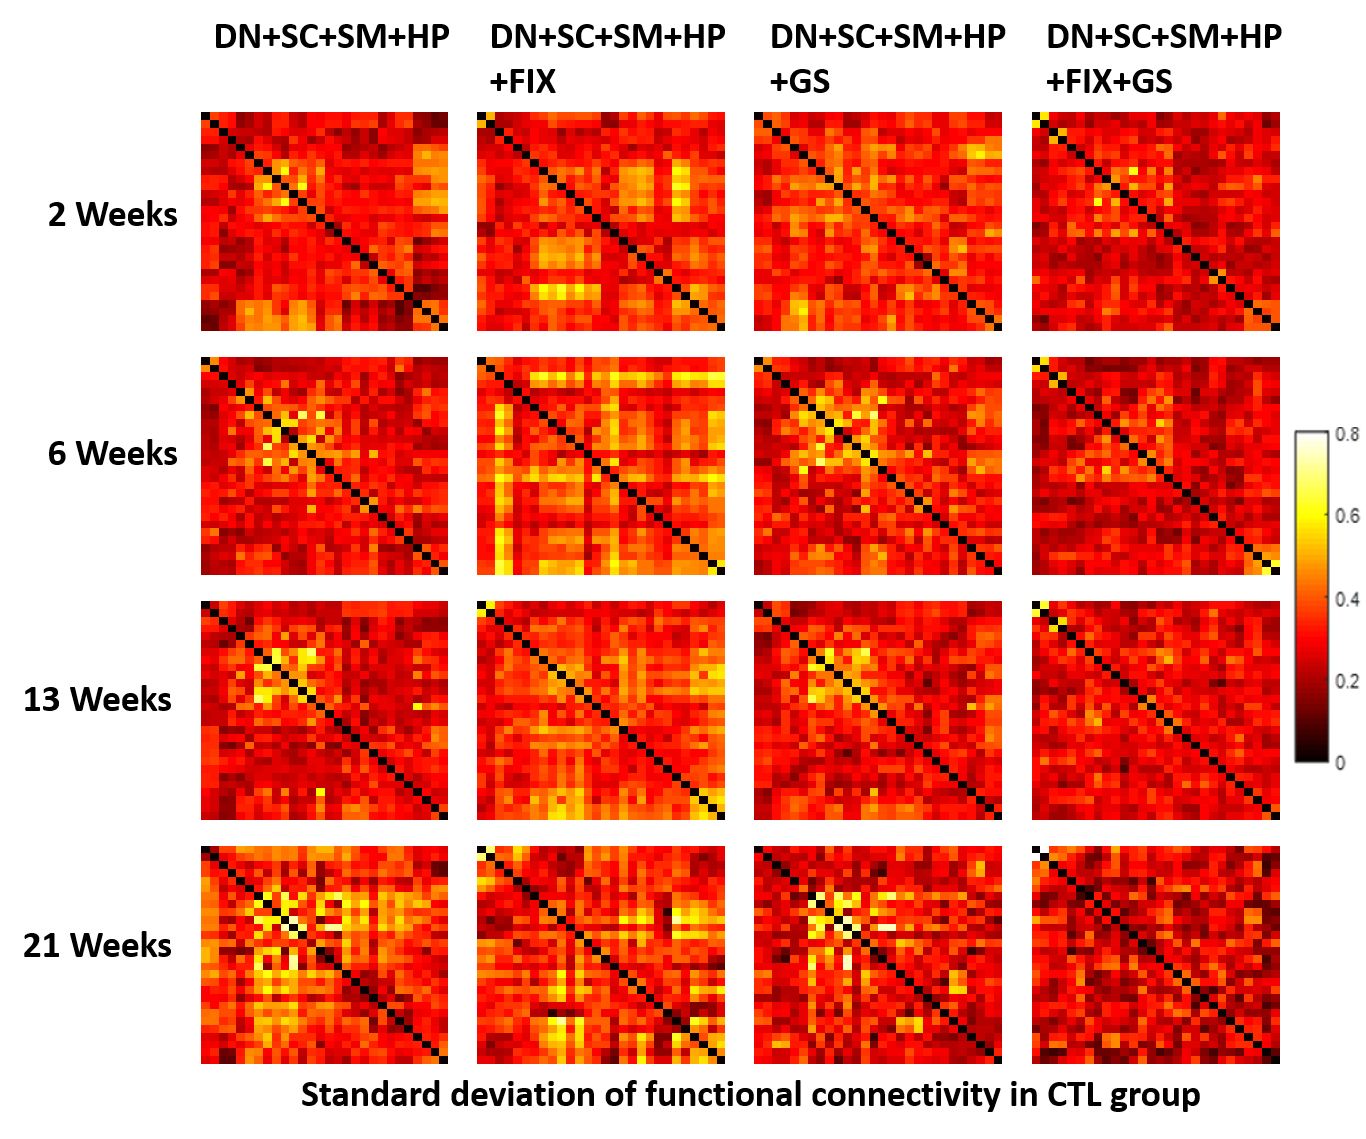
Figure 3. Standard deviation of Z-transformed correlation matrices at 4 time points (2, 6, 13, 21 weeks) with N=16, 13, 12, 6 respectively in the healthy control group for different data processing pipelines. Our proposed pipeline which is DN+SC+SM+HP+FIX+GS achieved the minimal standard deviation for all time points in control group. DN – MPPCA denoising, SC – slice-timing correction, SM – spatial smoothing, HP – highpass filtering, FIX – FIX ICA cleaning, GS – partial correlation with global mean signal as the control variable