3955
Effect of Eyeblink Conditioning on Intrinsic Brain Connectivity in Awake Rabbits: a resting-state fMRI study
Nicola Bertolino1, Daniele Procissi1, John F Disterhoft2, and Craig Weiss2
1Radiology, Northwestern University, Chicago, IL, United States, 2Physiology, Northwestern University, Chicago, IL, United States
1Radiology, Northwestern University, Chicago, IL, United States, 2Physiology, Northwestern University, Chicago, IL, United States
Synopsis
Functional brain plasticity is an important characteristic of the brain and enables an individual to learn and adapt as a result of life experiences. In this study we investigated the reorganization of functional brain networks after eyeblink conditioning in awake rabbits by resting state fMRI. This work builds the foundation for studying pre-clinically how cognitive impairment affects learning processes, its implication on brain capability to adapt and learn, and the possible impact of new therapies.
Introduction
Structural and functional plasticity are very important characteristics, which allow the brain to remodel because of life experiences or traumas [1,2]. In this study we showed how functional brain plasticity can be investigated pre-clinically in a non-invasive way, using awake rs-fMRI in animals. We studied the reorganization of brain functional connectivity at rest a few days after eyeblink conditioning in a group of rabbits, which proved to be particularly suitable for awake imaging [3]. Eyeblink conditioning involves a wide network of brain areas involving memory mechanisms [4]. The ability to follow their functional changes longitudinally and eventually correlate them with cognitive impairment would be a powerful research tool in the field of neurodegenerative diseases.Methods
AnimalsAll experimental procedures involving animals complied with Northwestern’s IACUC guidelines. One batch of 10 rabbits underwent the imaging protocol before conditioning and again between 3 to 7 days after a 15 day period of eyeblink conditioning.
MRI Acquisition
Acquisitions were performed on 7T ClinScan MRI scanner (Bruker, Germany). The experimental setup was described in Bertolino et al. 2019 [5]. The acquisition protocol included a coronal 3D-GRE multi-echo scan (TR=68ms; Echos=2.7,6.83,11.26,16,10.13,25ms; Flip Angle=15; voxel size=0.29x0.29x0.5mm3; FOV=29.6x55.6x24mm3) and a transverse EPI (TR=1800ms; TE=25; Flip Angle=70; voxel size=0.65x0.65mm2; slice thickness=1.5mm; number of slices=20; matrix=52x68; GRAPPA=2; echo spacing=0.25ms; volumes=500). The rs-fMRI EPI sequence was repeated twice.
Analysis
Data analysis was performed using FMRIB Software Library version 6.0 (Analysis Group, FMRIB, Oxford, UK), FSLNets 0.6 and MatLab R2017a (The Mathworks Inc). We performed t-tests on the daily percentage of conditioned blinks to assess differences within the rabbits’ groups (before/after conditioning and best/worst learners). A high-resolution 3D image of each brain was generated from the 5 echos average. The 3D images from each rabbit were co-registered (non-rigid 12 degree-of-freedom transformation) and averaged to generate a rabbit brain template. For the resting state analysis, EPIs were first pre-processed: i)all volumes were registered by a rigid transformation to the central volume and motion regressors were removed from the data to limit effect of motion artifacts, ii)a brain mask was generated starting from the bias field corrected mean of the volumes and used as an inclusive mask for EPI, iii)a common origin was selected for all subjects’ EPIs, iv)time course was high-pass filtered with a threshold of 0.02 Hz and vi)images were smoothed using a 0.7 mm gaussian kernel. Visual inspection of EPI volumes and motion correction reports enabled overall quality control of data and the best of the two fMRI acquisitions for each rabbit was selected. Functional volumes were registered to high-resolution 3D images and then to the common template before ICA. ICA group-analysis was run using a multi-session temporal concatenation pre-selecting 30 desired components, then the output was inspected to identify resting state and spurious components. Using dual-regression analysis [6] (corrected for multiple comparison using 5000 permutations) on the 30 ICs spatial maps we tested functional connectivity differences of the data set before and after training and between rabbits identified as the best or worst learners. A network analysis was performed on time courses extracted from stage 1 output of dual regression analysis to assess correlations among the resting state components across all subjects. For each rabbit a matrix of Pearson correlation coefficients was calculated, transformed using Fisher z-transform and a cross-subject GLM analysis was performed on them to explore differences in each node between groups (5000 permutations multicomparison correction). A one sample t-test was also run on correlation matrices within each group and adjacency matrices and subsequently graphs were generated using a puncorrected<0.05 threshold.
Results
The percentage of conditioned responses was significantly higher (p<0.05) at the end of conditioning (last 5 days) compared to the beginning (first 5 days) (fig.1a). We also identified 5 rabbits with significantly better performance (p<0.05) at the end of conditioning(fig.1b). Among the 30 ICs we identified 10 functional brain components(fig.2). Dual regression analysis showed significant difference (pcorrected<0.05) comparing rabbits’ group before and after learning in the cingulate cortex, retrosplenial cortex and thalamus(fig.3). Analysis of correlation matrices showed a significant difference (pcorrected<0.05) in the retrosplenial/cingulate and motor/retrosplenial nodes before and after conditioning (fig.4 a,b,c). A visual inspection of the correlation matrices and graphs shows a connected network with a larger number of edges for the group of animals after the conditioning process as compared to the same group before conditioning showing fewer edges and 3 isolated nodes(fig.5a). Less obvious differences are also observed between the 5 best learners as compared to the other rabbits(fig.5b).Conclusions
We detected brain functional network reorganization resulting from eyeblink conditioning in a rabbit awake rs-fMRI study. Interestingly the network nodes including cingulate cortex, retrosplenial cortex and thalamus that we found to be involved in the functional reorganization process are also described in the literature as being affected by multiple neurodegenerative diseases [7]. The method described is a powerful and non-invasive tool to study changes in brain functionality as a result of learning in a controlled environment. It could be employed to investigate how different neurodegenerative processes can affect those changes, and potentially to provide useful insights on early cognitive impairment caused by different neuropathologies and the effect of new therapies on them.Acknowledgements
Research reported in this abstract was supported by the National Institutes of Health, Grant Number R56AG050492 and NUCATs UL1TR001422.References
- Maguire, Eleanor A., Katherine Woollett, and Hugo J. Spiers. "London taxi drivers and bus drivers: a structural MRI and neuropsychological analysis." Hippocampus 16, no. 12 (2006): 1091-1101.
- Nasrallah, Fatima A., Xuan Vinh To, Der-Yow Chen, Aryeh Routtenberg, and Kai-Hsiang Chuang. "Functional connectivity MRI tracks memory networks after maze learning in rodents." Neuroimage 127 (2016): 196-202.
- Schroeder, Matthew P., Craig Weiss, Daniel Procissi, John F. Disterhoft, and Lei Wang. "Intrinsic connectivity of neural networks in the awake rabbit." Neuroimage 129 (2016): 260-267.
- Weiss, Craig, and John F. Disterhoft. "Exploring prefrontal cortical memory mechanisms with eyeblink conditioning." Behavioral neuroscience 125, no. 3 (2011): 318.
- Nicola Bertolino, Daniele Procissi, Craig Weiss, Quinn C Smith, and John F Disterhoft. “Advanced Experimental setup for awake resting-state fMRI in rabbits”. ISMRM 27th Annual Meeting, Montreal, QC, Canada (2019). Poster number 3195.
- Erhardt, Erik Barry, Srinivas Rachakonda, Edward J. Bedrick, Elena A. Allen, Tülay Adali, and Vince D. Calhoun. "Comparison of multi‐subject ICA methods for analysis of fMRI data." Human brain mapping 32, no. 12 (2011): 2075-2095.
- Agosta, Federica, Sebastiano Galantucci, and Massimo Filippi. "Advanced magnetic resonance imaging of neurodegenerative diseases." Neurological Sciences 38, no. 1 (2017): 41-51.
Figures
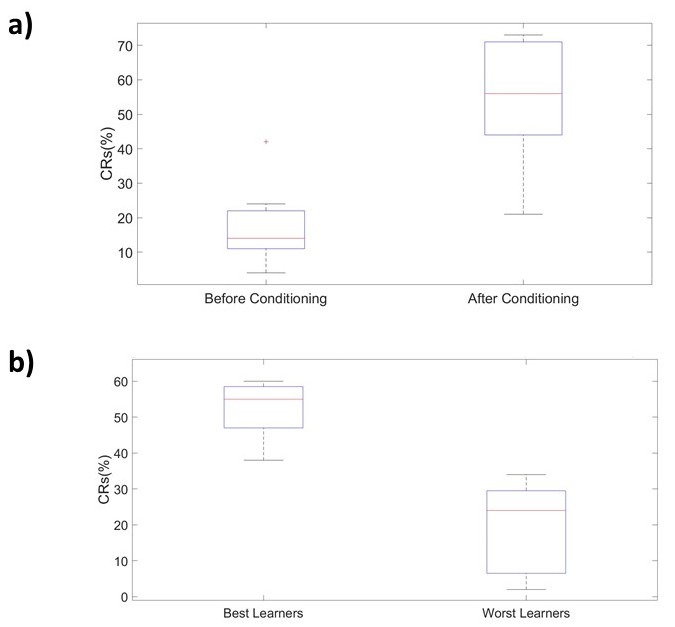
FIG.1: The
plots shows the results of behavioral data analysis. In panel a) it is shown
the box plot of the percentage of conditioned responses averaged over the first
5 days of training (Before Conditioning) and over the last 5 days of training
(After Conditioning). A red cross
represents data outside the one standard deviation. In panel b) it is shown the
box plot of the percentage of conditioned responses averaged over the last 5
days for the 5 best Learners and the 5 worst learners.
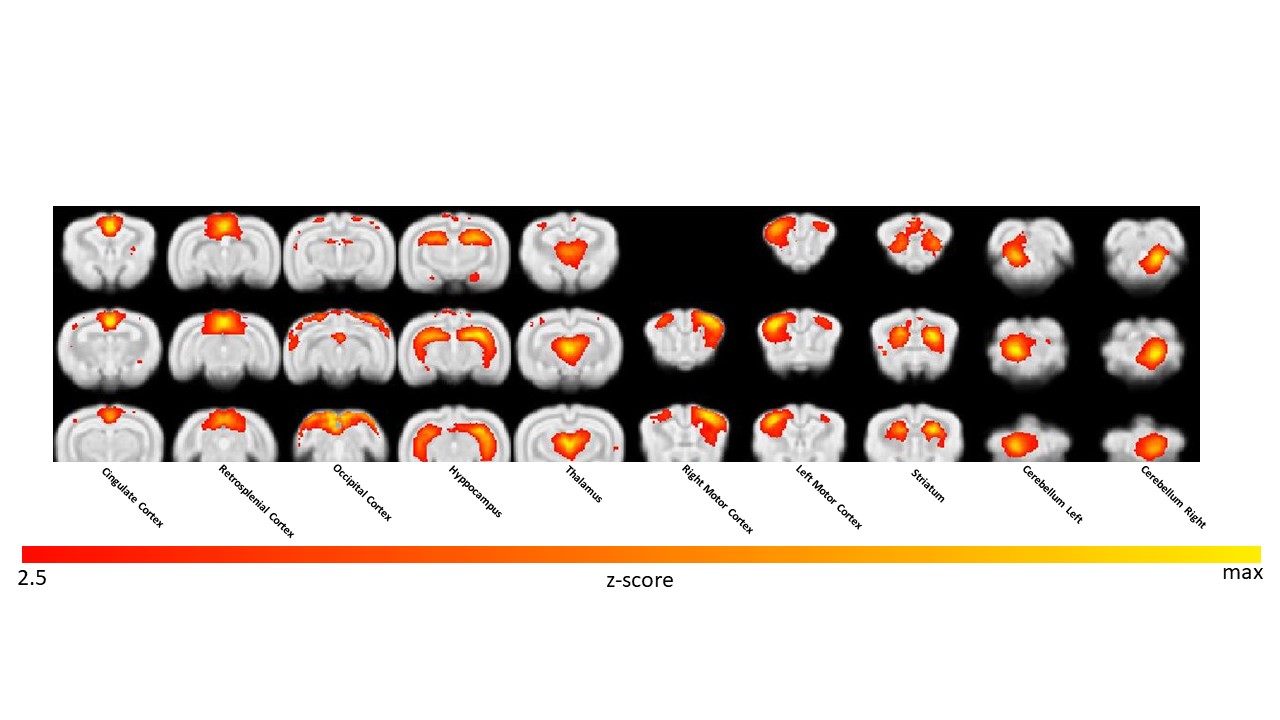
FIG.2: The
10 functional components maps identified from the ICA analysis output.
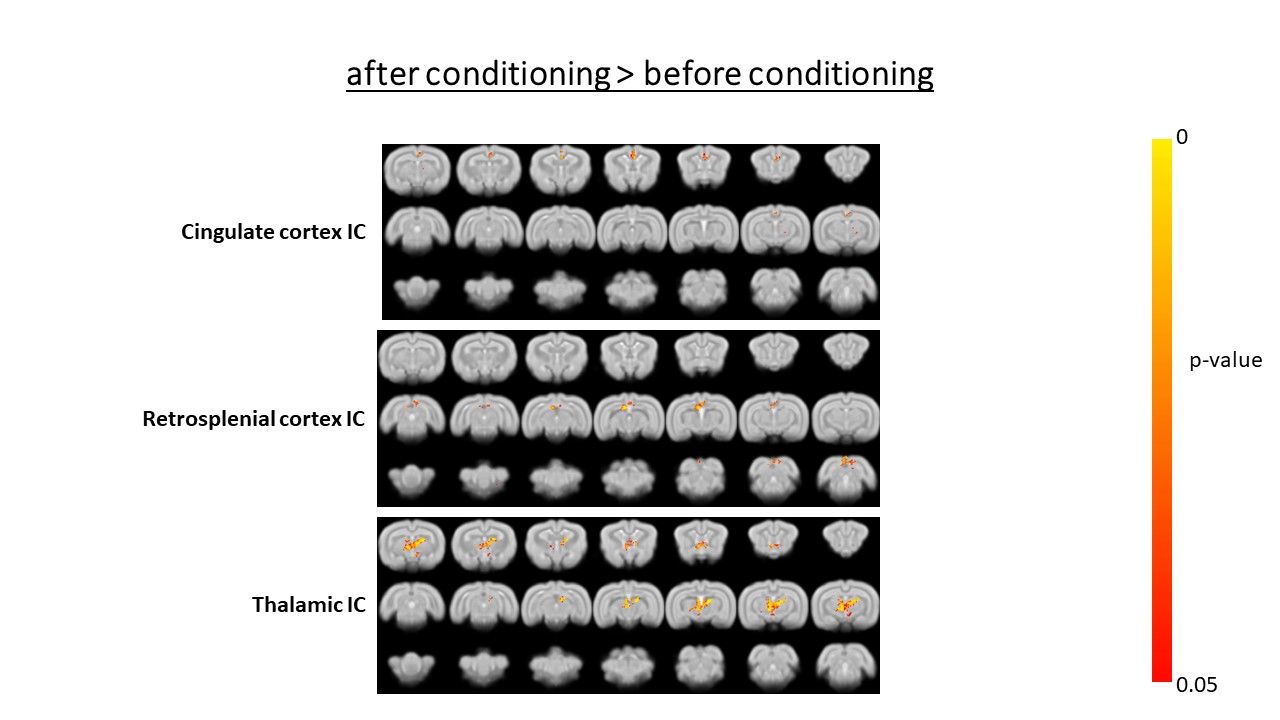
FIG.3: Groups
differences found by dual regression analysis in the contrast after
conditioning – before conditioning. The p-value is corrected for
multicomparisons (5000 permutations).
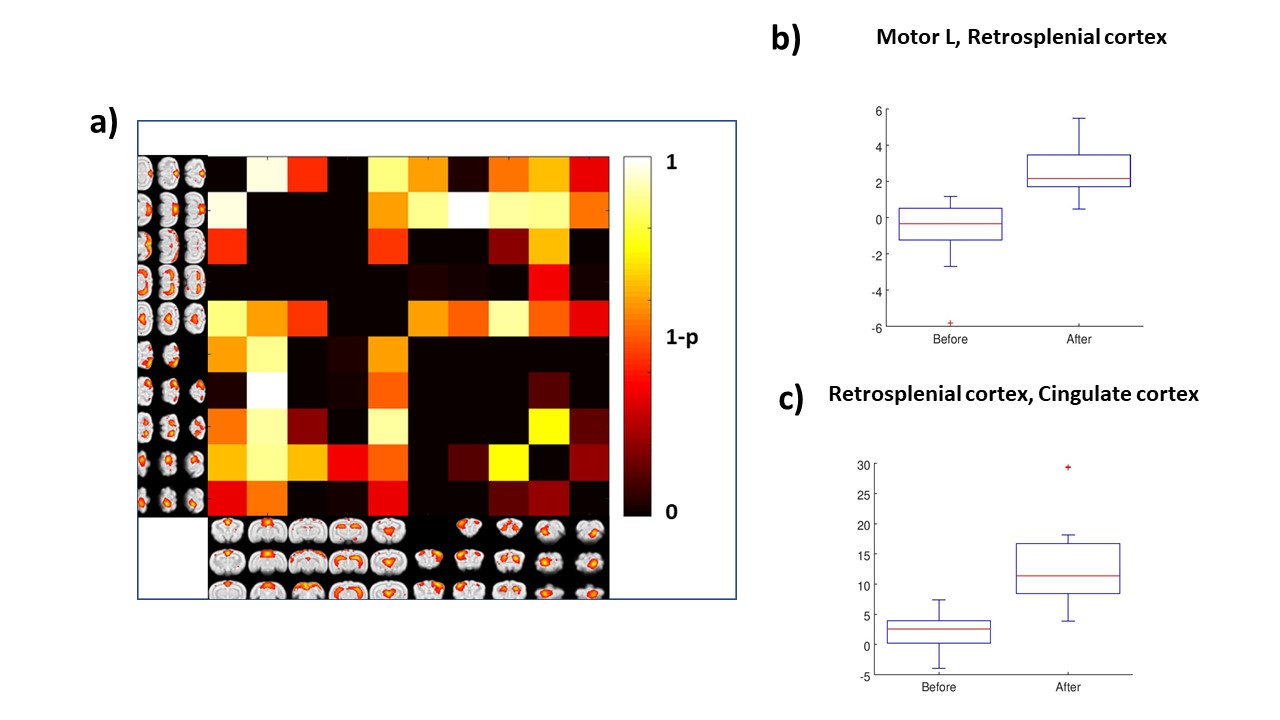
FIG.4: The
matrix in panel a) shows the results from t-test run on the correlation
matrices (for each node) comparing the rabbits after and before conditioning.
The box plot in panel b) and c) shows the z-scores of the two nodes that were significantly different (p<0.05) between the two conditions (after and before
conditioning).

FIG.5: Correlation
matrices obtained from one sample t-test; graphs were obtained after thresholding the
matrices (p <0.05). Panel a) refers to the networks of the data set before and after conditioning. Panel b) shows the matrices and graphs related
to the 5 best learners and the 5 worst learners after conditioning.