3951
Role of the combination of T2 values and edema volume as a biomarker in evaluating the neuroprotective effect of LITUS to moderate TBI with rat model
Du Juan1, Zheng Tao1, Yuan Yi2, Wang Zhanqiu1, Liu Defeng1, Shi Qinglei3, Wu Shuo1, Wang Xiaohan1, and Liu Lanxiang1
1MRI, Qinhuangdao Municipal No. 1 Hospital, Qinhuangdao, China, 2Institute of Electrical Engineering, Yanshan University, Qinhuangdao, China, 3Siemens Healthcare, MR Scientific Marketing, Beijing, China
1MRI, Qinhuangdao Municipal No. 1 Hospital, Qinhuangdao, China, 2Institute of Electrical Engineering, Yanshan University, Qinhuangdao, China, 3Siemens Healthcare, MR Scientific Marketing, Beijing, China
Synopsis
In this study, we verified the feasibility of T2 values combined with edema volume changes in evaluating the neuro therapeutic effect of low-intensity transcranial ultrasound stimulation (LITUS) on post-traumatic brain edema with rat model. The neuro therapeutic effect of LITUS was attributed to inhibiting the expression of AQP4 and promoting the removal of β-APP.
Objective:
This study aimintends to use magnetic resonance 3D-T2WI and multi-TE turbo spin echo (TSE)T2WI sequences to measure the edema volume and T2 values of damaged brain tissue, and to evaluate the feasibility of T2 values combined with edema volume changes in evaluating the neuro therapeutic effect the effect of low-intensity transcranial ultrasound stimulation (LITUS) on post-traumatic brain edema, and explore the possible mechanism of LITUS therapeutic effect on brain edema from the perspective of macroscopic imaging, supplemented by and protein molecular measurement, to preliminarily explore the possible mechanism of its treatment.Materials and Methods:
Forty-five male Sprague Dawley rats (normal control: 15, TBI: 15, LITUS treatment: 15, mean age: 3 months; range, 1-4 months) were enrolled and underwent MR imaging on a MAGNETOM Verio 3T MR scanner (Siemens Healthcare, Erlangen, Germany). Scanning Scanning layers were aligned parallel to the anterior/posterior line and acquired using a multi-TE turbo spin echo (TSE) sequence with the following settings: TR=2000 ms, TE= (64/96/181) ms,flip angle = 150°, average = 6, FOV=80 × 80 mm, voxel size = 0.3 × 0.3 × 0.3 mm, data matrix=192 × 192, slice thickness = 2.0 mm, number of slices = 96 (total scanning time=8 min 18 s). The T2 maps were calculated on Evaluation tool of Siemens post-processing workstation (Siemens Verio 3.0T MR Leonardo 3682) was used for post-processing of multi-TE T2WI, and the whole-brain T2 map was calculated. ROIs range of 0.30-0.60cm2 were manually delineated to measure the T2 values of brain tissue The ROI range of 0.30-0.60cm2 was manually selected in the center of the damaged cortex to measure the T2 value of brain tissue, and . the edema volumes were measured through manually delineating on the 3D-T2WI images layer by layer for the TBI group and LITUS treated group with an open-source software ITK-SNAP software (Version 3.6.0) was applied to manually delineate the cerebral edema range of TBI group and LITUS treatment group on 3D-T2WI layer by layer, and the edema volume was automatically obtained after the delineation. The results were analyzed using a two-way analysis of variance (ANOVA) for repeated measures, followed by Tukey’s post hoc test. A P < 0.05 was considered significant difference.Results:
The T2 values of the damaged cortex in the TBI group showed a slow decreasing trend after significantly increasing. At On day 1 after modeling, the T2 values in the TBI group were significantly higher than those in the control group (adjusted P=0.0015). ), and reach The T2 peaking values peaked aton day 7, which was significantly higher than the treated control group (adjusted P<0.0001). However, it was still significantly higher than that of the untreated control group, and it could not return to the normal level in the late stage. Although T2 value in the LITUS treatment treated group was significantly higher than that in the control group, there was a significant difference between each observation time point and TBI. T2 values decreased slowly with continuous treatment. At day 28, the T2 values were no longer different from those in the control group (adjusted P=0.0535), but were significantly lower than those in the TBI group at day 42 (adjusted P=0.0003). Obvious edema area could be seen in the cerebral cortex of TBI group from 7 7 dayss to 42 days after trauma, and the edema area gradually decreased. Welch's test showed that the edema volumes at day7and day14 in LITUS group was were significantly lower than that those in TBI group (P=0.0178 and P=0.0002, respectively).Discussions:
In this study, multi-TE T2WI was used to dynamically measure the T2 value in the edema area. It was found that the T2 value in the injury area of the rats in the treatment treated group increased slightly at 1 day and peaked at 7 days, and with an increased increasing significantly trend during the observation period. By observing the T2 value, we found that LITUS had an inhibitory effect on the early and late cerebral edema. Therefore, LITUS may have a certain regulatory effect on both angiogenic edema and cytotoxic edema. This study suggests that inhibiting the expression of AQP4 and promoting the clearance of β-APP may also be an important mechanism for LITUS in treating to fight traumatic cerebral edema.Conclusions:
This study proves proved that combination of T2 values and edema volume can be used as a biomarker in evaluating the neuroprotective effect of LITUS to moderate TBI. Through imaging and histopathology analysis, we confirmed LITUS has a good therapeutic effect on post-traumatic brain edema whose through imaging, and its mechanism may be related to inhibiting the expression of AQP4 edema promoting substances and promoting the removal of β-APP.Acknowledgements
This research was supported by National Natural Science Foundation of China (81871029).References
No reference found.Figures
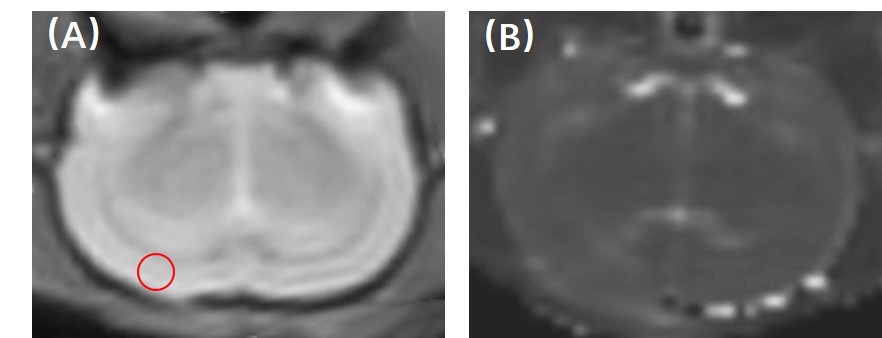
Fig.
1: A-B: T2-weighted
mapping image.
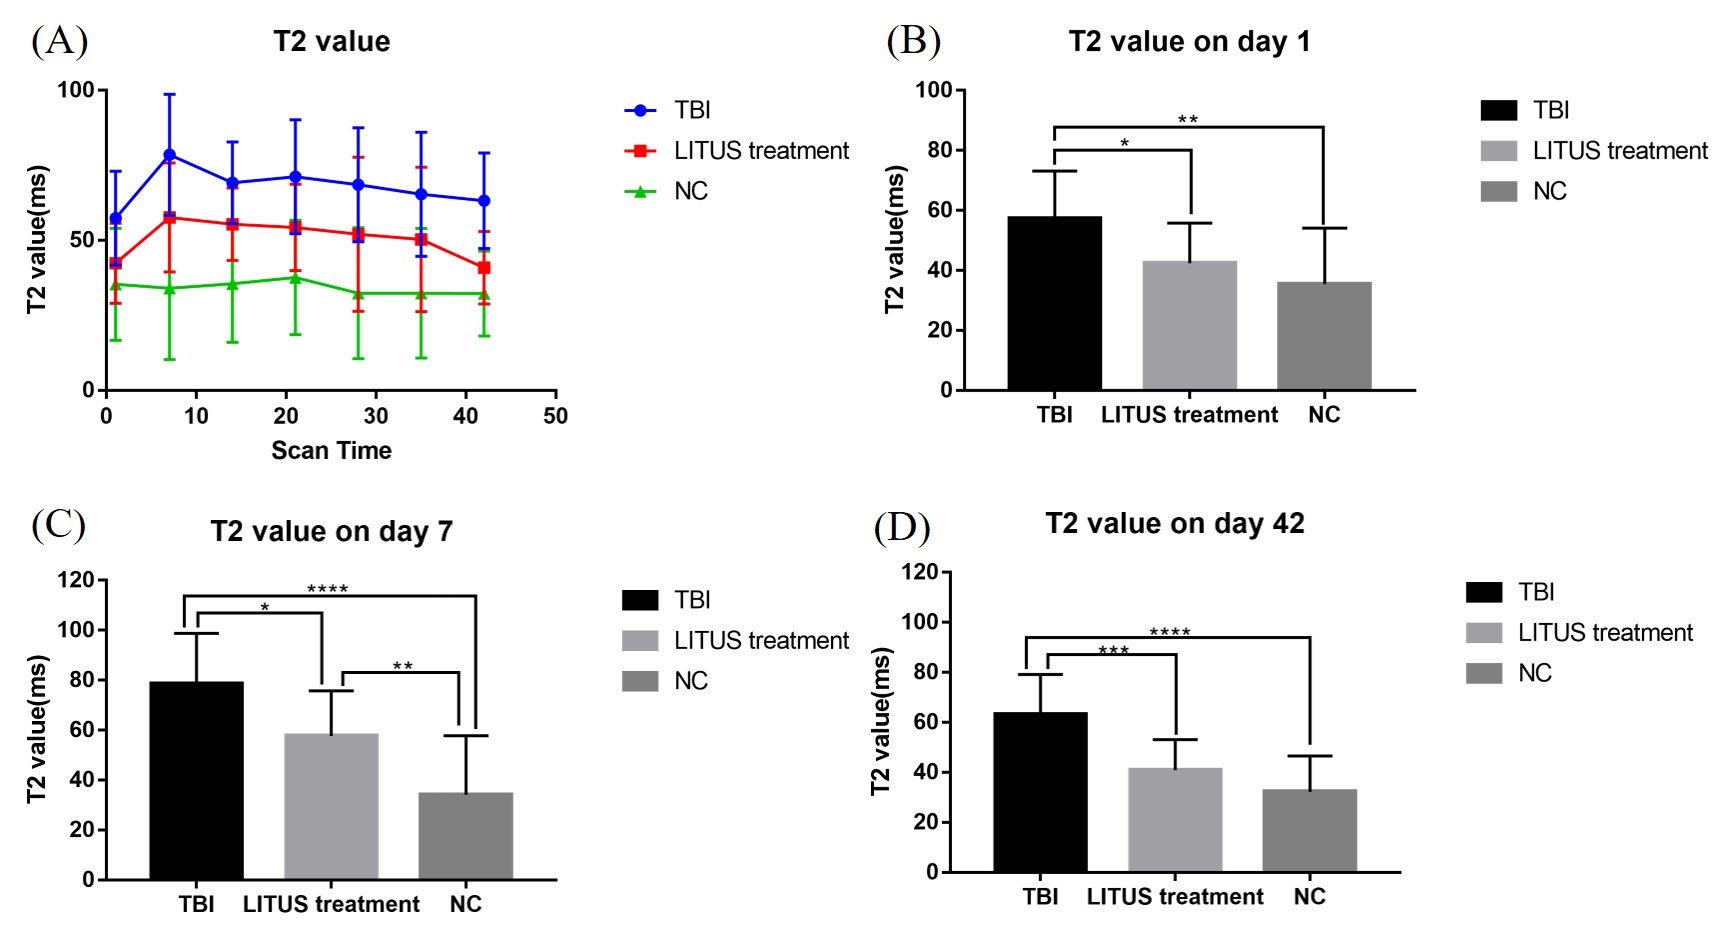
Fig.
2: A: Trends of T2
values in the injury cortex. B-D: T2 values on day 1, 7 and 42 in the injury
cortex. Data are mean±SD, n=15. Unpaired t-test, *p<0.05, **p<0.01,
***p<0.001 , ****p<0.0001.
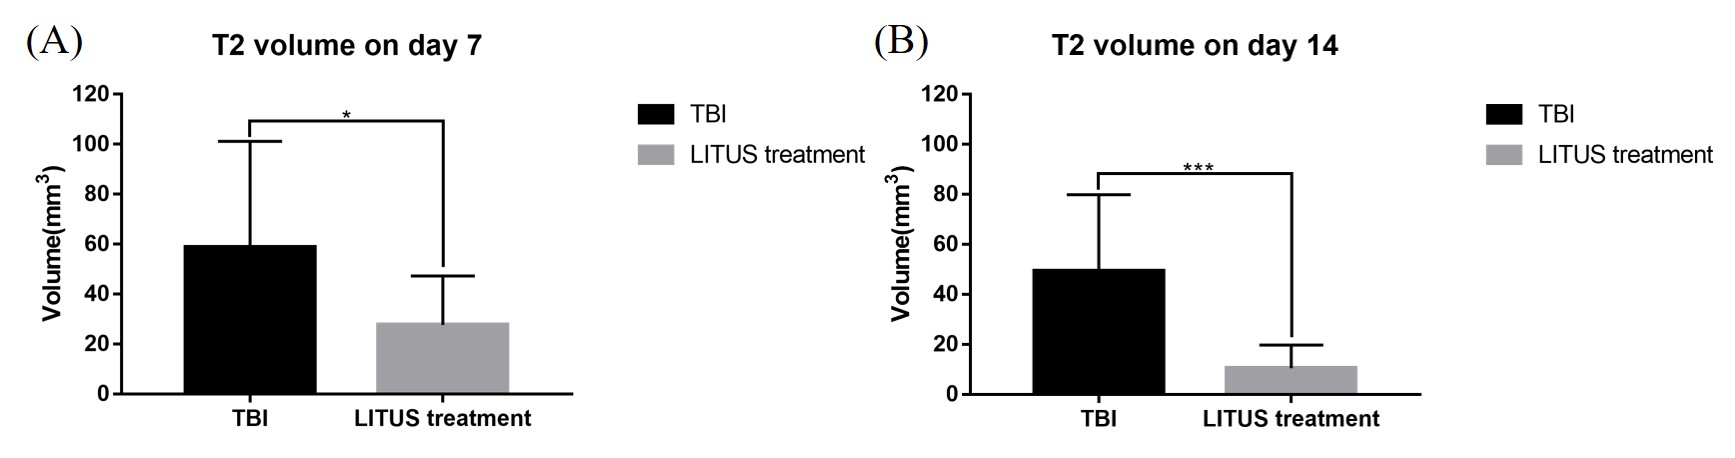
Fig.
3: A: Trends of T2
values in the injury cortex. B-D: T2 values on day 1, 7 and 42 in the injury
cortex. Data are mean±SD, n=15. Unpaired t-test, *p<0.05, ***p<0.001.
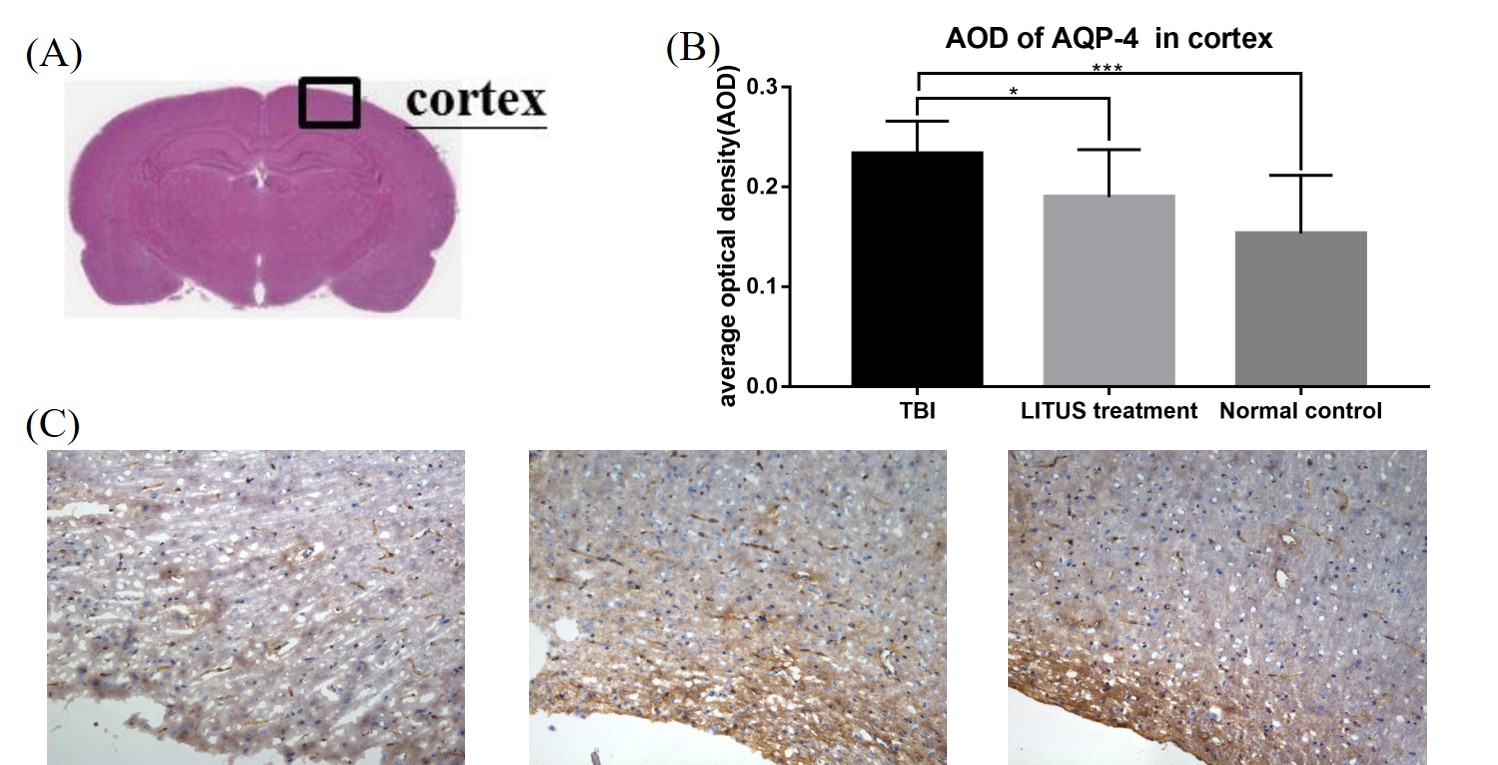
Fig. 4: Semi-quantitative analysis found that the average optical density of
AQP4 in the TBI group, LITUS treatment group and normal control group was
0.23±0.03, 0.19±0.05 and 0.15±0.06, respectively.
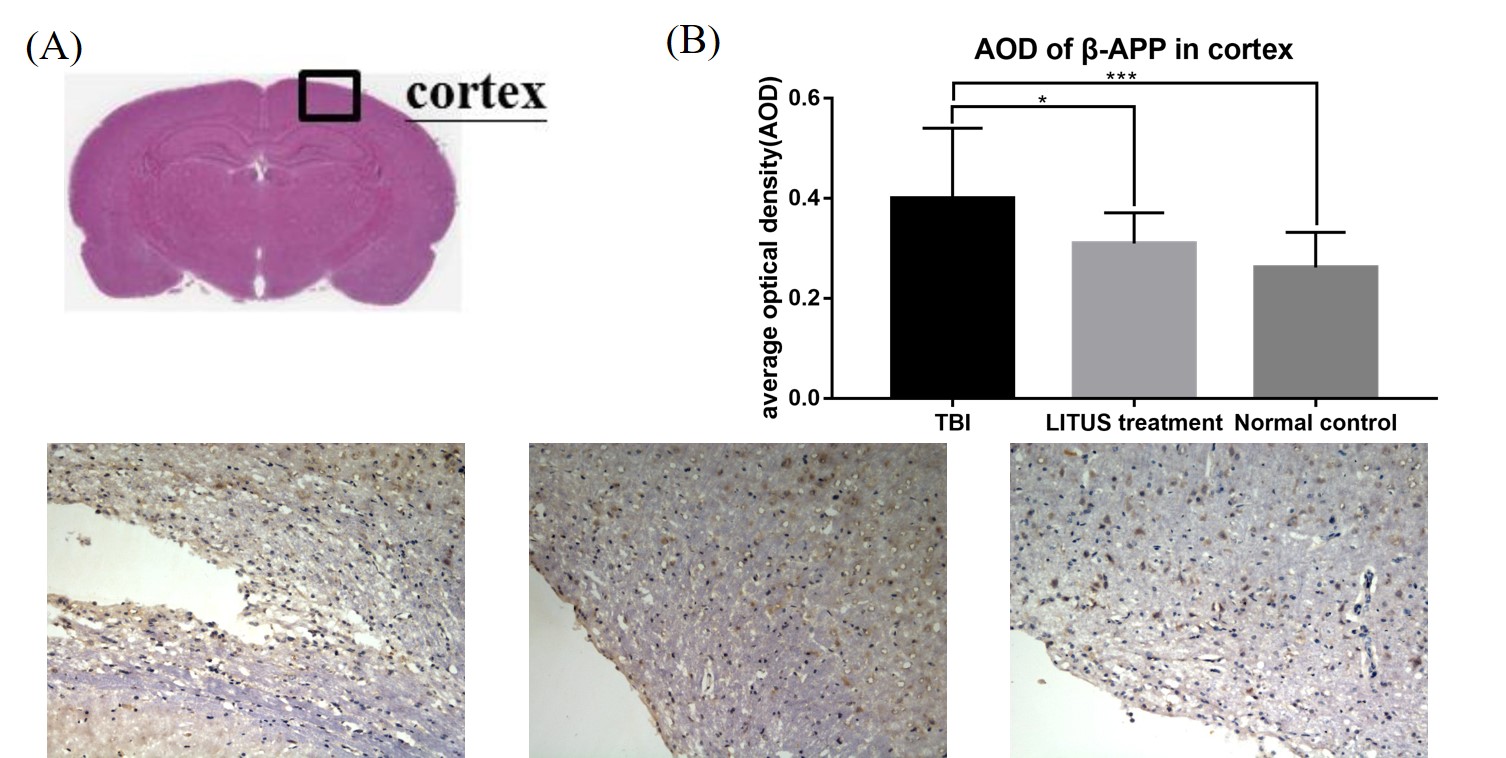
Fig.
5: Semi-quantitative analysis found that the average
optical density of beta-app was 0.4±0.14, 0.31±0.06 and 0.26±0.07, respectively.
Unpaired t-test, ***p<0.001.