3948
Shaping the BOLD signal through Excitatory and Inhibitory Interaction.1Institute of Neuroinformatics University and ETH Zurich, ETH Zurich, Zurich, Switzerland
Synopsis
Characteristics of neural processing such as recurrent signalling, make the definition of functional neural involvement notoriously difficult. This has implications for fMRI interpretation, and especially the relationship between excitatory/inhibitory networks and the BOLD response has not been well studied. Here we provide evidence that there are stimulus-dependent effects on neural processing in the VISp that could explain previously observed differentiation in BOLD polarity. We hypothesize that this is due to local excitatory/inhibitory interactions, and present a novel fiber-photometry setup that allows us to investigate the neural underpinnings of this effect by measuring excitatory and inhibitory activity during fMRI.
Introduction
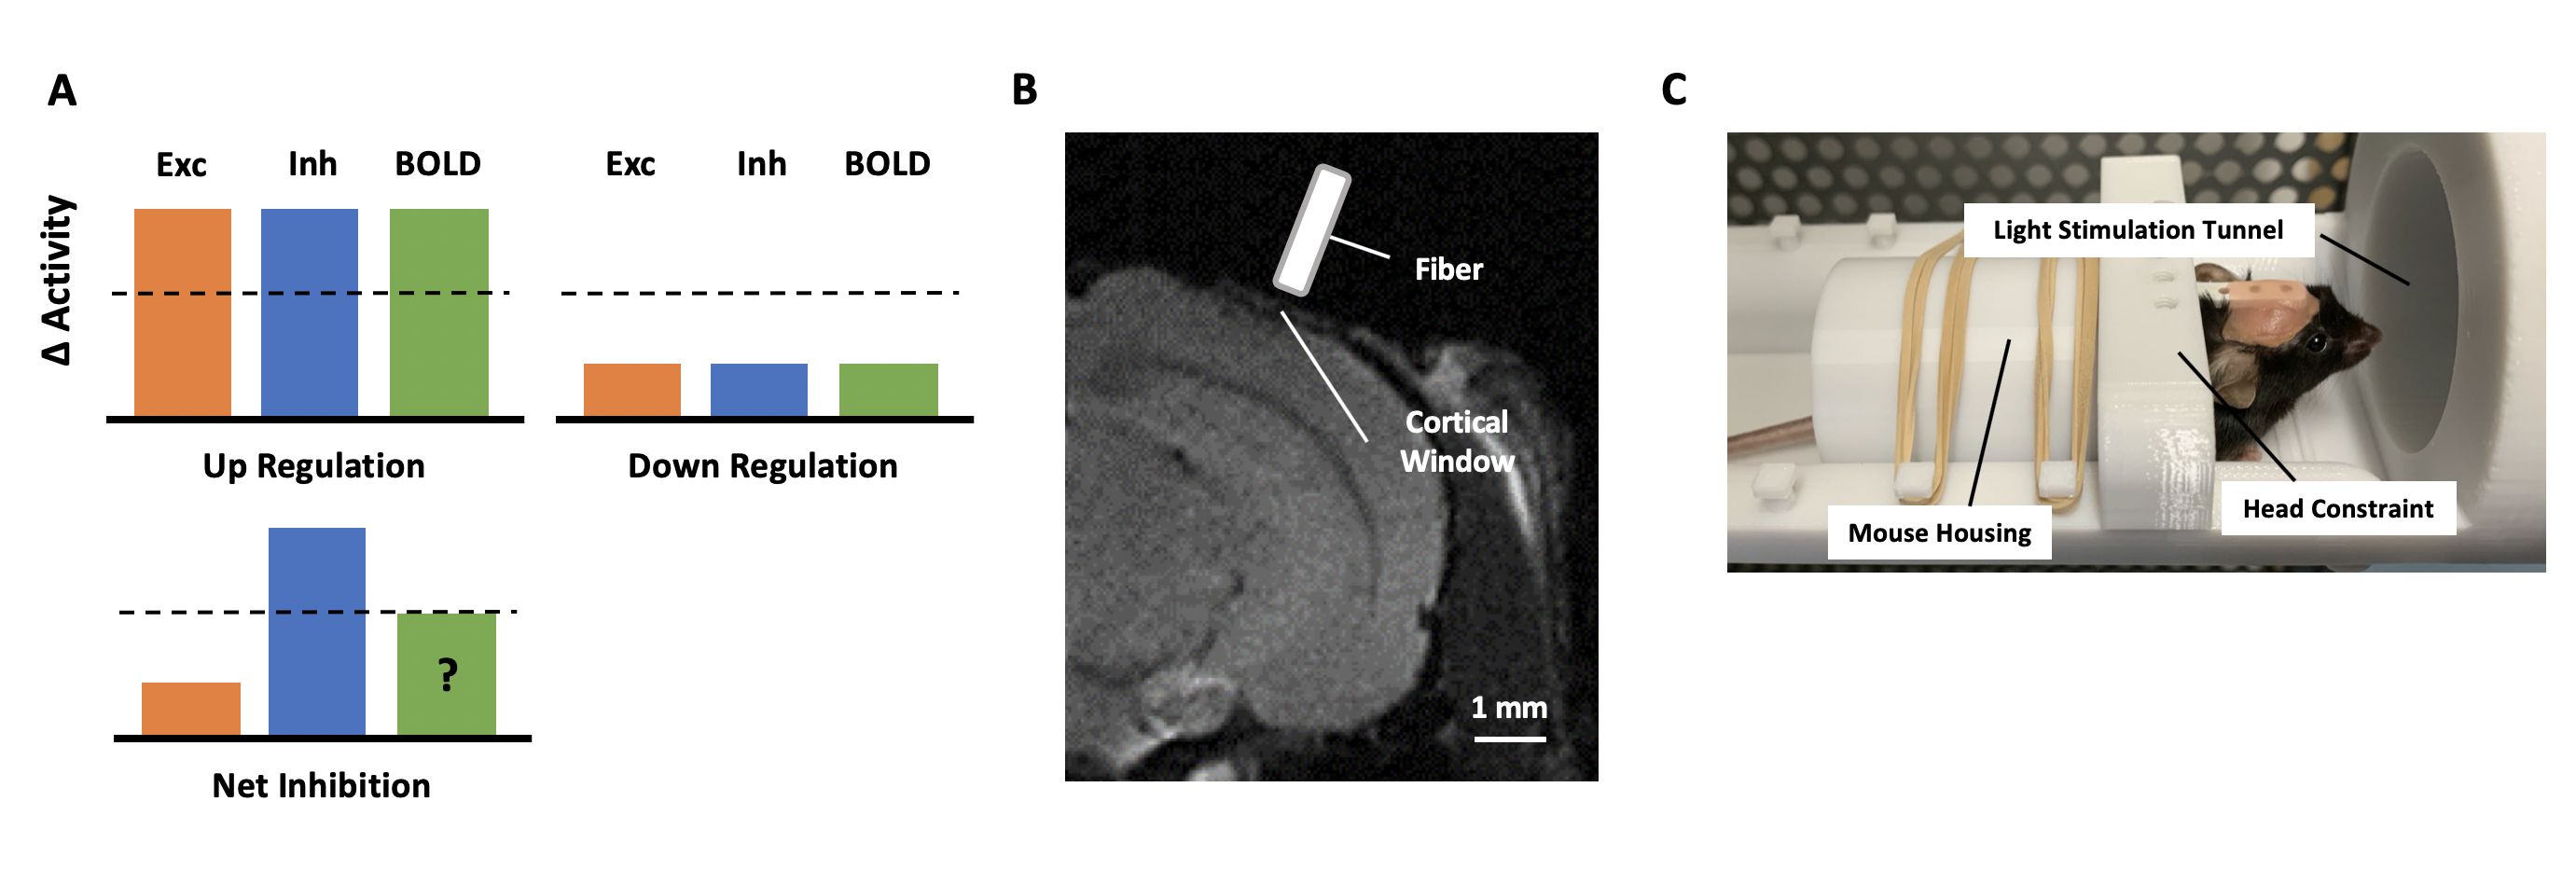
Over the past years, functional Magnetic Resonance Imaging (fMRI) has become a powerful tool to study neural dynamics non-invasively. Although our understanding of the neural underpinnings of the Blood-Oxygen Level Dependent (BOLD) response has progressed rapidly since the invention of fMRI, there are still several questions about its interpretation that are not well understood. Traditionally, a positive increase in the BOLD response is interpreted as the vascular response to the functional involvement of neurons that exhibit task-related output in a certain area. However, research has shown that several characteristics of neural processing such as feedforward/feedback and massive recurrent signaling, and the organization of the brain in local excitatory and inhibitory (EI) networks, make the definition of functional involvement on the level of neural networks notoriously difficult2. For example, it has been shown that EI networks are wired in a way that recruitment of an area can result not only in task-related excitatory spiking output but also in increased excitatory and inhibitory activity without stimulus-related spiking output, both situations that might increase the metabolic need1 (Fig. 1A). This differentiation is difficult to reconcile with the classical interpretation of fMRI and is hypothesized to be dependent on the cytoarchitectural features of the involved area and task characteristics2. Interestingly, a recent fMRI study characterized the stimulus-dependent response of the primary visual cortex (VISp) in mice. Niranjan et al. (2016) observed that indeed the BOLD response in the VISp showed a strong dependence on the pulse frequency of the light stimulation, with lower frequencies inducing a positive BOLD response and higher frequencies inducing a negative BOLD response. The authors then propose that this stimulus-dependent observation might be due to the interaction between excitatory and inhibitory neurons in the mouse VISp (Fig. 1A).To investigate how EI cortical processing shapes the BOLD response, we present a novel calcium imaging approach that allows us to measure bulk activity of genetically predefined excitatory and inhibitory neuronal populations during fMRI acquisition. Our preliminary results confirm that similar to reported fMRI results, there exists a differentiating stimulus-dependent effect on the level of neuronal activity.Methods
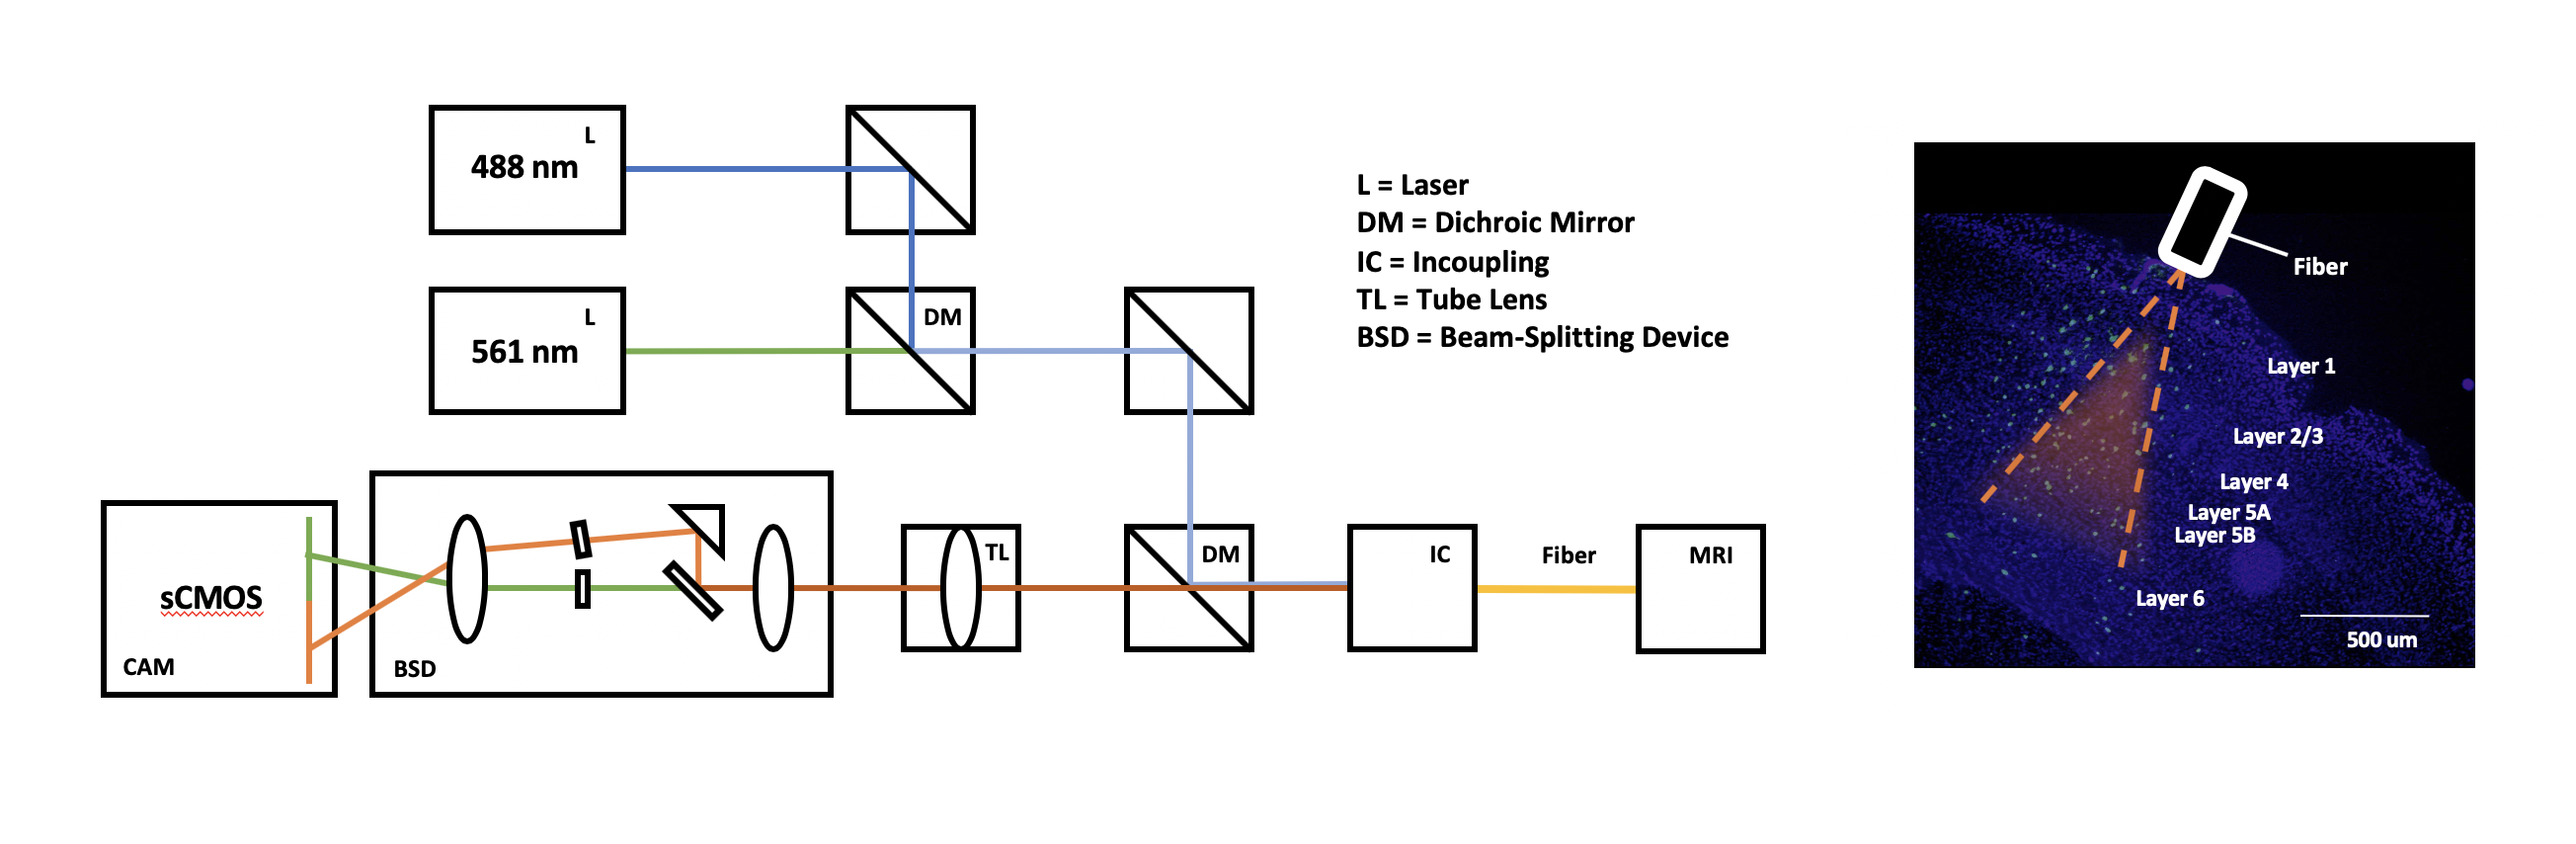
To measure the bulk activation of excitatory and inhibitory neurons we adapted a previously published fiber-photometry setup by expanding the system with an additional excitation laser (488nm and 561nm; Fig. 2) 4. In addition, we used a beam splitting device that separates the two fluorescence signals (red/green) before projecting the separate streams onto a camera. The two fluorescence signals represent the population activity of two genetically defined cell types (i.e. excitatory and inhibitory neurons). All components used for the mouse head implant, as well as the constraining apparatus, are MR-compatible and do not elicit any artifacts during sustained MR measurements (Fig. 1B and 1C). As a first step, we inject a genetically modified mouse line that expresses Cre in Parvalbumin positive cells (PV) with either GCaMP6m (targeting excitatory neurons) or Cre dependent RCaMP1.07 (targeting PV neurons) in the VISp. Next, we implanted a glass cortical window for visual access to the injected site. To investigate the neuronal activity underlying the stimulus-dependent change in BOLD polarity, we reproduced the experiment by Niranjan et al. (2016) while recording neural activity in the mouse visual cortex. During experiments, we presented mice with a pulsating blue light (480 nm) at high (10 Hz) or low (2 Hz) frequency, using the stimulus parameters described in Niranjan et al. (2016). One hypothesis that was put forward to explain the stimulus-dependent polarity of the BOLD signal, was that anesthesia might induce non-linear effects on neurovascular coupling. To make sure that anesthesia did not confound our findings we opted to perform these experiments in awake mice.Results
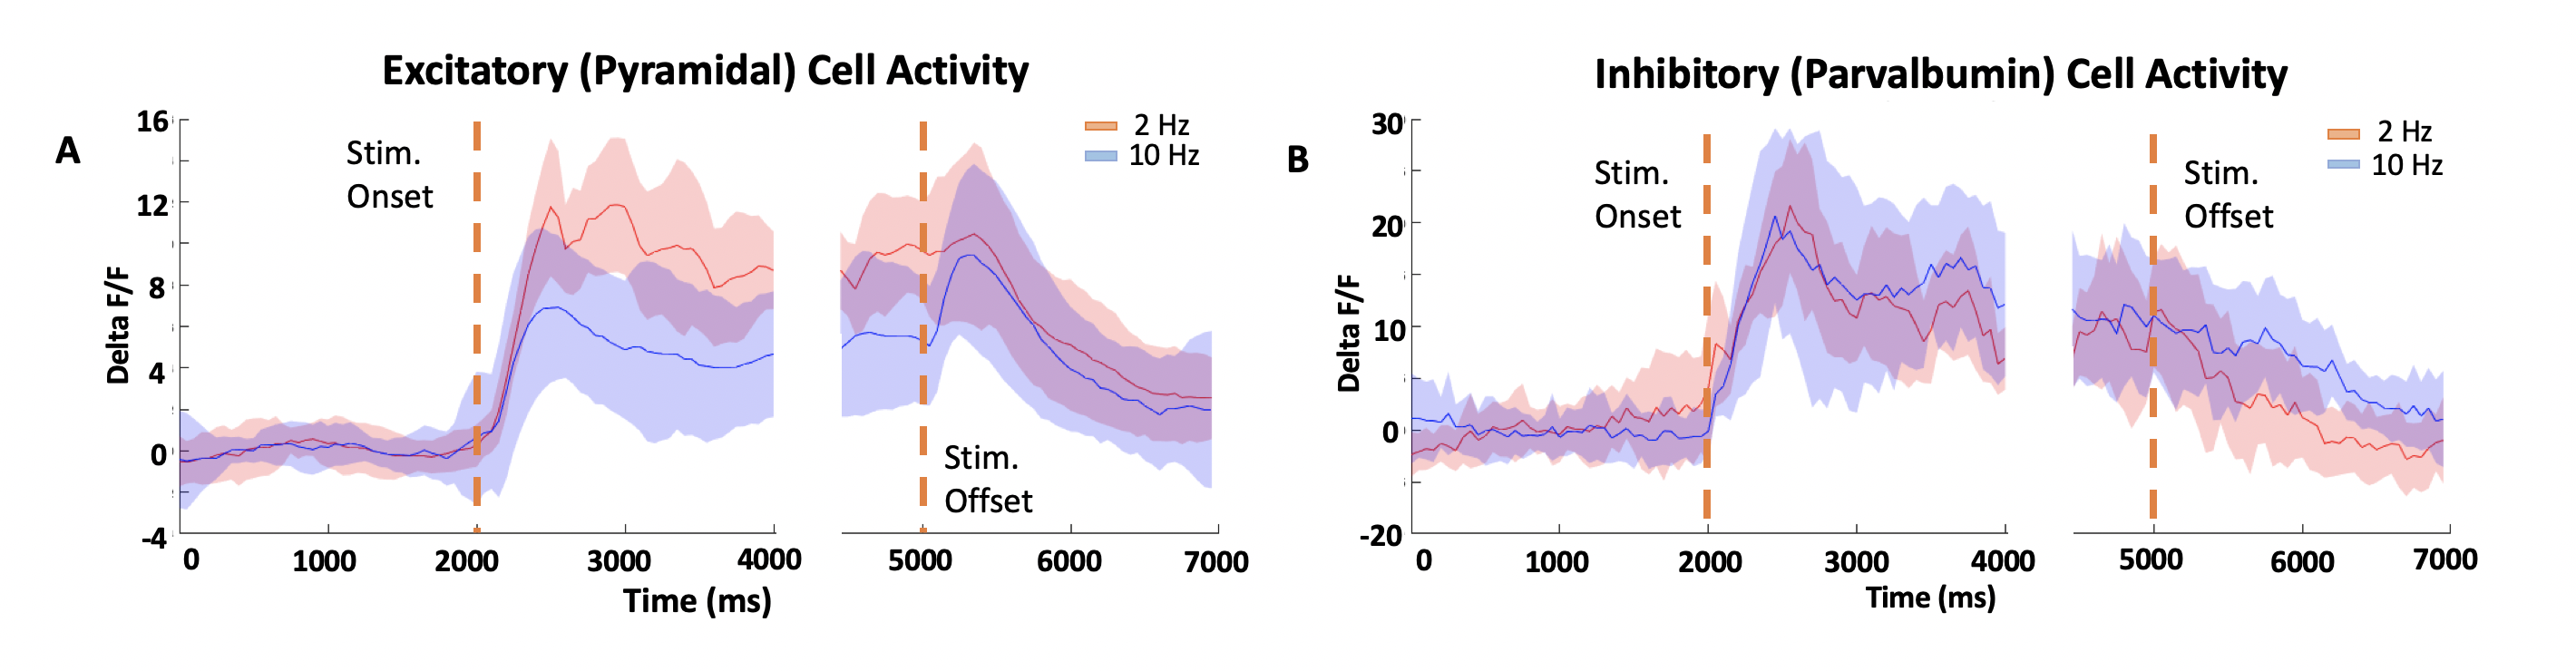
Our calcium imaging results confirm that there is indeed a stimulus-dependent differentiation of excitatory neural bulk activity at the population level (Fig. 3A and 3B). The fluorescence signal of the labelled pyramidal neurons during 2 Hz stimulation (peak dF/F = 11.87, mean dF/F = 8.77 with std = 2.79) was higher when compared to the activity during 10 Hz visual stimulation (peak dF/F = 6.92, mean dF/F = 4.72 with std = 3.45). In contrast, the fluorescence signal of inhibitory PV neurons showed less difference during stimulation (2 Hz: peak dF/F = 21.64, mean dF/F = 11.20 with std 5.75; 10 Hz: peak dF/F = 20.72, mean dF/F = 12.59 with std 7.79).Conclusion
Our initial results suggest that there is indeed a stimulus-dependent effect that is based on neural activation. This effect seems to be most pronounced when looking at excitatory activation. However, this raises the question about what causes this decreased excitatory activation? With our novel fiber-photometry setup, we were able to show that it is possible to measure excitatory and inhibitory activity directly through calcium imaging. Our next step is to target different inhibitory neural subclasses, such as SOM+ or VIP neurons, to test whether their response to visual stimulation has a differentiating effect that could explain the corresponding polarity of the BOLD response as seen in Niranjan et al., 2016.Acknowledgements
No acknowledgement found.References
1. Douglas RJ, Martin KA, Whitteridge D. A canonical microcircuit for neocortex. Neural Computation. 1989;1:480–488.
2. Logothetis, NK. What we can do and what we cannot do with fMRI. Nature. 2008;453: 869.
3. Niranjan A, Isabel CN, Samuel SG, et al. fMRI mapping of the visual system in the mouse brain with interleaved snapshot GE-EPI. NeuroImage 2016;139:337-345.
4. Sych Y, Chernysheva M, Sumanovski, LT, et al. High-density multi-fiber photometry for studying large-scale brain circuit dynamics. Nature methods 2019;16: 553.
Figures