3947
Resting state cerebral networks in mouse lemur primates: comparison with humans1Wake Forest University, Winston Salem, NC, United States, 2Commissariat à l’Energie Atomique et aux Energies Alternatives (CEA), Fontenay aux Roses, France, 3INSERM, U1077, CHU de Caen, Neuropsychologie et Imagerie de la Mémoire Humaine, Normandie University, UNICAEN, EPHE, Caen, France, 4Normandie Univ, UNICAEN, GIP Cyceron, Inserm, Inserm UMR-S U1237, Caen, France, 5EA 2027, Université Paris 8, 5 Laboratoire de Psychopathologie et de Neuropsychologie, Saint Denis, France, 6UMR 9199, Neurodegenerative Diseases Laboratory, 1 Centre National de la Recherche Scientifique (CNRS), Fontenay-aux-Roses, France, France
Synopsis
Characterizing neuronal networks in animals is critical to further address their evolutions. Here we compared brain networks in humans and in mouse lemurs (Microcebus murinus), one of the more phylogenetically distant primates as compared to humans. Network hubs were split into parietal and frontal clusters in humans, while they were grouped in lemurs. Human’s default mode network (DMN) embedded more hubs than lemur's DMN. Mouse lemur's motor network embedded more hubs than human motor networks. Hubness properties could constitute a lever of evolution to adapt information flux to brain size and/or cerebral function.
Introduction:
Measures of resting-state functional connectivity allow the description of neuronal networks in humans and provide a window on brain function in normal and pathological conditions. Characterizing neuronal networks in animals is critical to further address their evolutions and roles in pathologies. Blood-oxygen level dependent (BOLD) resting-state functional magnetic resonance imaging (rsfMRI) is a reference method to detect networks in humans and animals [1]. The aim of this study was to compare neuronal networks in mouse lemurs and to compare these networks with those identified in humans in order to assess network evolution in primates. Large scale networks were identified from 11.7 Tesla and 3.0 Tesla MR images in lemurs and humans, respectively, using the same dictionary learning method.Materials and methods
MRI data acquisitionResting state functional MRI data were recorded in 14 mouse lemurs (11.7 T gradient-echo echo planar imaging (EPI), TR=1000ms, TE=10ms, flip angle=90°, repetitions=450, FOV=30×20 mm2, 23 slices of 0.9 mm thickness and 0.1 mm gap, resolution=312.5×208.33×1000µm, acquisition duration 7m30s, Bruker BioSpec system). Animals were scanned twice each, six months apart. All scans were recorded under isoflurane anesthesia at 1.25-1.5% in air (with respiratory rate monitored to control animal stability) using an. Humans analysis involved 48 healthy subjects who were scanned at rest on a 3.0 T scanner (interleaved 2D T2* SENSE EPI, TR=2382ms, TE=30ms, flip angle=80°, repetitions=450, FOV=224×224 mm2, 42 slices of 2.8 mm with no gap, in plane resolution=2.8×2.8mm2, acquisition duration = 11.5 min).
MRI preprocessing
Spatial preprocessing was performed using the python module sammba-mri (http://sammba-mri.github.io) which, using nipype for pipelining [2], leverages AFNI [3] for most steps and RATS [4] for brain extraction. Anatomical images were mutually registered to create a study template, which was further registered to an anatomical mouse lemur template [5].
Images analysis
Partial correlation matrices were created using fully preprocessed MR images by calculating the partial correlation coefficients between BOLD MR signal time-courses within each region of the ALL2 human [6] and lemur atlases [7]. "Hubness" was evaluated in human and mouse lemur brains using eigenvector centrality measures based on NetworkX [8]. Multi-animal dictionary learning was performed with Nilearn [9] on preprocessed resting state functional MR images. Six and eight sparse dictionary learning components were used in lemurs and humans.
Results
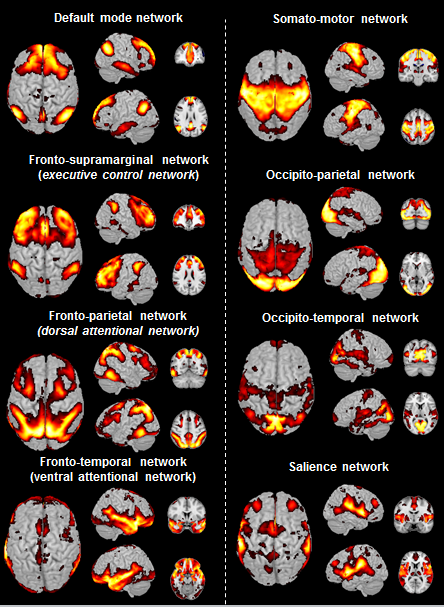
Cerebral networks in humansEight components were identified in humans and classified using information from the literature (Fig. 1). They were classified as the default mode (DMN), executive control network, dorsal attention network, ventral attention network, somato-motor, dorsal ventral parts of the visual network, salience network.
Cerebral networks in mouse lemurs
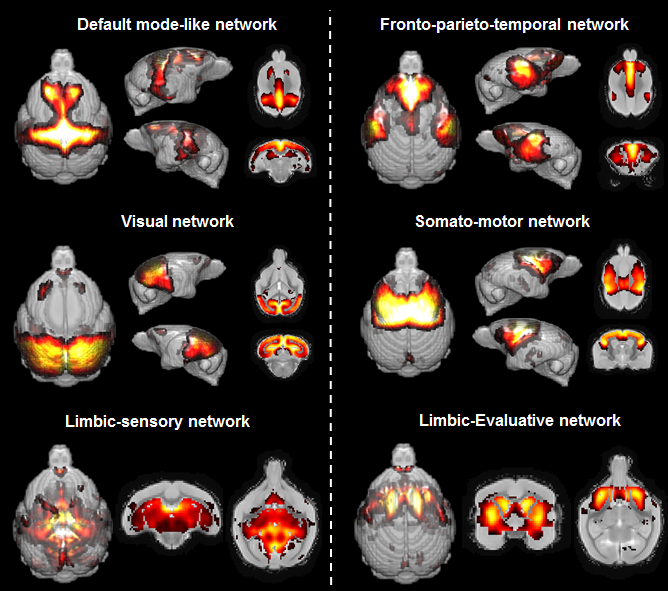
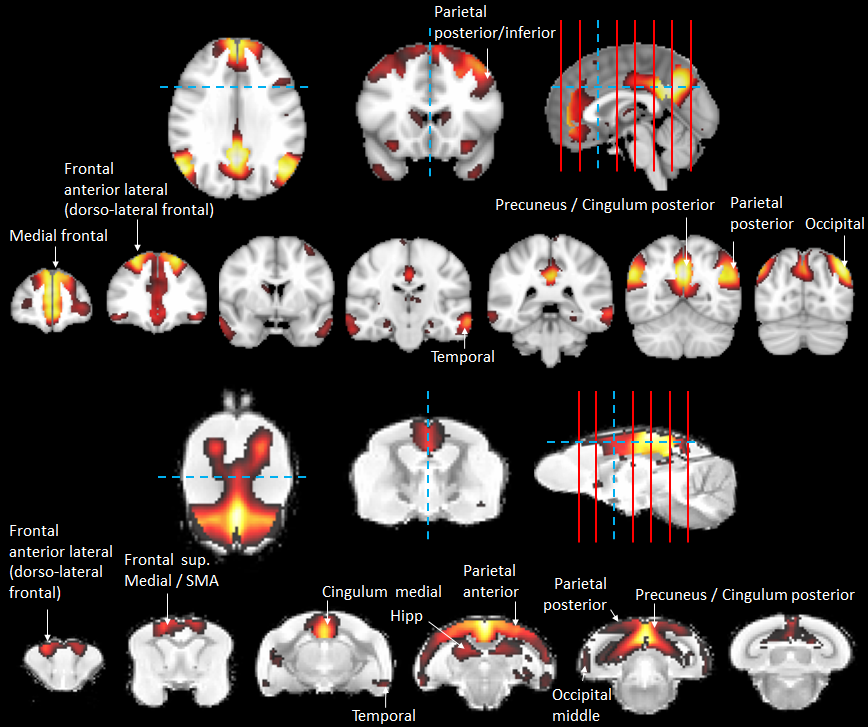
Six components were identified in mouse lemurs and were classified as DMN, the executive control network, the somato-motor and the visual network. Two limbic networks (sensory-limbic and evaluative-limbic) were detected in lemurs but not in humans (Fig. 2, 3). Interestingly several networks were homologous between humans and lemurs. However, focal changes between subcomponents of homologous networks (components appearing or disappearing) were identified and could reflect local reorganisation of these networks during evolution. For example, Unlike in humans, we did not detect frontal medial regions but frontal anterior lateral regions in the mouse lemur DMN.
Brain hubs in human and mouse lemurs
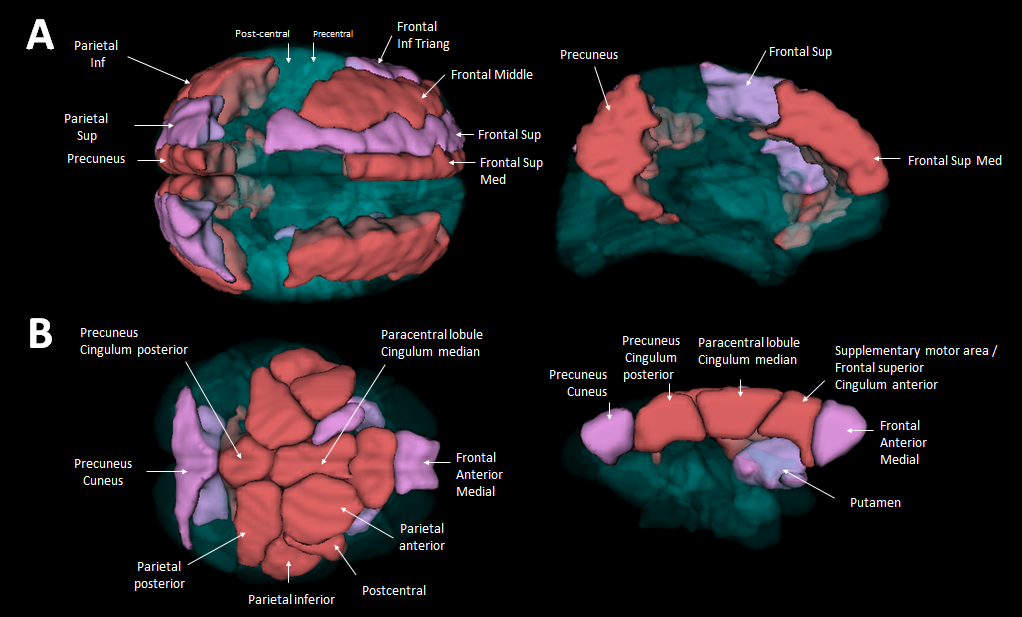
In humans, the 3 nodes presenting the highest eigenvector centrality were localized in the integrative parietal regions (Fig. 4A). Then the next hubs were localized in the frontal cortex. All these regions that are part of the 10 strongest hubs belong to the DMN. Interestingly there was a discontinuity between the different hubs that were distributed within parietal and frontal clusters. Unlike in humans, in mouse lemurs, the main hubs were all connected together along a rostro-caudal axe (Fig. 4B) and involved mainly the sensory-motor network. A striking difference between hubs of humans and lemurs was the involvement of the cingulate cortices in mouse lemur networks and not in humans.
Conclusion
Using mouse lemurs, we could propose some rules for network evolution. First, analysis of DMN suggests that evolution is based on the reorganization of some homologous networks that are locally topologically modulated by adding of removing some functional nodes. Second, analysis of limbic networks suggests that some networks can become less conspicuous or used during animal evolution. Third we showed non-contiguous clusters of hubs in humans, while hubs are grouped within one antero-dorsal cluster in mouse lemurs. Strong changes of brain hubs could constitute a lever of evolution to adapt information flux to brain size and/or cerebral functional organization.Acknowledgements
France-Alzheimer Association, Fondation Plan Alzheimer, Banque Publique d’Investissement (ROMANE program).References
1. Biswal, B., et al., Functional connectivity in the motor cortex of resting human brain using echo-planar MRI. Magn Reson Med, 1995. 34(4): p. 537-41.
2. Gorgolewski, K., et al., Nipype: a flexible, lightweight and extensible neuroimaging data processing framework in python. Front Neuroinform, 2011. 5: p. 13.
3. Cox, R.W., AFNI: software for analysis and visualization of functional magnetic resonance neuroimages. Comput Biomed Res, 1996. 29(3): p. 162-73.
4. Oguz, I., et al., RATS: Rapid Automatic Tissue Segmentation in rodent brain MRI. J Neurosci Methods, 2014. 221: p. 175-82.
5. Nadkarni, N.A., et al., A 3D population-based brain atlas of the mouse lemur primate with examples of applications in aging studies and comparative anatomy. Neuroimage, 2018. 185: p. 85-95. 6. Tzourio-Mazoyer, N., et al., Anatomical labeling of activations in SPM using a macroscopic anatomical parcellation of the MNI MRI single-subject brain. NeuroImage, 2002. 15(1): p. 273-289. 7. Grandjean, J., et al., Common functional networks in the mouse brain revealed by multi-centre resting-state fMRI analysis. bioRxiv, 2019: p. 541060.
8. Hagberg, A.A., D.A. Schult, and P.J. Swart, Exploring network structure, dynamics, and function using NetworkX, in Proceedings of the 7th Python in Science Conference, G. Varoquaux, T. Vaught, and J. Millman, Editors. 2008: Pasadena, CA. p. 11-15.
9. Mensch, A., G. Varoquaux, and B. Thirion, Compressed online dictionary learning for fast resting-state fMRI decomposition, in International Symposium on Biomedical Imaging2016, IEEE: Prague, Czech Republic. p. 1282-1285.
Figures