3942
fMRI dynamic functional connectivity states associated with EEG alpha power1ISR-Lisboa/LARSyS and Department of Bioengineering, Instituto Superior Técnico – Universidade de Lisboa, Lisboa, Portugal, 2Coimbra Institute for Biomedical Imaging and Translational Research (CIBIT), University of Coimbra, Coimbra, Portugal, 3Laboratory for Functional and Metabolic Imaging, École Polytechnique Fédérale de Lausanne, Lausanne, Switzerland, 4Systems Division, Swiss Center for Electronics and Microtechnology (CSEM), Neuchâtel, Switzerland, 5Life and Health Sciences Research Institute (ICVS), School of Medicine, University of Minho, Minho, Portugal
Synopsis
Functional connectivity has been shown to change over short time scales of seconds to minutes, giving rise to the so-called dynamic functional connectivity (dFC). However, the electrophysiological underpinnings of dFC states remain unclear. We investigate EEG spectral correlates of dFC states using simultaneous EEG-fMRI data, by using a high temporal resolution fMRI acquisition combined with a phase coherence approach for dFC estimation and by computing k-means clustering with a varying number of dFC states. We found an association between high alpha power topographies and specific dFC states, which included regions of the frontoparietal network and the default mode network.
Introduction
A growing number of studies are investigating spontaneous fluctuations over short time scales of seconds to minutes in the brain’s functional connectivity (FC) measured by resting-state fMRI - the so-called dynamic functional connectivity (dFC) 1. A limited number of recurrent dFC states have been identified, which are hypothesized to be associated with different cognitive, vigilance or pathological brain states 2. Importantly, one recent study used simultaneous EEG-fMRI recordings to show that dFC states identified during eyes open and eyes closed conditions were associated with distinct EEG spectral signatures 3. Still, the electrophysiological underpinnings of dFC states remain unclear. In particular, a number of questions remain open regarding the sliding window correlation approach typically used to estimate dFC, and the number of dFC states that are identified. Here, we further investigate EEG spectral correlates of fMRI dFC states based on simultaneous EEG-fMRI recordings, by using a high temporal resolution fMRI acquisition combined with a phase coherence approach for dFC estimation and by computing k-means clustering with a varying number of dFC states.Methods
Simultaneous EEG-fMRI data were acquired during 8 min resting-state with eyes open, from 9 healthy subjects, on a 7T Magnetom MRI scanner (Siemens) using an MR-compatible 64-channel EEG system (Brain Products) 4. BOLD-fMRI data was obtained using 2D GE-EPI (TR/TE=1000/25ms, 2.2mm isotropic resolution, 69 sagittal slices, SMS=3 and in-plane GRAPPA=2) and pre-processed as in 2. EEG data was MR-induced artefact corrected and band-pass filtered (1-70 Hz) as in 4.Brain parcellation was performed using the AAL atlas 5, and the BOLD signal was averaged within each of the 90 cortical and subcortical AAL regions and subsequently bandpass filtered (0.01-0.1 Hz). A 90x90 dFC matrix was estimated at each TR by computing the phase coherence between each pair of regions. The Leading Eigenvector Dynamics Analysis (LEiDA) approach 6 was employed, and only the 90x1 leading eigenvector of each dFC matrix (explaining over 50% of the variance) was considered. After concatenation along subjects yielding a 90x4230 dataset, k-means clustering was performed to identify a finite number of dFC states, with a variable number of states, k=3 to 15.
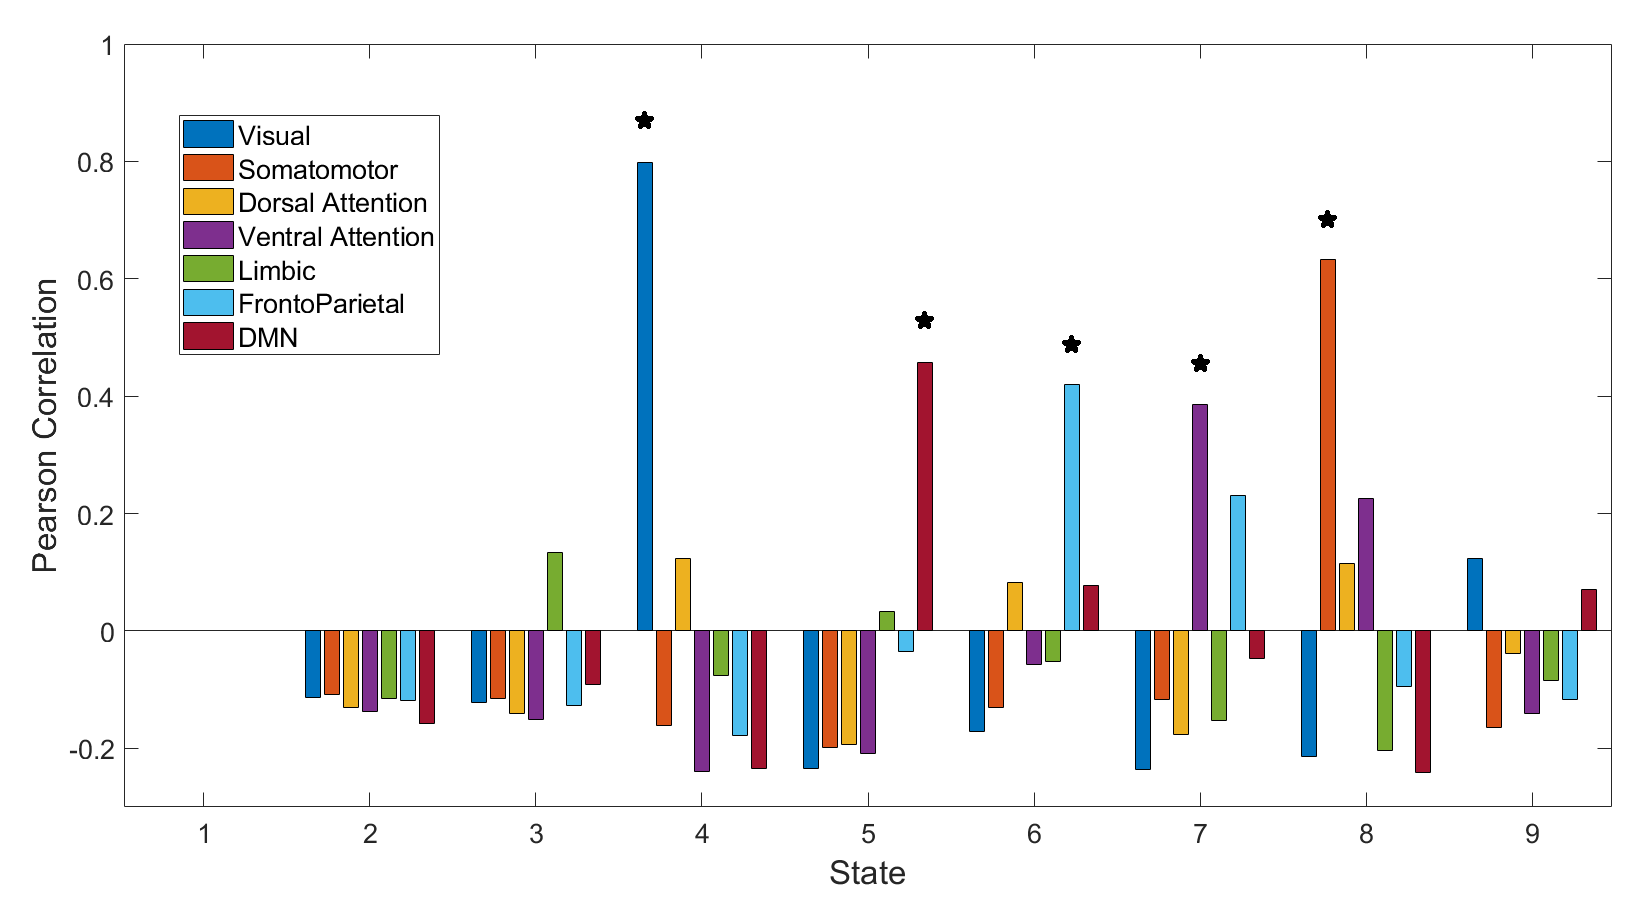
In order to investigate the similarity of each dFC state to well-established resting state networks (RSNs), the Pearson correlation between each dFC state and the AAL representation of 7 previously identified RSNs 7 was computed as in 8.
For the EEG correlates, the topographies of the relative EEG power across different frequency bands (delta [1,4]Hz; theta [4,8]Hz; alpha [8,12]Hz; and beta [12,20]Hz) were computed for each TR by normalizing by the total power [1,20]Hz (frequencies above 20Hz were excluded due to the presence of artifact residuals). The EEG power topographies associated to each dFC state were calculated, for each k, by averaging across all TR periods assigned to that dFC state. Because only the alpha power exhibited substantial differences between dFC states, results are exclusively focused on this frequency band.
Results
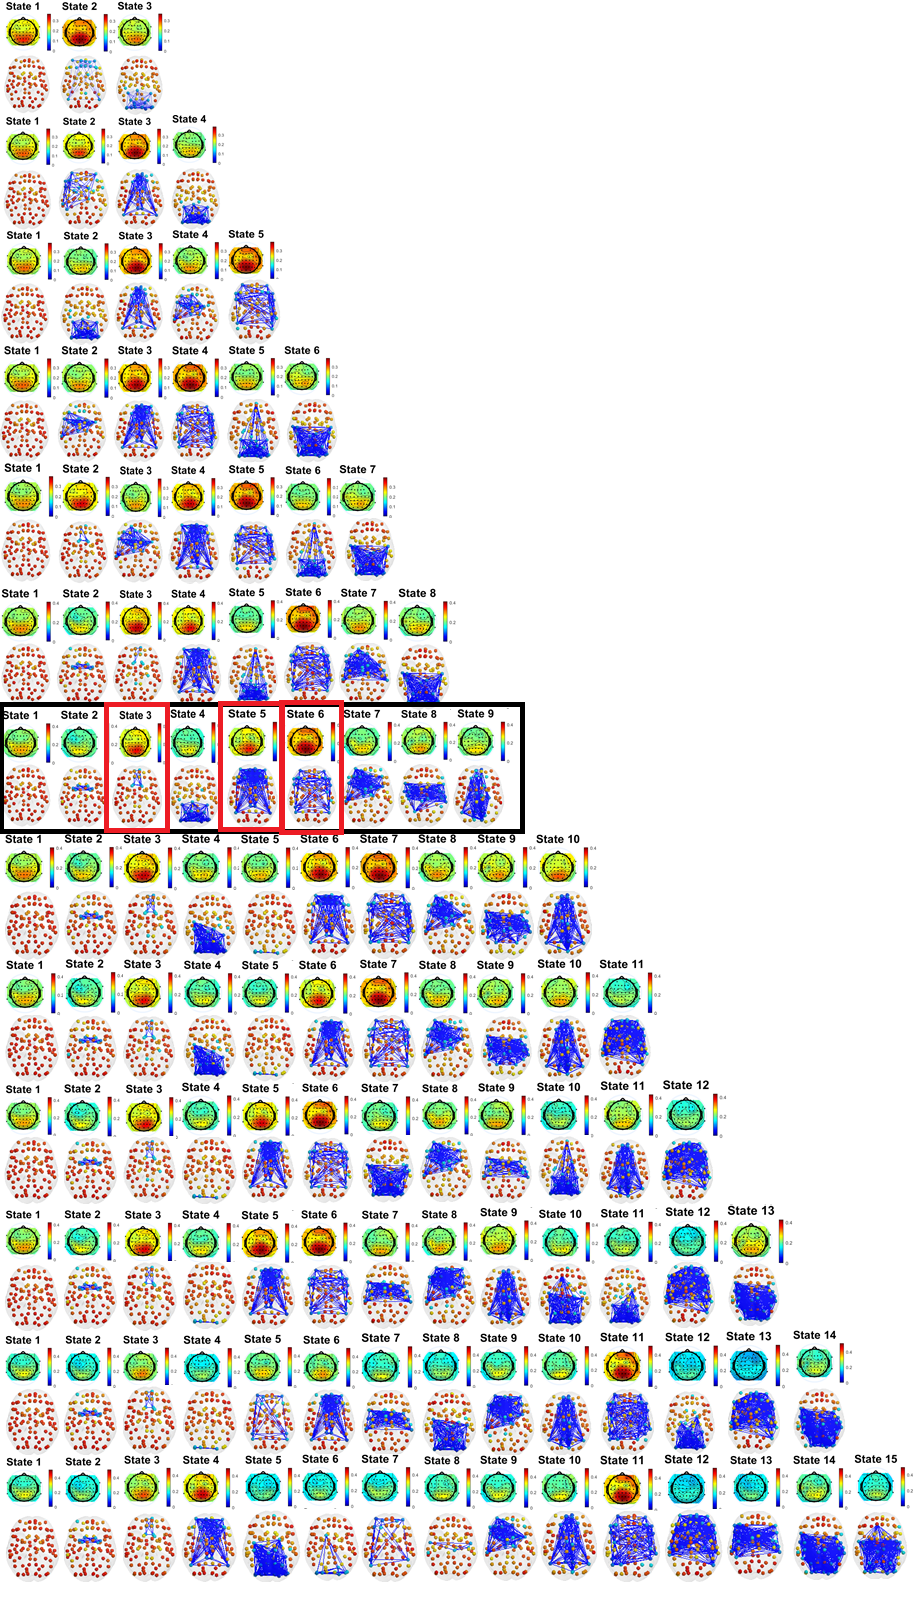
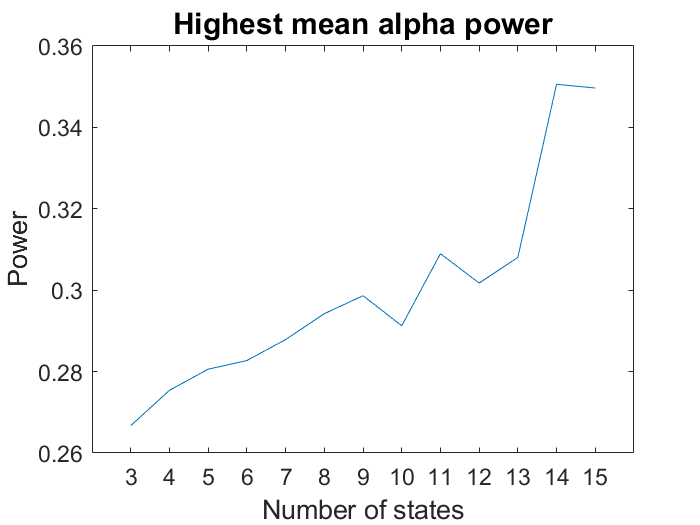
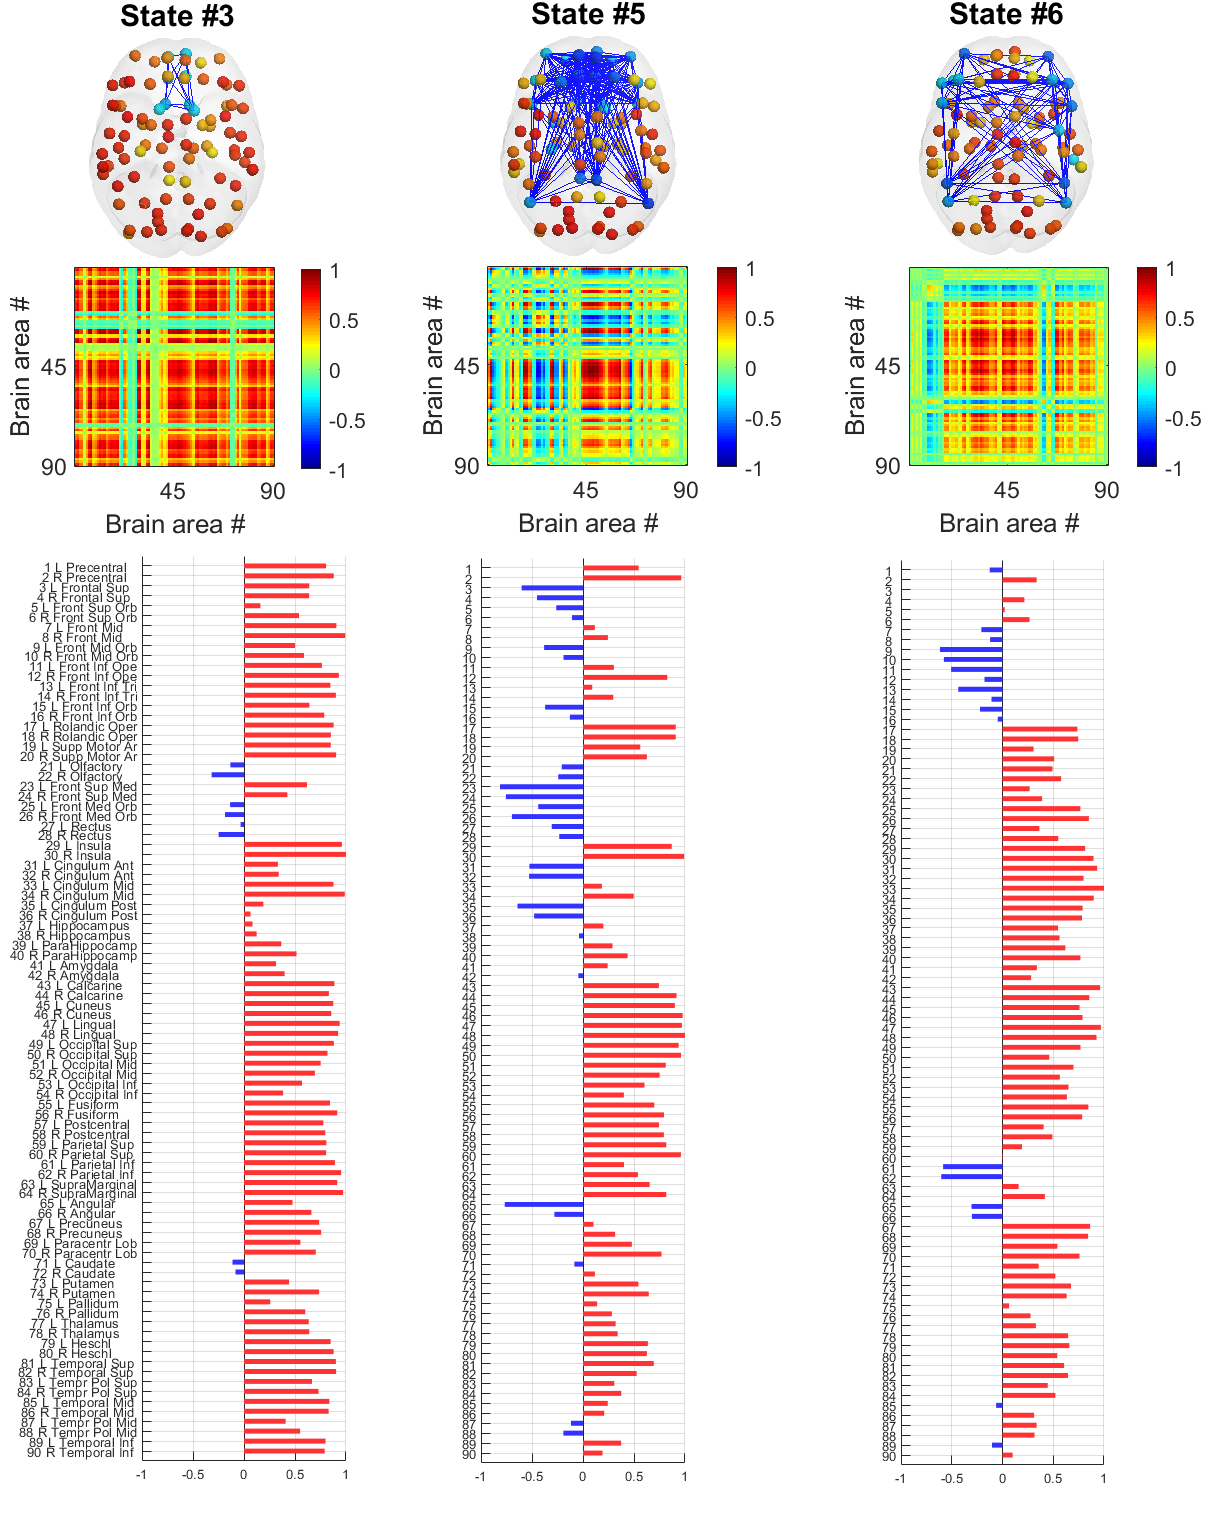
The dFC states and respective EEG alpha power topographies, obtained for each number of states tested, are presented in Fig.1. Aside from k=3, topographies with high alpha power, with a peak around channel Pz, are associated to dFC states resembling at least one of two RSNs: the default mode network (DMN) and the frontoparietal network. The relative alpha power was averaged across channels for each dFC state and each number of states. The maximum value for each k is presented in Fig.2, showing the global maximum for k=14 but a first local maximum for k=9.Nine dFC states was therefore selected as the best trade-off between a parsimonious estimation of dFC states and the identification of states associated with high alpha power. The Pearson correlation between the 9 dFC states and the 7 RSNs is presented in Fig.3. The three dFC states associated with high alpha power for k=9 are illustrated in Fig.4. Of these three states, one was significantly correlated with the frontoparietal network and another one with the DMN, while the third was not correlated with a specific RSN, being composed by regions in the middle orbitofrontal gyrus and olfactory cortex, probably part of the DMN.
Discussion and Conclusions
Consistently with our findings, connectivity within the DMN has been associated to mind wandering and attention lapses, and it has been shown to be coupled with alpha oscillations 9. Alpha synchronization has also been found to be positively correlated to cognitive functions associated with the frontoparietal network 10. Furthermore, a recent study found that this network had a diminished expression after the administration of psilocybin 8, while EEG studies with psilocybin have shown decreased parieto-occipital alpha power 11.By estimating dFC using phase coherence on high temporal resolution fMRI data, we were able to identify dFC states that were associated with high relative alpha power topographies (peaking in the parieto-occipital area around channel Pz). In particular, three dFC states with the greatest alpha power were obtained when considering a total of 9 dFC states. This association was nevertheless observed across different numbers of states, highlighting the consistency of this finding. These results provide further support to the electrophysiological underpinnings of fMRI dFC states, and in particular indicate a relationship with EEG alpha power.
Acknowledgements
We acknowledge the Portuguese Science Foundation (FCT) for financial support through Project PTDC/EEIELC/3246/2012 and the Grant LARSyS UID/EEA/50009/2013, and thank the support of Centre d'Imagerie BioMédicale (CIBM) of the UNIL, UNIGE, HUG, CHUV, EPFL and the Leenaards and Jeantet Foundations.References
1. M. G. Preti, T. A. Bolton, and D. V. D. Ville. The dynamic functional connectome: State-of-the-art and perspectives. NeuroImage, vol. 160,pp. 41-54, Oct. 2017.
2. R. Abreu, A. Leal, and P. Figueiredo. Identification of epileptic brain states by dynamic functional connectivity analysis of simultaneous EEG-fMRI: a dictionary learning approach. Scientific Reports, vol. 9, no. 1, Jan. 2019.
3. E. A. Allen, E. Damaraju, T. Eichele, et al. EEG signatures of dynamic functional network connectivity states. Brain Topography, vol. 31,no. 1, pp. 101-116, Feb. 2017.
4. J. Jorge, F. Grouiller, R. Gruetter, et al. Towards high-quality simultaneous EEG-fMRI at 7T: Detection and reduction of EEG artifacts due to head motion. NeuroImage, vol.120, pp. 143-153, Oct. 2015.
5. N. Tzourio-Mazoyer, B. Landeau, D. Papathanassiou, et al. Automated anatomical labeling of activations in SPM using a macroscopicanatomical parcellation of the MNI MRI single-subject brain. NeuroImage, vol. 15, no. 1, pp.273–289, Jan. 2002.
6. J. Cabral, D. Vidaurre, P. Marques, et al. Cognitive performance in healthy older adults relates to spontaneous switching between states of functional connectivity during rest. Scientific Reports, vol. 7, no. 1, Jul. 2017.
7. B. T. T. Yeo, F. M. Krienen, J. Sepulcre, et al. The organization of the human cerebral cortex estimated by intrinsic functional connectivity. Journal of Neurophysiology, vol. 106,no. 3, pp. 1125-1165, Sep. 2011.
8. L.-D. Lord, P. Expert, S. Atasoy, et al. Dynamical exploration of the repertoire of brain networks at rest is modulated by psilocybin. NeuroImage, vol. 199, pp. 127-142, Oct. 2019.
9. J. Mo, Y. Liu, H. Huang, et al. Coupling between visual alpha oscillations and default mode activity. NeuroImage, vol. 68, pp. 112-118, Mar.2013.
10. S. Sadaghiani, R. Scheeringa, K. Lehongre, et al. Alpha-band phase synchrony is related to activity in the fronto-parietal adaptive control network. Journal of Neuroscience, vol. 32, no. 41, pp.14 305-14 310, Oct. 2012.
11. M. Kometer, A. Schmidt, L. Jancke, et al. Activation of serotonin 2a receptors underlies the psilocybin-induced effects on oscillations , n170 visual-evoked potentials, and visual hallucinations. Journal of Neuroscience, vol. 33, no. 25,pp. 10 544-10 551, Jun. 2013.
Figures