3940
Measuring Aerobic Glycolysis with T2-relaxation-under-spin-tagging MRI and 18FDG PET: Preliminary Comparison with 15O PET1Research Imaging Institute, UT Health at San Antonio, San Antonio, TX, United States, 2Department of Radiology, Johns Hopkins University, Baltimore, MD, United States
Synopsis
Preliminary test of using T2 based CMRO2 measurement to measure aerobic glycolysis in human brain, with combination of TRUST MRI, phase contrast MRI and quantitative FDG PET. Preliminary quantative comparison and modeling of MR/PET (TRUST-PC-FDG) and PET/PET (O-15/FDG) aerobic glycolysis measurement.
INTRODUCTION
The brain has high Adenosine Triphosphate(ATP) demand, even in the resting state. Oxidative phosphorylation of glucose provides the great majority(~87%) of brain ATP.1 However, low levels of non-oxidative glucose metabolism (glycolysis) do occur, even in the presence of adequate blood oxygen, a phenomenon termed “aerobic glycolysis”.2 PET studies using 15O and 18F- fluorodeoxyglucose (18FDG) to measure cerebral metabolic rate of oxygen (CMRO2) and glucose (CMRGlu) have reported that relative rates of oxidative and non-oxidative glucose consumption are not uniform through the brain 2. Aerobic glycolysis rate is increased in default mode network (DMN) regions, which also exhibit age-related atrophy, amyloid deposition and decreased CMRGlu. Aerobic glycolysis rate is decreased in the thalamus, insular cortex and cerebellum3. Aerobic glycolysis rates decrease with age both regionally and whole-brain 4. Many tumors exhibit elevated aerobic glycolysis, termed the Warburg effect 5. Collectively, these observations argue that aerobic glycolysis may provide a quantitative index of brain pathophysiology, both in age-related disorders and in malignancies. 15O PET measurements of CMRO2 require an on-site cyclotron for production of 15O (T½ = 123 sec) and are logistical challenging, limiting its availability. To address this limitation, T2-relaxation-under-spin-tagging (TRUST) MRI, together with phase-contrast MRI, can be an alternative means for measuring whole-brain CMRO2 and, in combination with 18FDG PET (T½ = 110 min), of measuring aerobic glycolysis. The goal of this study was to test this TRUST-phase contrast-quantitative FDG strategy, via within-subject quantitative comparisons.METHODS
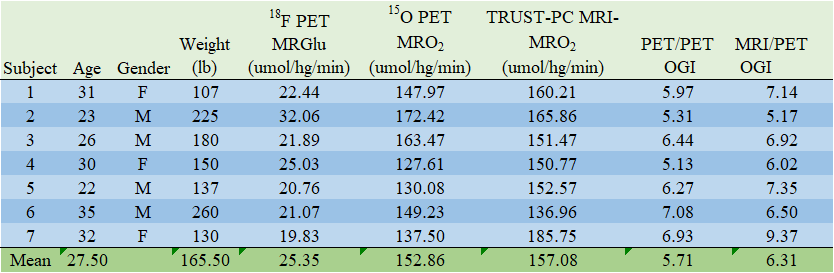
ParticipantsSeven healthy volunteers (4M/3F; 27.5±4.4years fasting state) underwent sequential MRI-CMRO2, PET-CMRO2 and PET-CMRGlu measurements on the same morning. Hematocrit, pulse oximetry, and fasting plasma glucose level were measured right before the scans.
MR Measurement
MRI was performed on a 3T Siemens Tim Trio with a 12-channel head coil. MRI measurements were made of: brain volume/weight (T1w MPRAGE), whole-brain blood flow (phase-contrast MRI), and venous oxygenation (TRUST), and were used to compute whole-brain MRI-CMRO2 6.
PET Measurements
PET-CMRO2 measurements used the classical three-tracer (O15O, C15O, H215O) method on an ECAT HR+ scanner, with the arterial input function (AIF) sampled from a radial artery catheter 7. 18FDG PET has performed dynamically(1 min frame up to 70 minutes), also with a radial-artery AIF. PET images were reconstructed with filtered back projection (15O) or maximum-likelihood estimation (18FDG) with 5 mm FWHM Gaussian smoothing. PET-CMRO2 and PET-CMRGlu images were computed in native space prior to spatial normalization (MNI space) for overlay. Oxygen-Glucose Index (OGI) was calculated as CMRO2/CMRGlu for both PET-CMRO2 and MRI-CMRO2 8. PET/PET OGI was computed in both voxel-wise and whole-brain manners. MRI/PET OGI was computed for whole-brain only, as an illustration for the feasibility of T2 based MR oxygenation methods for cerebral aerobic glycolysis measurements.
RESULTS
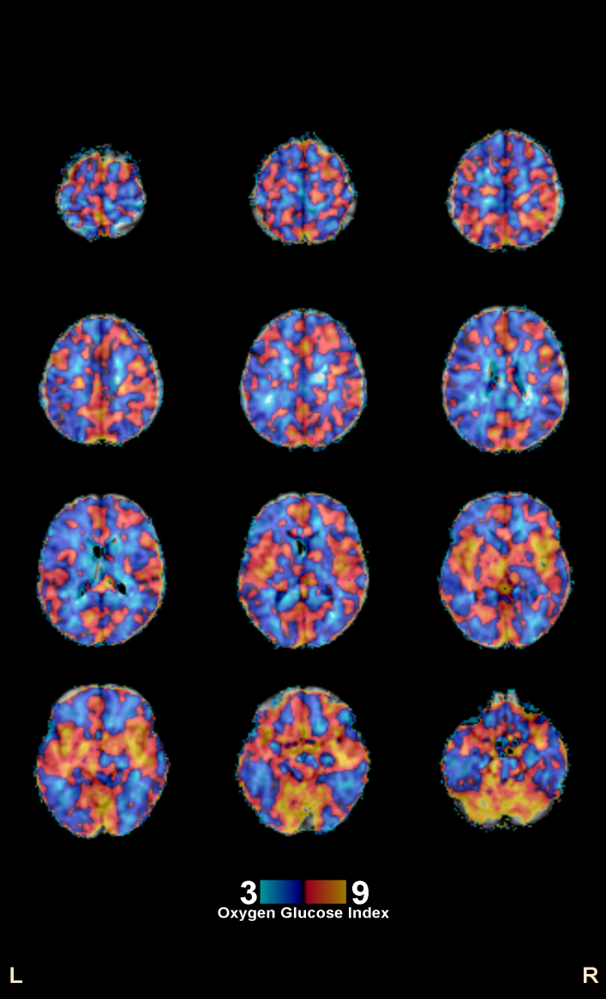
The PET/PET voxel-wise computation of OGI (Figure 1) replicated the previously reported spatial distribution 2, showing higher aerobic glycolysis (low OGI) in cingulate, parietal and frontal cortical regions and lower aerobic glycolysis (high OGI) in cerebellum, thalamus and insula. Whole-brain values for 18F PET CMRGlu, 15O PET CMRO2, TRUST MRI - CMRO2, PET/PET OGI, and MRI/PET OGI are shown in Figure 2. Values are within established ranges8, with the exception of MRI/PET OGI in subject 7. PET/PET OGI and MRI/PET OGI are relatively correlated (r = 0.67, bland-altman Bias and agreement analysis bias 0.76±0.98), shown in Figure 3.DISCUSSION
These preliminary results suggest that accurate, quantitative, whole-brain measurements of OGI can be made using the combination of TRUST MRI and 18FDG PET.There are two substantial advantages of the proposed method for assessing glucose pathway preference, relative to the traditional 15O PET/18F PET method: availability and convenience. As regards availability, MRI and 18F PET are widely available; 15O PET has limited availability. As regards convenience, 15O PET requires arterial catheterization (for AIF) and rapid (q 2-4 sec) sampling; TRUST MRI is entirely non-invasive. There is one substantial limitation of the MRI/PET approach: lack of resolution. TRUST MRI is a whole-brain measurement, which may limit its clinical utility that largely relies on demonstrating changes in regional patterns of aerobic glycolysis. PET/PET measurements, by contrast, allow voxel-wise computation of OGI and related metrics quantifying aerobic glycolysis.
Acknowledgements
No acknowledgement found.References
[1] Kety SS. (1957) The general metabolism of the brain in vivo. In: Richter D, editor. Metabolism of the nervous system. London: Pergamon:221–237.
[2] Shannon, Benjamin J., et al. (2016) Brain aerobic glycolysis and motor adaptation learning. Proc Nat Acad Sci (USA) 113.26: 3782-3791.
[3] Vaishnavi, S. Neil, et al. (2010) Regional aerobic glycolysis in the human brain. Proc Nat Acad Sci (USA) 107.41: 17757-17762.
[4] Goyal, Manu S., et al. (2017) Loss of brain aerobic glycolysis in normal human aging. Cell Metabolism 26.2: 353-360.
[5] Vander, Heiden, et al. (2009) Understanding the Warburg effect: the metabolic requirements of cell proliferation. Science 324.5930: 1029-1033.
[6] Lu, H. et al. (2012) Calibration and validation of TRUST MRI for the estimation of cerebral blood oxygenation. Mag Res Med 67.1: 42-49.
[7] Mintun, M. A., et al. (1984) Brain oxygen utilization measured with O-15 radiotracers and positron emission tomography. J Nuc Med 25.2: 177-187.
[8] Blazey, Snyder A Z, Goyal M S, et al. (2018) A systematic meta-analysis of oxygen-to-glucose and oxygen-to-carbohydrate ratios in the resting human brain. PloS one, 13(9): e0204242.
Figures