3939
Applying Neurophysiologically-Informed Calcium Photometry Data as Regressor for Task-Free fMRI: An Analysis Pipeline.1MAIC, German Resilience Center, Mainz, Germany, 2German Resilience Center, Mainz, Germany, 3Massachusetts Institute of Technology, Cambridge, MA, United States
Synopsis
We recently employed optically recorded slow oscillation-associated calcium waves as a linear regressor for simultaneously acquired task-free fMRI revealing a pan-cortical fMRI signature related to the active periods of the slow wave rhythm. Here, we provide a novel analysis pipeline for the synchronization of single events, as obtained by calcium photometry recordings, with fMRI scans usually requiring averaging over multiple trials. This synchronization poses unique problems, such as dealing with the inherent variability of the neurophysiological signal. The pipeline introduced here provides a step-by-step-approach within the framework of fast line scanning fMRI.
Introduction
We already put forward a novel concept on how to employ optically recorded slow oscillation-associated calcium waves as a regressor for simultaneously acquired task-free fMRI. In the context of slow oscillations, we found a pan-cortical fMRI signature using those slow wave events as regressors. Here, we provide an analysis pipeline on how to relate a method with single event resolution, such as optical calcium recordings, with a method such as fMRI requiring averaging over multiple trials. This poses unique problems, such as dealing with the inherent variably of neurophysiological signal. What is more, the signal of interest (SoI) needs to be contrasted with a time epoch, in which neither the SoI occurs, nor other unrelated neuronal activity, all of which would render the analysis obsolete. Here, we present a generalizable analysis pipeline, commencing with the extraction of a regressor from calcium photometry data, within the framework of fast line scanning (ls-)fMRI in slow wave brain state.Experimental Setup
Optical Recordings of Neuronal ActivityWe used optic-fiber-based calcium recordings with 2kHz sample rate. The synthetic calcium indicator OGB-1 was bolus-loaded in layer II/III of both visual cortices (AP:-5.5;ML:+/-3.8;DV:0.9,0.7,0.5) of 8 female Lewis rats (~220g). Subsequently, an optic fiber was implanted in one hemisphere of the visual cortex (V1). For visual stimulation, a light flash (duration of 10ms) was delivered every 10s to both eyes. The rats were deeply anesthetized by isoflurane (2.0-2.4%) to maintain a stable slow wave brain state.
Fast Functional MRI
We used the ls-fMRI approach (1) on a 9.4T MR system (Bruker BioSpin, Germany). For this, a 2D-Flash sequence without phase encoding, restricted Field of View (FOV) by saturation slabs, and (TR, TE=50/18ms) was used. The line was placed in anterior-posterior axis along the cortex.
Analysis Pipeline
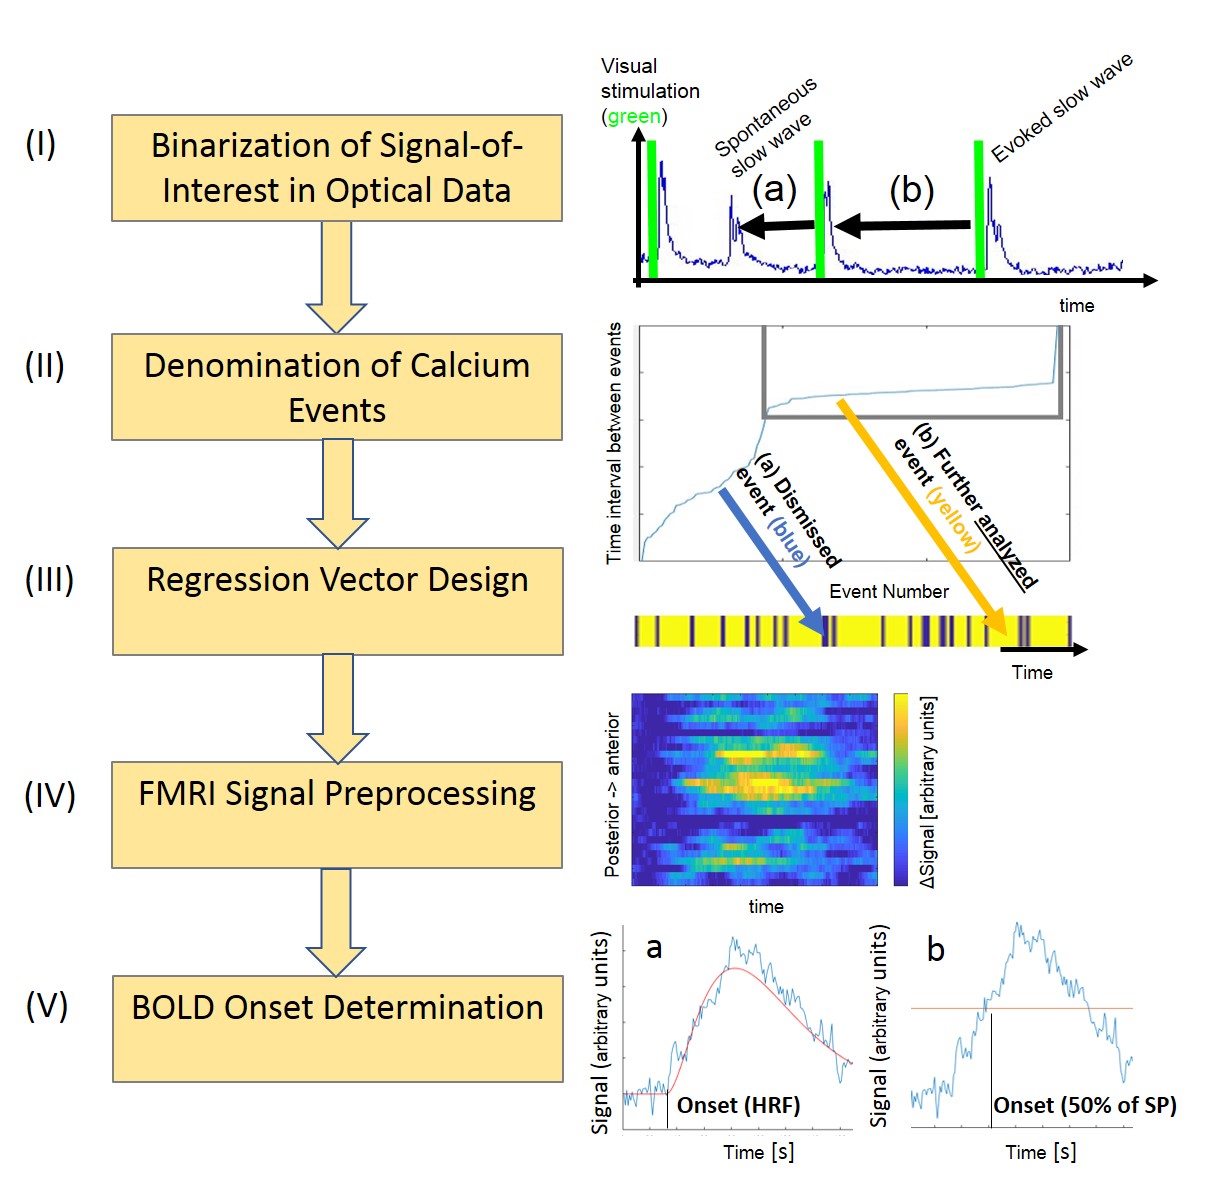
Per animal, 128 trials comprising a visual stimulus followed by a 10s pause were conducted. We observed characteristic individual slow wave events, occurring both spontaneously, as well as evoked by visual stimulation in an all-or-none manner (2). The goal of the pipeline in this example was to reveal the ls-fMRI correlated of visually evoked travelling calcium waves. The pipeline commences by extracting the event of interest, in our case slow-oscillations-associated calcium waves, from the traces. For that, we employed a signal detection algorithm as put forward by Seamari et al. (3), and as previously published (4), identifying the onset of each slow wave. We call this step “1 Binarization of Signal-of-Interest in Optical Data”, yielding a binarized vector. Importantly, this cleans the trace of any non-specific events. However, identifying the SoI is not sufficient, as employing a task-related design mandates a clean baseline. We next proceed to the “2 Denomination of Calcium Events” step of the pipeline. The detected slow wave events were sorted into evoked (within a time interval of 400ms after visual stimulation) and spontaneous slow waves. Thirdly, in the “3 Regression Vector Design” step, we create a vector containing only time epochs, in which only those visually evoked slow waves are retained which were neither followed nor preceded by a spontaneous slow wave within a 10s time interval. This step addresses the mismatch of fast recordings with single event resolution, as afforded by optical recording, and the fMRI analysis requiring averaging of the entire recording period of 20mins. For that, it is critical, to avoid contamination. What is more, if a BOLD response arises in response to a slow wave, its duration ranges at 7s, so any subsequent neurophysiological event in this time period would lead to superimposed BOLD signal. Fourthly, we now transition to the BOLD signal, in the “4 fMRI Signal Preprocessing” step, applying standard routines such as filtering and averaging of the mean signal time course per voxel. Notably, we analyze only those time periods of the BOLD signal time course, which correspond to the time periods of the regression vector, see step 3. Finally, in the “5 BOLD Onset Determination” step, we need to determine the timepoint or onset of the BOLD response, as this time point seems to correlate best with the temporal dynamics of the underlying neuronal activity (see (1)). For that, we provide two synergistic approaches: a) deriving the onset of the BOLD response upon first modelling an HRF to the BOLD signal courses of each voxel, b) determining the time point, where the signal exceeds 50% of signal peak from baseline. Now, it is possible to relate the temporal relation of the local optical recorded SoI to the onset of each voxel in the FOV. In our example, this leads to the identification of the BOLD correlate of a travelling calcium wave.Discussion
Here, we present an analysis pipeline for simultaneously recorded fMRI and optical calcium recordings. Analyzing these related signals requires specific routines taking into account the unique signal characteristics of each modality. By identifying distinct signal components in the neurophysiologically-informed calcium photometry data and using those data to construct a regression vector, we can extract the very component in the fMRI signal, which is evoked by these events. This might pave the way for translational studies bridging the gap between temporally high-resolved yet local optical recordings and brain wide fMRI.Acknowledgements
No acknowledgement found.References
(1) Yu X, Qian C, Chen DY, Dodd SJ, Koretsky AP. Deciphering lamina-specific neural inputs with line-scanning fMRI. Nat Methods. 2014 Jan;11(1):55-8.
(2) Stroh A, Adelsberger H, Groh A, Rühlmann C, Fischer S, Schierloh A, Deisseroth K, Konnerth A. Making waves: initiation and propagation of corticothalamic CA2+ waves in vivo. Neuron. 2013 Mar 20; 77(6): 1136-50.
(3) Seamari Y, Narvaez JA, Vico FJ, Lobo D, Sanchesz-VivesMV. Robust off- and online separation of intracellularly recorded up and down cortical states. PLoS One, 2007, 2, e888;
(4) Schwalm M, Schmid F, Wachsmuth L, Backhaus H, Kronfeld A, Aedo Jury F, Prouvot PH, Fois C, Albers F, van Alst T, Faber C, Stroh A. Cortex-wide BOLD fMRI activity reflects locally recorded slow oscillation-associated calcium waves. Elife. 2017 Sep 15;
Figures