3938
Predicting Blood-oxygenation-level Dependent Signal from Local Field Potentials Using Recurrent Neural Networks1Biomedical Engineering, Emory University/Georgia Institute of Technology, Atlanta, GA, United States
Synopsis
We implemented a stacked long short-term memory neural network to predict the blood-oxygenation-level dependent signal from the band-limited power of local field potentials in a variety of frequencies. The model was trained with simultaneously acquired resting state fMRI and LFP data from rats under Isoflurane anesthesia. The results show that the model prediction has a higher Pearson correlation with the ground truth of BOLD signal than the LFP band-limited power in any frequency bands.
Introduction
Recent studies have shown the blood-oxygenation-level dependent (BOLD) signal in resting-state fMRI is correlated with the power modulations of the local field potential (LFP) under various conditions1-5. It is often reported that the LFP gamma band contains the most relevant information to the BOLD signal, but there are studies showing that other frequency bands can dominate in some conditions. The current methods typically consider a single frequency at a time, which may overlook the hidden relationship among these frequency bands. The recent advancement of deep learning provides promising tools to solve this problem. Here we proposed a stacked long short-term memory (LSTM)6 neural network to predict BOLD using the information from the LFP power in all frequency bands.Methods
Experiments: Resting state-fMRI scans and LFP recordings were acquired simultaneously on 12 Sprague-Dawley rats under Isoflurane (ISO) ranging from 1.2% to 2%. Single slice gradient echo EPI scans were obtained on a 9.4T small animal MRI system (Bruker, Billerica, MA) with scan parameters: TR/TE=500/15ms, voxel size=0.3x0.3x2mm, matrix size=64x64, repetitions=1000. LFPs were recorded using glass electrodes placed on the primary somatosensory cortex (S1) in both hemispheres at a sampling rate of 12KHz. A total of 32 scan sessions were acquired, resulting in 32,000 time points in the fMRI data.FMRI preprocessing: Motion-correction, spatial smoothing (FWHM=0.84mm), bandpass filtering (0.01~0.1Hz), global signal and linear trend regression were performed sequentially. A region of interest (ROI) in left S1 area was selected.
LFP preprocessing: The band-limited power time courses were calculated using sliding window method (window length = 1 sec, step size = 0.5 sec, which matches the fMRI temporal resolution) in 6 frequency bands: delta 1~4Hz, theta 4~8Hz, alpha 8~12Hz, low frequency beta 12~25Hz, high frequency beta 25~40Hz, gamma 40~100Hz. Then the band-limited power time courses were band pass filtered (0.01~0.1Hz).
Data preparation: Each scan was evenly divided into 5 segments. The resulting 160 segments were shuffled and split into training set (N=110), validation set (N=20) and testing set (N=30). For each minibatch of size N_batch, the LFP power input is a [N_batch x 200 x 6] vector, and the BOLD prediction output is a [N_batch x 200 x 1] vector.
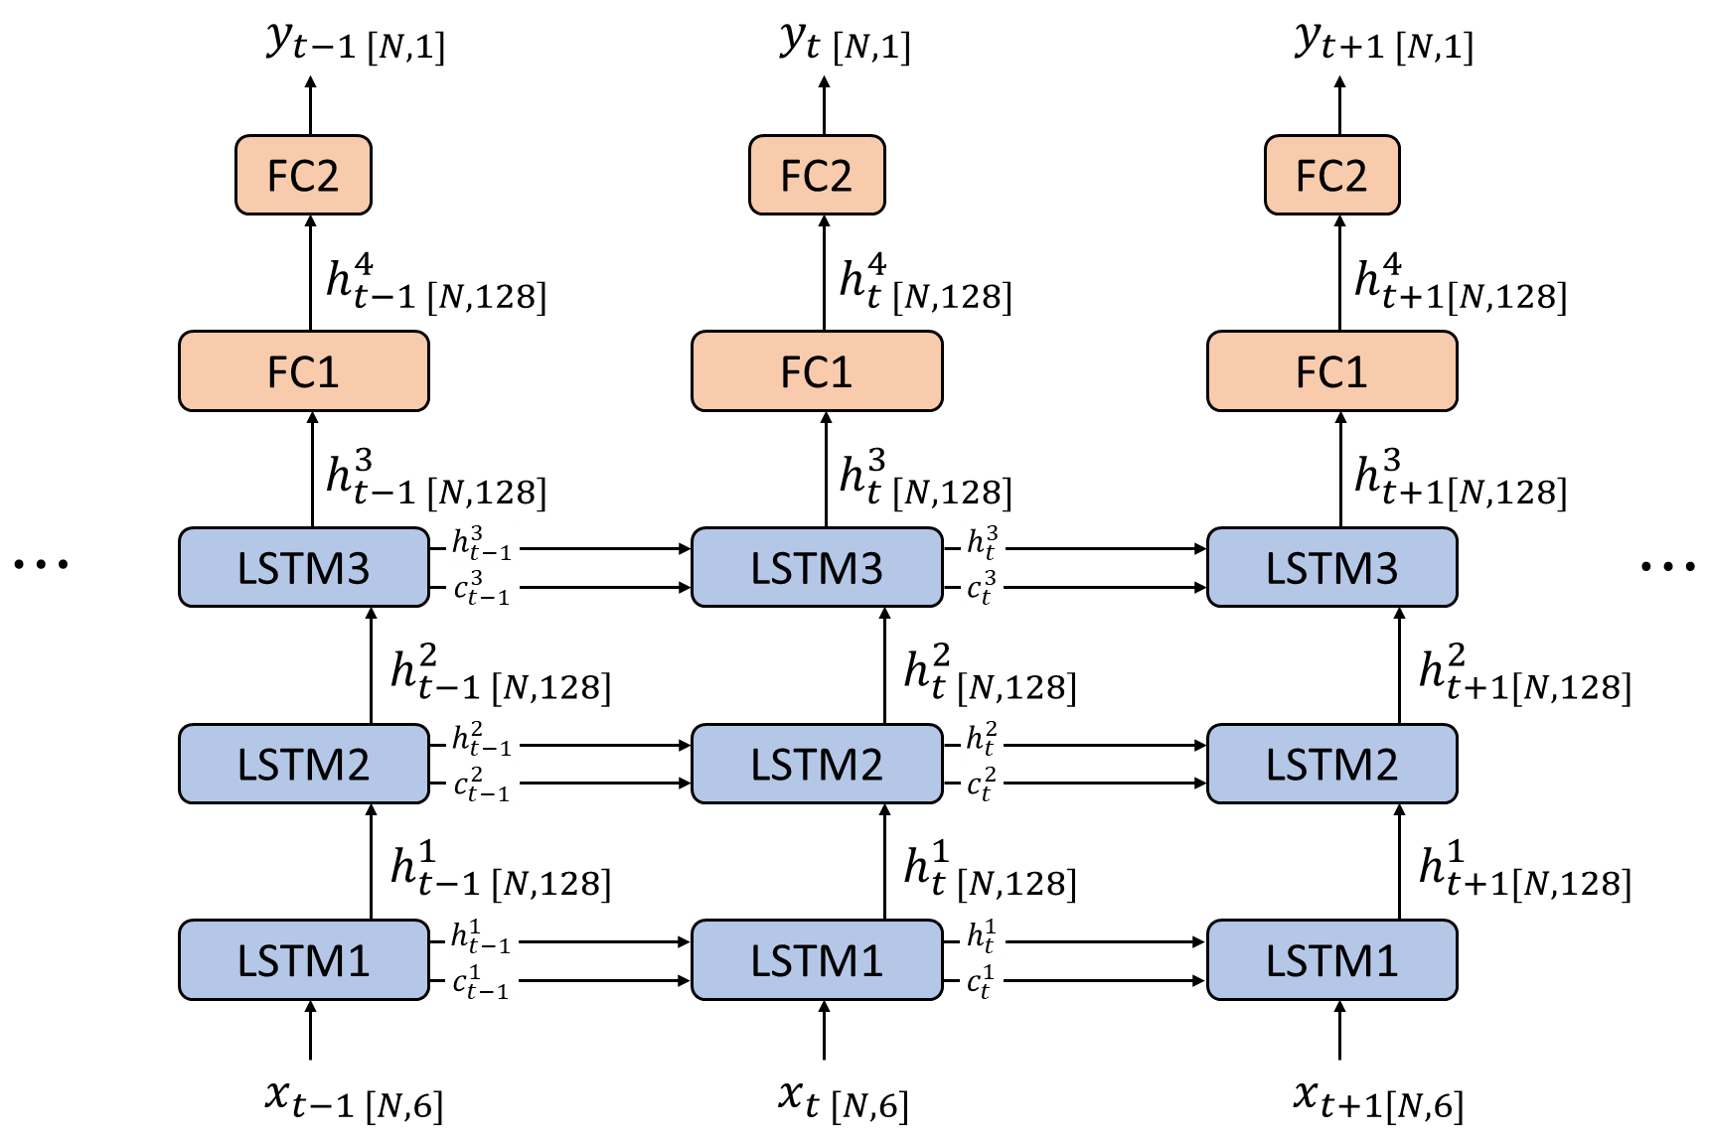
Network Architecture: The neural network was implemented using Tensorflow7. A stacked LSTM neural network was used in this study, which consists of three LSTM layers (128 hidden units, dropout probability=0.2), and two fully-connected layer (FC1, 128 units, dropout probability=0.5, hyperbolic tangent function (tanh) as the activation function; and FC2, 1 unit). The detailed network architecture is illustrated in figure 1.
Training Details: The network was trained on a NVIDIA GTX1060 GPU for 20 epochs. The adaptive moment estimation (Adam)8 algorithm was used for the optimizer, with batch size=10, learning rate=0.001, beta1=0.9, beta2=0.999. The loss function minimized during training was the mean squared error between the predicted BOLD value and the ground truth of BOLD value.
Results and Discussion
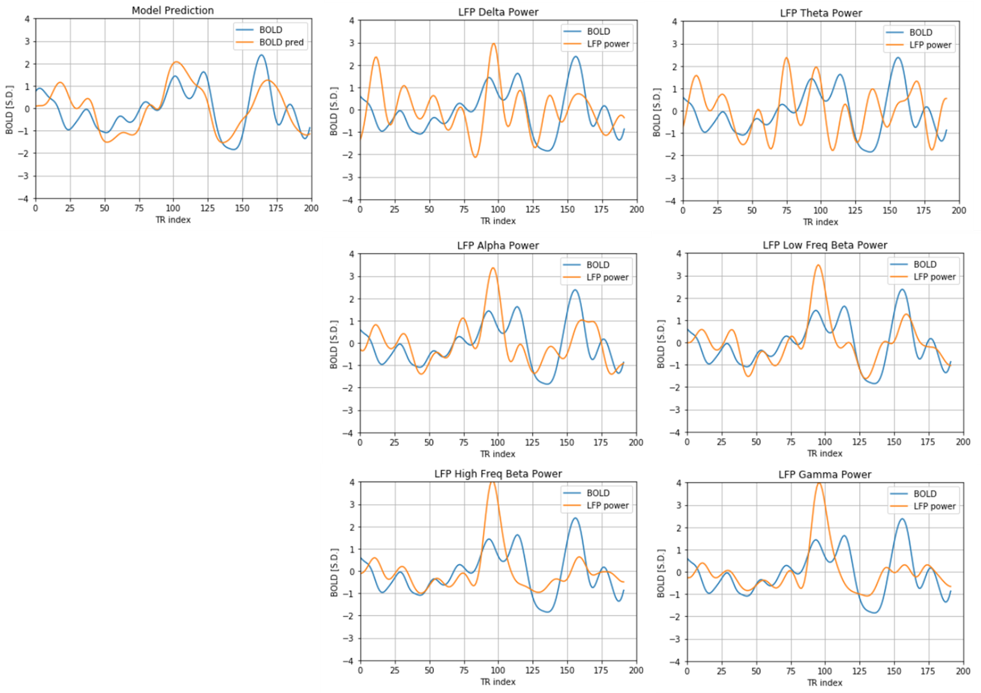
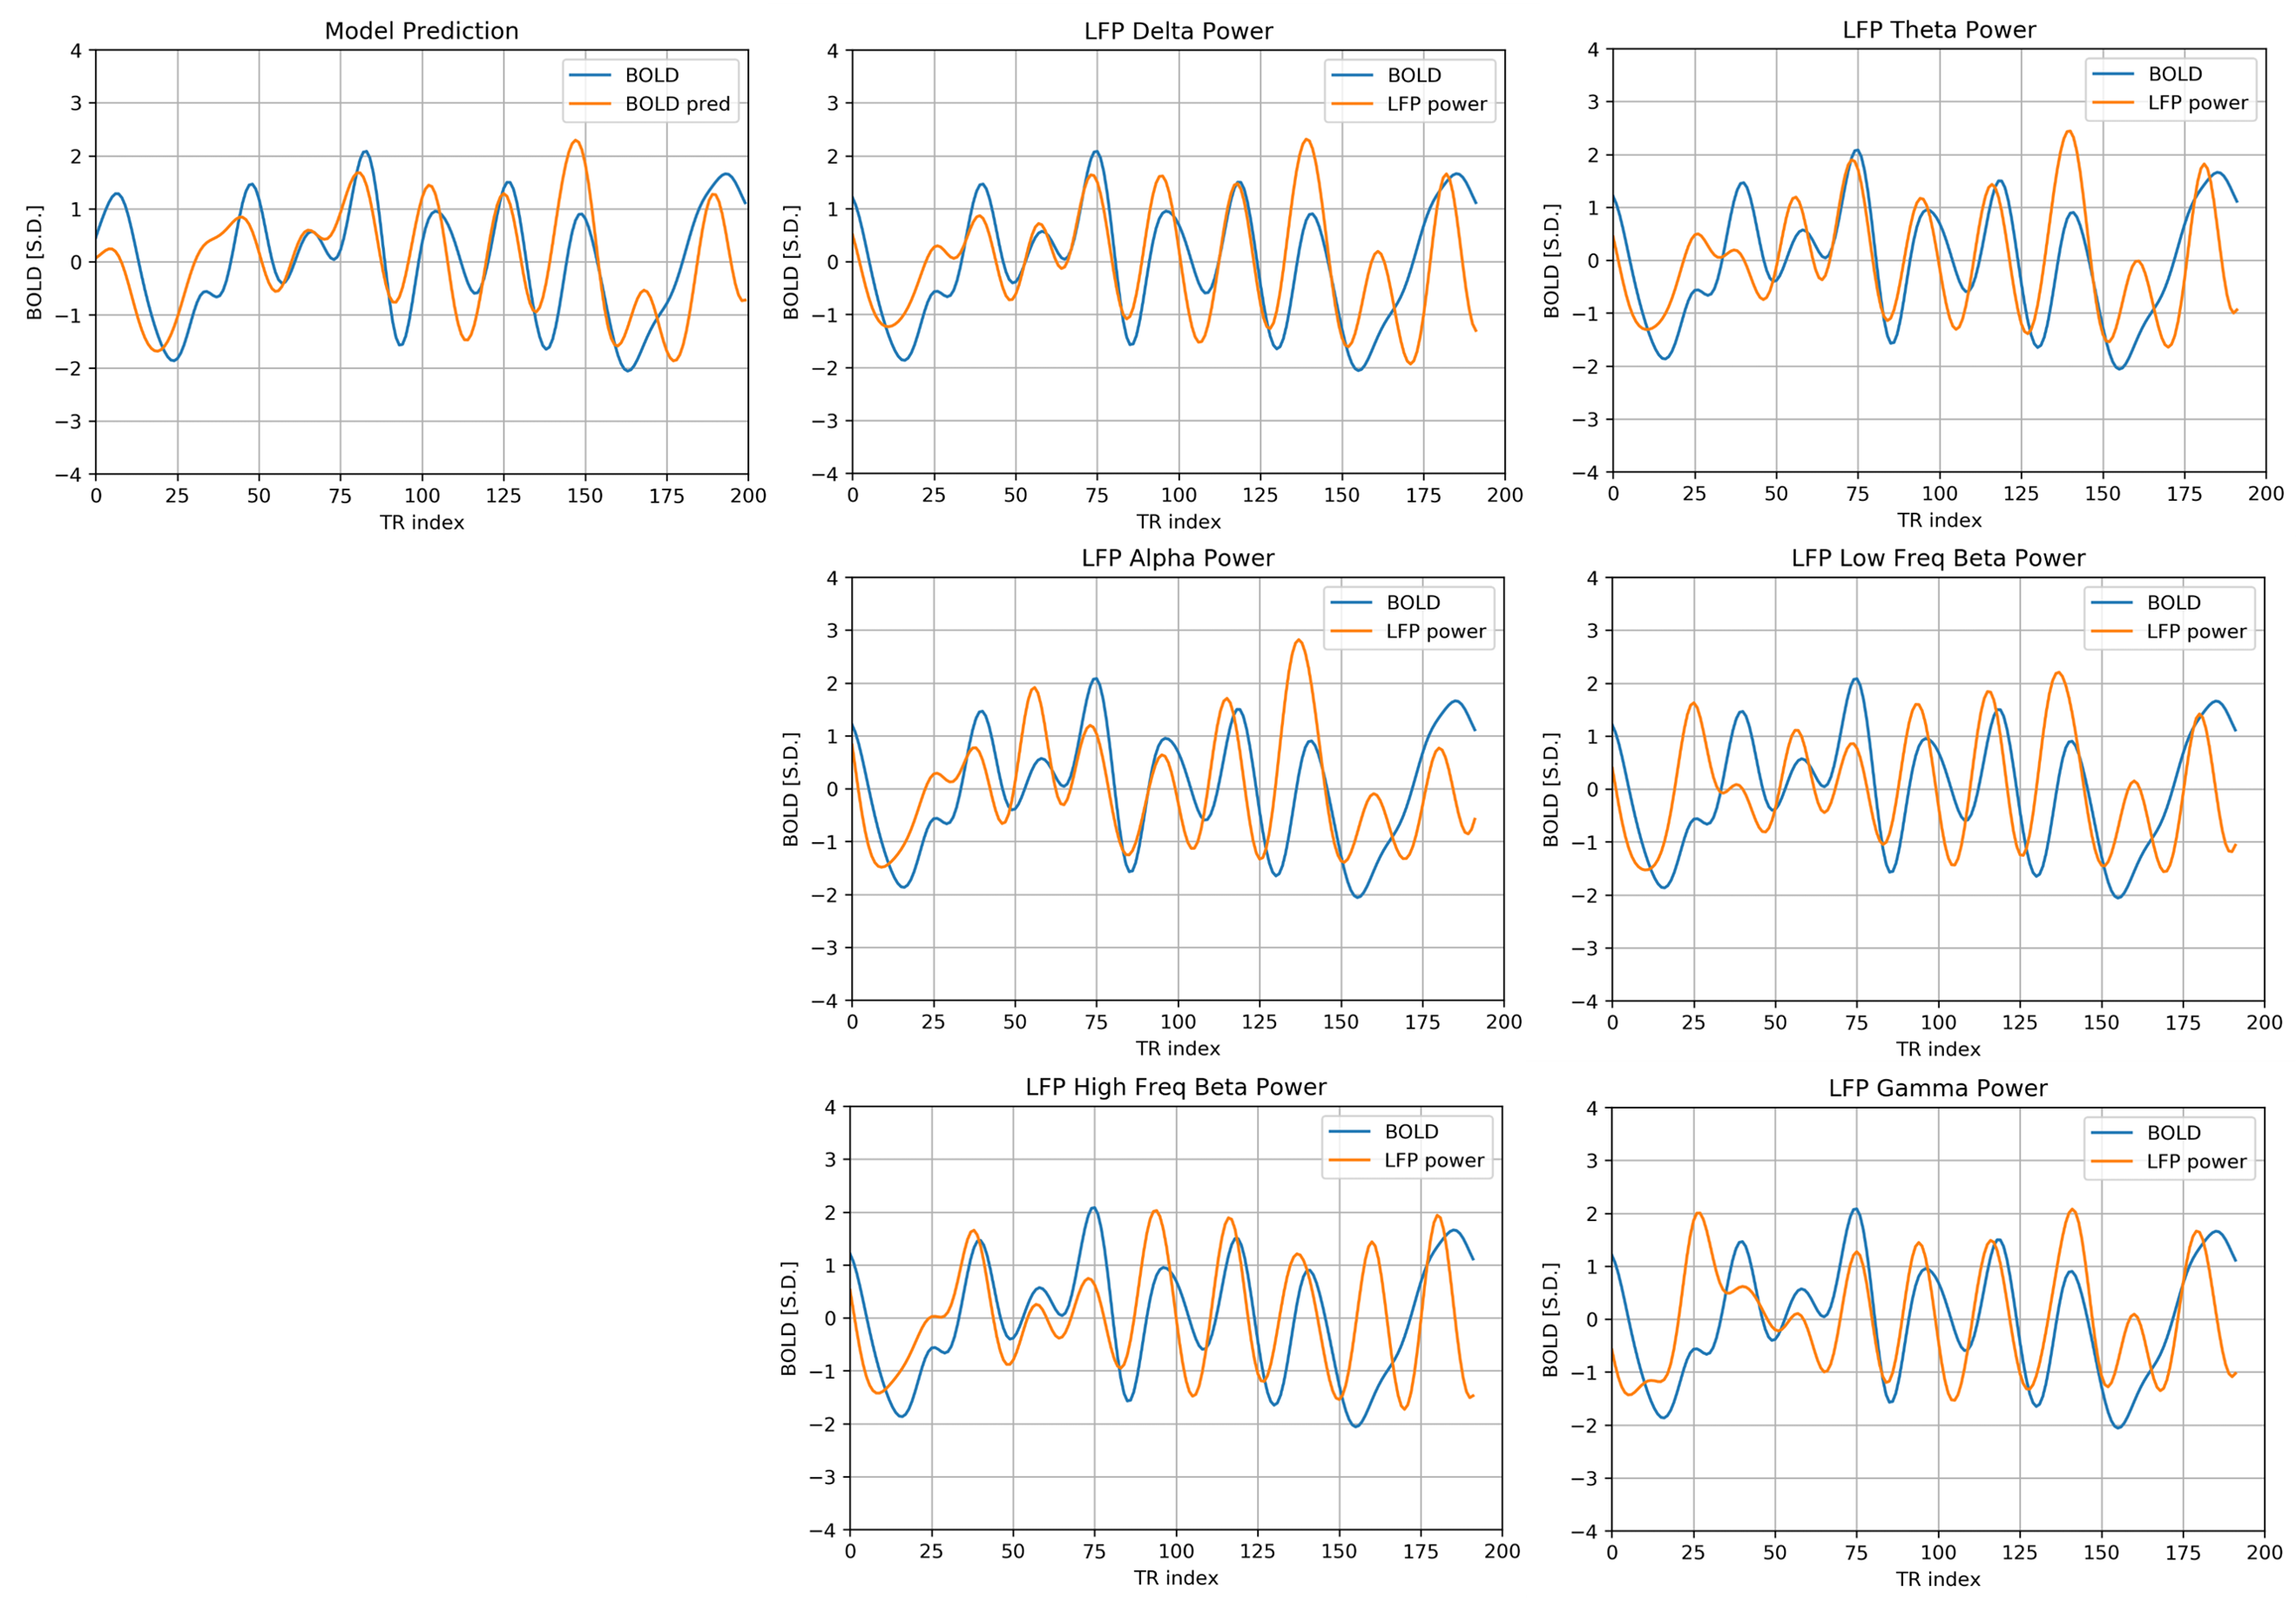
Figure 2 and figure 3 show that the predicted BOLD shows a general trend that matches with the ground truth in both the training dataset and testing dataset. To quantitatively assess the performance, Pearson correlation coefficient between the predicted BOLD and the ground-truth BOLD was calculated. In the training set, the correlation reaches 0.5072. In the testing set, the correlation is 0.4292, which is still considerably high since the performance in the testing set is typically worse than the training set. For comparison, Pearson correlation coefficients between the band-limited power and the ground-truth BOLD were also calculated for the 6 frequency bands (listed in table 1). Note that the highest correlation coefficient in the band-limited power time courses (0.3788, obtained by the low frequency beta band) is still lower than our model predictions.An interesting phenomenon is that there is a time lag of 4 seconds between LFP power and BOLD because of the delay in the hemodynamic response. Although the delay is not explicitly build into the model, the network clearly learns that there is an intrinsic delay between the two sequences during the training process, by storing the “memory” of the previous LFP in the hidden state of LSTM. As a result, we need to manually adjust the time lag when calculating the Pearson correlation for the band-limited power, but for the model predictions, this lag has already been taken care of by the model itself.
Conclusion
We implemented a recurrent neural network to predict the BOLD signal based on the LFP band-limited power in six frequency bands. The predicted BOLD has a higher correlation with the ground truth than the LFP power in any of the frequency bands. However, there are still a few problems in the current model. First, neural networks are typically trained on a very large amount of data, but since data with simultaneous acquisition of LFP and fMRI is extremely limited, the number of parameters should be small to avoid overfitting, which limits the expressive power of the model. Also using more advanced architectures, predicting BOLD based on raw LFP traces instead of the downsampled LFP power, and including physiology recordings in network inputs may further increase the performance in the future and help us to better understand the complex neurovascular coupling mechanism.Acknowledgements
Funding sources: NIH 1 R01NS078095-01, BRAIN initiative and NSF INSPIRE. The authors would like to thank Chinese Scholarship Council (CSC) for financial support.References
1. Logothetis NK, Pauls J, Augath M, et al. Neurophysiological investigation of the basis of the fMRI signal. Nature. 2001;412(6843):150.
2. Lu H, Zuo Y, Gu H, et al. Synchronized delta oscillations correlate with the resting-state functional MRI signal. Proceedings of the National Academy of Sciences. 2007;104(46):18265-9.
3. Shmuel A, Leopold DA. Neuronal correlates of spontaneous fluctuations in fMRI signals in monkey visual cortex: implications for functional connectivity at rest. Human brain mapping. 2008;(7):751-61.
4. Pan WJ, Thompson G, Magnuson M, et al. Broadband local field potentials correlate with spontaneous fluctuations in functional magnetic resonance imaging signals in the rat somatosensory cortex under isoflurane anesthesia. Brain connectivity. 2011;1(2):119-31.
5. Magri C, Schridde U, Murayama Y, et al. The amplitude and timing of the BOLD signal reflects the relationship between local field potential power at different frequencies. Journal of Neuroscience. 2012;32(4):1395-407.
6. Hochreiter S, Schmidhuber J. Long short-term memory. Neural computation. 1997;9(8):1735-80.
7. Abadi M, Agarwal A, Barham P, et al. Tensorflow: Large-scale machine learning on heterogeneous distributed systems. arXiv preprint arXiv:1603.04467. 2016 Mar 14.
8. Kingma DP, Ba J. Adam: A method for stochastic optimization. arXiv preprint arXiv:1412.6980. 2014 Dec 22.
Figures