3934
Pushing the limits of EEG: estimation of large-scale functional networks and their dynamics validated by simultaneous fMRI1Coimbra Institute for Biomedical Imaging and Translational Research (CIBIT), University of Coimbra, Coimbra, Portugal, 2Center for Informatics and Systems (CISUC), University of Coimbra, Coimbra, Portugal
Synopsis
Resting-state networks (RSNs) have been identified on continuous source-reconstructed EEG data (electrical source imaging; EEG-ESI data), but their validation with simultaneous fMRI data is missing. Here, we found a comparable overlap with previous literature between EEG-ESI-derived RSNs and simultaneous fMRI-derived RSNs from 10 subjects. We showed the ability of EEG-ESI to map the task-specific facial expression processing network, and extracted dynamic functional connectivity (dFC) states from EEG-ESI and fMRI, founding a significant match between them. Our results push the limits of EEG towards being used as an imaging tool and support the existence of EEG correlates of fMRI-derived (d)FC.
Introduction
fMRI is the gold standard for detecting large-scale functional networks and to investigate their dynamics. Because fMRI measures brain activity indirectly, EEG has been used for detecting such networks, particularly the resting-state networks (RSNs)1,2. However, an unbiased validation of such claims is missing, which can be only accomplished by considering simultaneously acquired EEG and fMRI data, due to the spontaneous nature of the activity underlying the RSNs. Additionally, EEG has neither been explored for the purpose of mapping task-specific networks, nor for studying networks’ dynamic functional connectivity (dFC). Here, we started by validating EEG-derived RSNs by comparing them with simultaneous fMRI-derived RSNs from 10 subjects. Then, we mapped the facial expressions processing network (FEPN) and extracted dynamic functional connectivity (dFC) states using EEG for the first time, and compared the associated results with those obtained from the fMRI data.Methods
Data acquisition and pre-processing: Ten healthy subjects were studied on a 3T MRI system (Siemens) using an MR-compatible 64-channel EEG system (NeuroScan). BOLD-fMRI (2D-EPI, TR/TE=2000/30 ms) was acquired concurrently with EEG during four runs: a functional localizer, and three neurofeedback runs3. EEG data were MR-induced artefact corrected4,5 and band-pass filtered (1-45 Hz), and fMRI data were subjected to advanced pre-processing steps6.Continuous electrical source imaging: The 3D sources responsible for generating the scalp distribution of electrical potentials at each EEG time-point were reconstructed using continuous electrical source imaging (cESI), with the following steps1: 1) realistic head models from the segmentation of the structural images into 12 tissues (MIDA template7); 2) electrode positions manually adjusted to match the distortions on the structural images; 3) volume conduction model built using finite element models8; 4) solution space defined as a 4mm 3D grid spanning the cortical grey matter; 5) inverse solution solved using the exact low-resolution electromagnetic tomography (eLORETA) algorithm9; and 6) downsampling of the source time-courses to 1 Hz, yielding the EEG-ESI data.
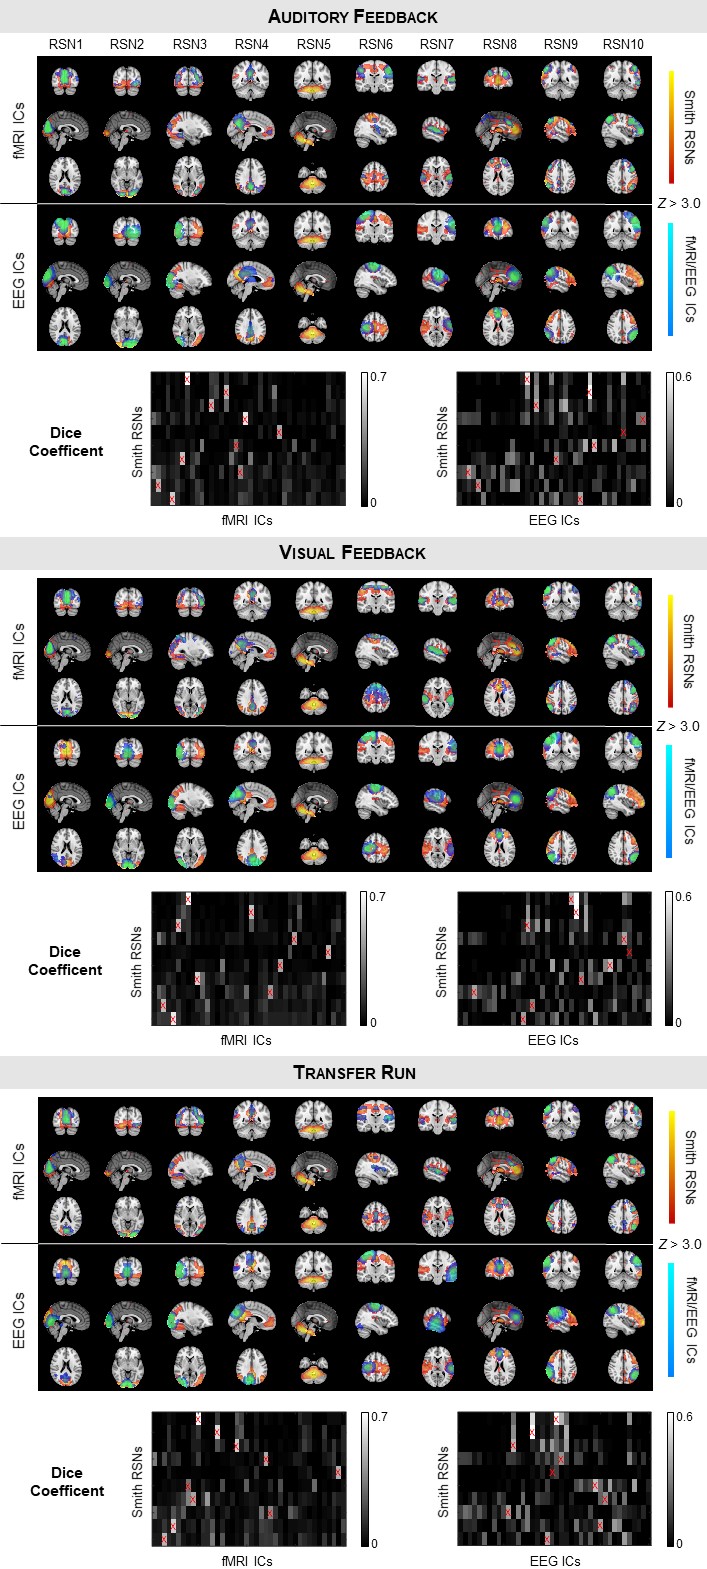
Identification of RSNs: Group-level spatial independent component analysis (sICA) decomposition of EEG-ESI and fMRI data was performed for each run, whereby the data of all subjects are first concatenated in time. 10 well-known RSNs were identified among the EEG-ESI and fMRI independent components based on their spatial overlap (quantified by the Dice coefficient) with 10 RSN templates10.
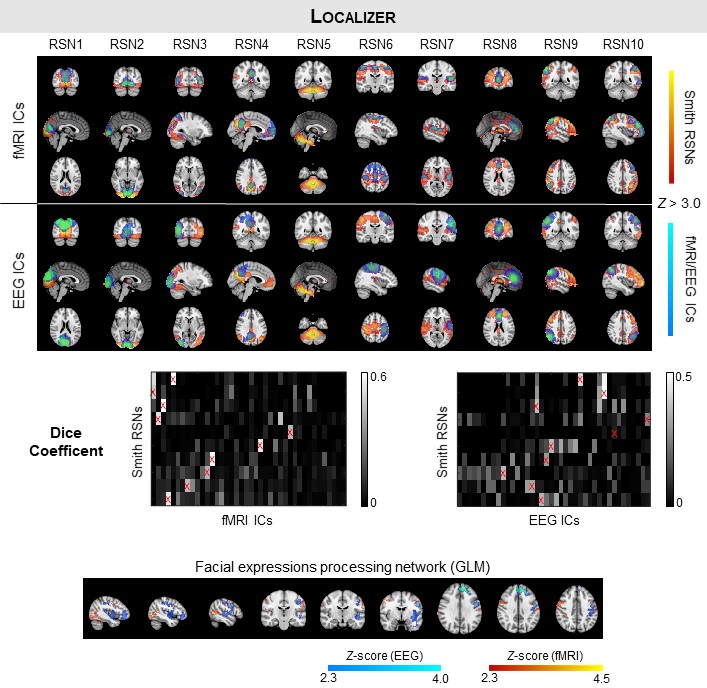
Mapping of the FEPN: The FEPN was mapped using a GLM with boxcar functions modelling each condition presented during the functional localizer: facial expressions (sad, happy, and alternated), neutral and random motion of white dots. In contrast with the EEG-ESI data, the fMRI regressors were additionally convolved with a canonical HRF to account for the hemodynamic delay. The respective GLMs were fitted11, and voxels exhibiting significant signal changes when contrasting the facial expression conditions with the neutral and motion conditions were identified (voxel Z > 2.7, cluster p < 0.007). Group activation maps were obtained using mixed-effects modelling12.
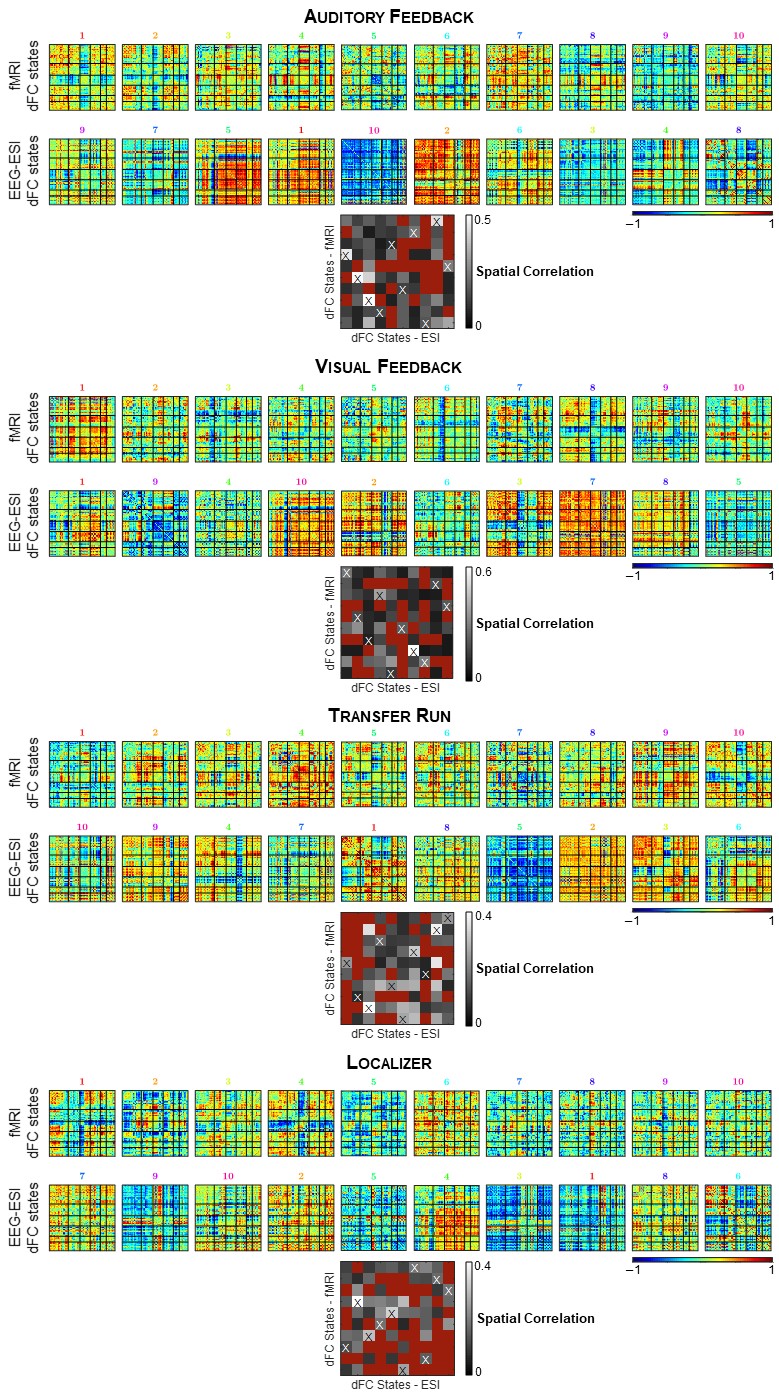
Identification of dFC states: For each run, the dFC was estimated by parceling the brain using the automated anatomical labeling (AAL) atlas into R=90 regions, averaging the EEG-ESI and BOLD-fMRI signals within each parcel, and computing the pair-wise Pearson correlation coefficient across all parcels using a sliding-window approach (window length=40 / 42 s, step=5 / 6 s for the EEG-ESI and fMRI data, respectively)13. dFC states were estimated using an l1-norm regularized dictionary learning approach14,15: each state is characterized by a RxR correlation matrix, and a time-course denoting its contribution over time. A one-to-one match between the EEG-ESI and fMRI dFC states was determined by computing the pairwise spatial correlation between the associated correlation matrices, and identifying the dFC state pairs with the highest, and statistically significant correlation (p < 0.05).
Results
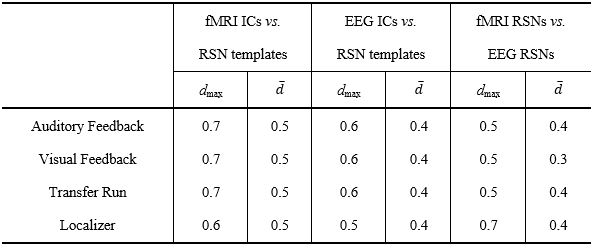
The RSNs identified on the EEG-ESI and fMRI data with sICA, superimposed with the RSN templates, are shown in Fig. 1 for the three neurofeedback runs, and in Fig. 2 for the localizer run. A substantial overlap (Table 1) between the identified RSNs and the templates is observed for all RSNs and imaging techniques; an average Dice coefficient (across runs and dFC states) of 0.4 between EEG-ESI and fMRI RSNs was obtained, comparable with previous literature1,2. The FEPN mapped with EEG-ESI and fMRI is shown in Fig. 2, with a notable overlap at the postcentral sulcus and posterior superior temporal sulcus, the latter where FEPN is anchored. The fMRI dFC states and their matched EEG-ESI dFC states are shown in Fig. 3 for the neurofeedback and localizer runs. A statistically significant match was obtained for all dFC states, with an average spatial correlation (across runs and dFC states) of 0.3.Conclusion
We validated in an unbiased manner the existence of RSNs reflected on both EEG and fMRI data, and showed that EEG can be used for mapping task-specific networks (particularly the FEPN), as well as to study the dynamics of functional networks and extract their representative dFC states. Our results support the emerging literature on EEG correlates of (d)FC measured with fMRI, and push the limits of EEG towards being used as a brain imaging tool, which allows researchers and clinics to more efficiently leverage the high temporal resolution, low cost, portability and ease of use that characterize the EEG.Acknowledgements
This work was supported by Grants Funded by Fundação para a Ciência e Tecnologia, PAC –286 MEDPERSYST, POCI-01-0145-FEDER-016428, BIGDATIMAGE, CENTRO-01-0145-FEDER-000016 financed by Centro 2020 FEDER, COMPETE, FCT UID/4539/2013 – COMPETE, POCI-01-0145-FEDER-007440, CONNECT.BCI POCI-01-0145- FEDER-30852.References
1. Liu, Q., Ganzetti, M., Wenderoth, N. & Mantini, D. Detecting Large-Scale Brain Networks Using EEG: Impact of Electrode Density, Head Modeling and Source Localization. Front. Neuroinform. 12, 1–11 (2018).
2. Liu, Q., Farahibozorg, S., Porcaro, C., Wenderoth, N. & Mantini, D. Detecting large-scale networks in the human brain using high-density electroencephalography. Hum. Brain Mapp. 38, 4631–4643 (2017).
3. Direito, B. et al. Targeting dynamic facial processing mechanisms in superior temporal sulcus using a novel fMRI neurofeedback target. Neuroscience 406, 97–108 (2019).
4. Allen, P. J., Josephs, O. & Turner, R. A method for removing imaging artifact from continuous EEG recorded during functional MRI. Neuroimage 12, 230–239 (2000).
5. Abreu, R. et al. Ballistocardiogram artifact correction taking into account physiological signal preservation in simultaneous EEG-fMRI. Neuroimage 135, 45–63 (2016).
6. Abreu, R., Nunes, S., Leal, A. & Figueiredo, P. Physiological noise correction using ECG-derived respiratory signals for enhanced mapping of spontaneous neuronal activity with simultaneous EEG-fMRI. Neuroimage 154, 115–127 (2017).
7. Iacono, M. I. et al. MIDA: A Multimodal Imaging-Based Detailed Anatomical Model of the Human Head and Neck. PLoS One 10, e0124126 (2015).
8. Wolters, C. H., Grasedyck, L. & Hackbusch, W. Efficient computation of lead field bases and influence matrix for the FEM-based EEG and MEG inverse problem. Inverse Probl. 20, 1099–1116 (2004).
9. Pascual-Marqui, R. D. et al. Assessing interactions in the brain with exact low-resolution electromagnetic tomography. Philos. Trans. R. Soc. A Math. Phys. Eng. Sci. 369, 3768–3784 (2011).
10. Smith, S. M. et al. Correspondence of the brain’s functional architecture during activation and rest. Proc. Natl. Acad. Sci. U. S. A. 106, 13040–13045 (2009).
11. Woolrich, M. W., Ripley, B. D., Brady, M. & Smith, S. M. Temporal autocorrelation in univariate linear modeling of FMRI data. Neuroimage 14, 1370–86 (2001).
12. Beckmann, C. F., Jenkinson, M. & Smith, S. M. General multilevel linear modeling for group analysis in FMRI. Neuroimage 20, 1052–1063 (2003).
13. Hutchison, R. M. et al. Dynamic functional connectivity: promise, issues, and interpretations. Neuroimage 80, 360–78 (2013).
14. Mairal, J., Bach, F., Ponce, J. & Sapiro, G. Online Learning for Matrix Factorization and Sparse Coding. J. Mach. Learn. Res. 11, 19–60 (2010).
15. Abreu, R., Leal, A. & Figueiredo, P. EEG microstate and spectral signatures of epileptic patterns found in fMRI dynamic functional connectivity. in Proc. 26th Annual Meeting of the International Society for Magnetic Resonance in Medicine (ISMRM 2018) (2018).
Figures