3933
EEG-fMRI at 9.4T: Safety assessment and effect on B0, B1 and fMRI scans in a phantom1Department for High-field Magnetic Resonance, Max Planck Institute for Biological Cybernetics, Tuebingen, Germany, 2Brain Products GmbH, Gilching, Germany, 3Easycap GmbH, Herrsching, Germany
Synopsis
Simultaneous EEG-fMRI has been attracting significant attention from neuroscientists for the last 20 years. During these years, EEG-fMRI has been in use to investigate brain at different field strengths. However, so far, there has been no study examining the potential use of EEG during MRI at 9.4T. Therefore, in this study, we used a customized EEG and acquired data with RF heating, gradient heating, B0, B1, and fMRI using a phantom. The results revealed no critical increase in temperature in the EEG. However, there is an observable decrease in B1, which indicates the need for further research in this direction.
Introduction:
The EEG-fMRI multimodal combination enables the best of both modalities, i.e., high temporal and spatial resolution1. Thus, there has been growing interest in the ultra-high-field community to couple an EEG setup with fMRI2. Simultaneous EEG-fMRI has received attention in the neuroscience community for the last 20 years3. During these years, EEG-fMRI has been used to study human systems as well as cognitive and clinical neurosciences at low field MRI2,4,5. Recently, there have been efforts to use this multimodal combination during ultra-high-field MRI, specifically at 7T6. However, it remains a challenge to measure quality EEG-MRI data at high field7. So far, no study has examined the systematic safety of the EEG during MRI at 9.4T. Therefore, in this study, we used a customized EEG cap/cables. In the next step, we acquired EEG-MRI data to implement a safety assessment by performing RF and gradient heating, B0, B1, and fMRI scans in a head phantom.Material and Methods:
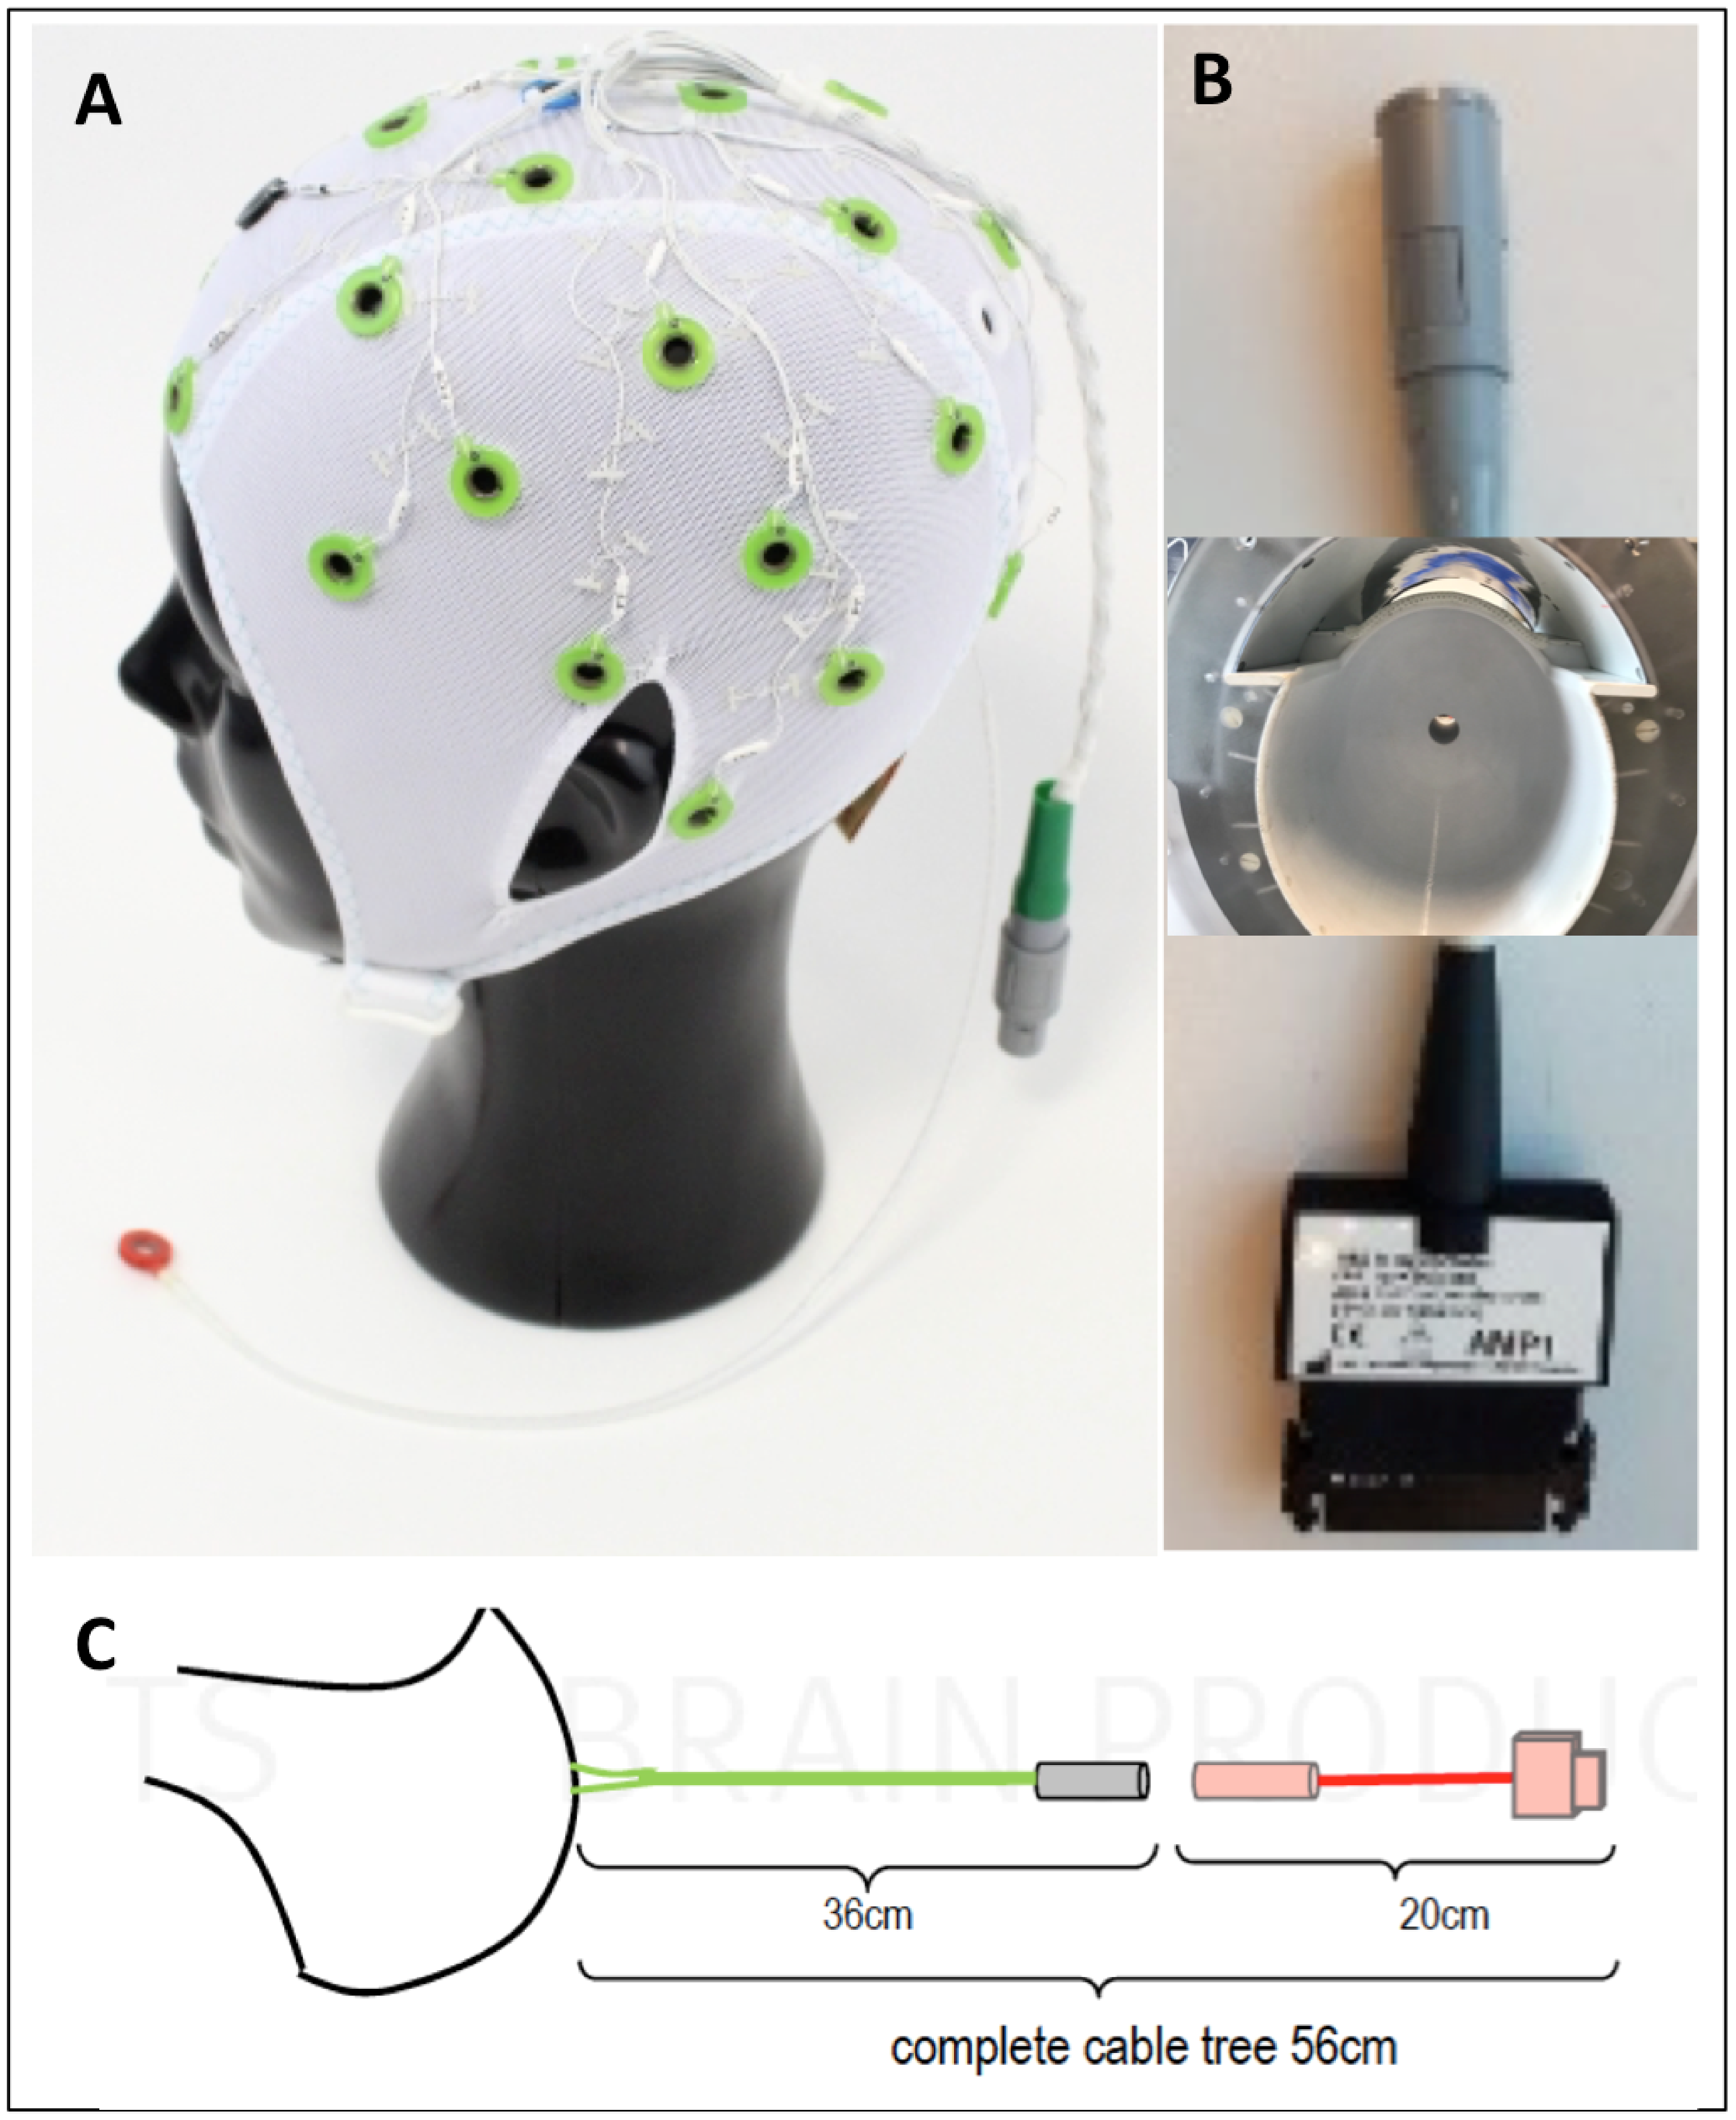
EEG Cap: The customized EEG cap, cable, and connectors were obtained through research collaboration with Brain Products GmbH and Easycap GmbH. The EEG setup is not certified for 9.4T human use; therefore, we performed the safety tests using a head phantom.Phantom Scans: The same simultaneous EEG and MRI data were acquired in two different measurement session to see whether the observations were replicable. In each session, potential heating induced by RF and gradient switching, B0 and B1 maps, and fMRI scans were acquired with and without an EEG cap.
Acquisition parameters: The data were acquired at 9.4T (Siemens) using a custom 32 channel coil.
i) RF heating (Flash) sequence: SAR: 98%, TR: 24 ms, TE: 18 ms, flip angle 248 deg, FOV: 156 x 192 mm, resolution: 1.5x1.5x3.0 mm, Bandwidth: 190 Hz/Px, TA: 10:20 minutes.
ii) Gradient heating EPI sequence: TR: 6150 ms, TE: 56 ms, flip angle 90 deg, Matrix: 192 x 192, resolution: 1.1 x 1.1 x 1.0mm, Bandwidth: 2170 Hz/Px, 100 scans, TA: 10:23 minutes.
iii) B0: TR: 468 ms, TE: 3.85 ms, flip angle 32 deg, FOV: 230 x 230 mm, resolution: 1.7 x 1.7 x 3.0mm, Bandwidth: 498 Hz/Px, 70 slices, TA: 02:03 minutes.
iv) B1 (peAFI): TR: TR: 20 ms, TE: 2.6 ms, flip angle 50 deg, FOV: 210 x 210 mm, resolution: 3.3mm isotrophic, Bandwidth: 805 Hz/Px, TA: 16:00 minutes.
v) fMRI: TR: 3910 ms, TE: 27 ms, flip angle 50 deg, FOV: 198 x 198 mm, 70 slices, 1.0 mm isotropic voxels, Bandwidth: 1202 Hz/Px, 100 scans, TA: 6.43 minutes.
Temperature measurements: First, we measured the temperature of the head phantom without any MR measurements using an infrared camera. The phantom was then scanned using an RF heating sequence (FLASH) for 10 minutes, followed by a second temperature measurement. In the next step, we performed a gradient heating test using an EPI sequence for 10 minutes, followed by a third temperature measurement.
Data Analysis: The data were compared for differences with and without an EEG cap. Moreover, we also computed histogram and statistical moments of the data, i.e., mean, standard deviation, min, and max.
Results:
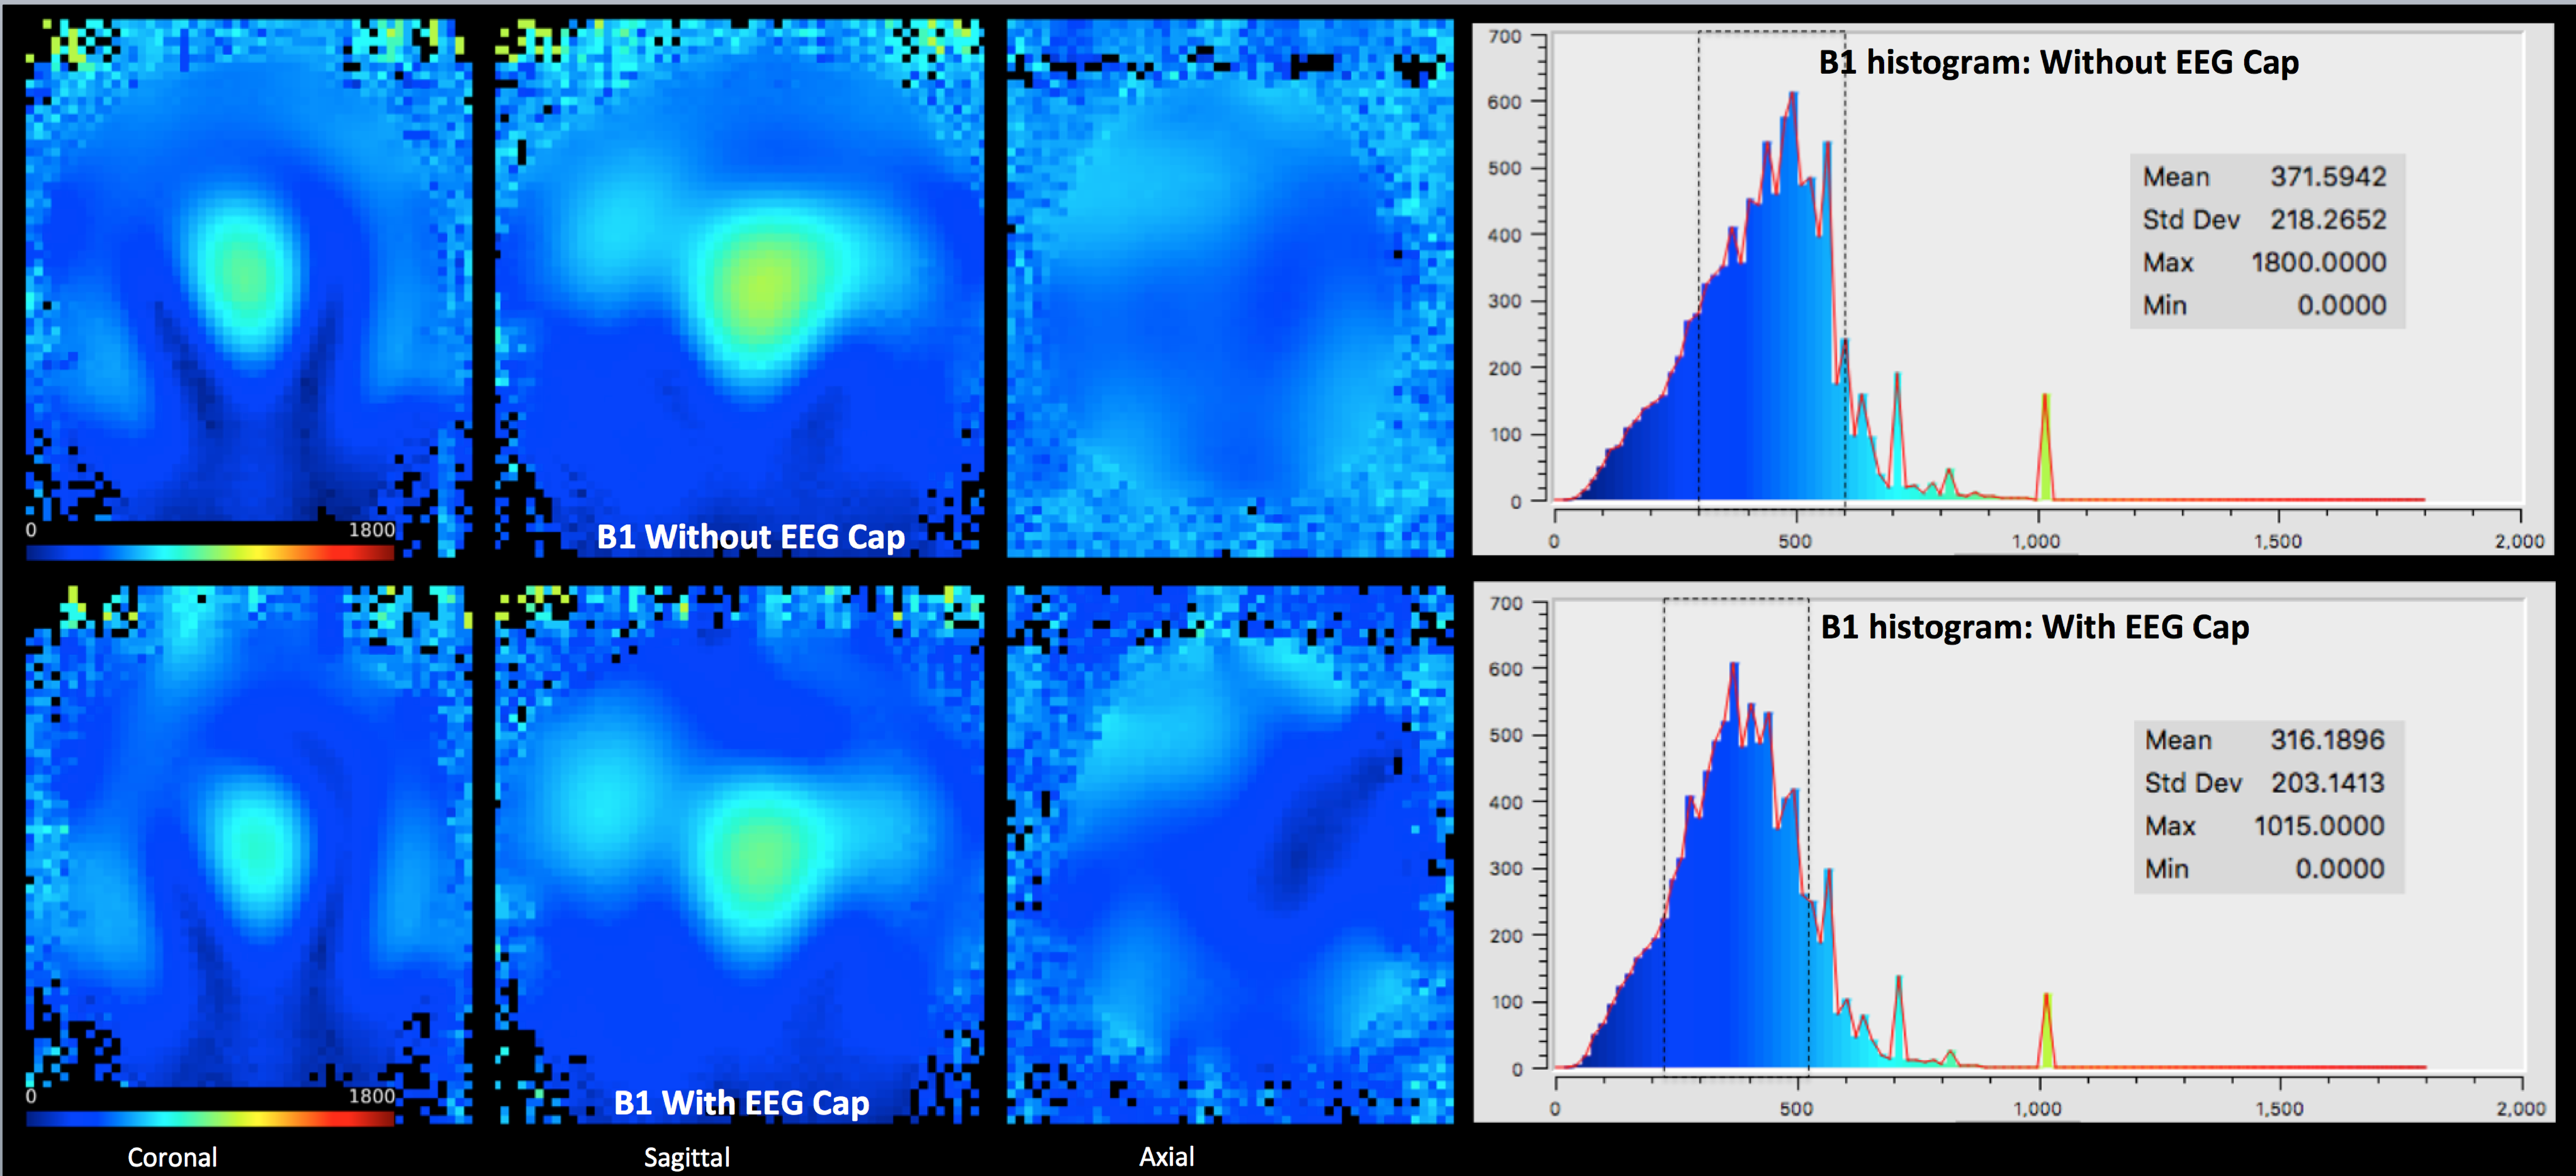
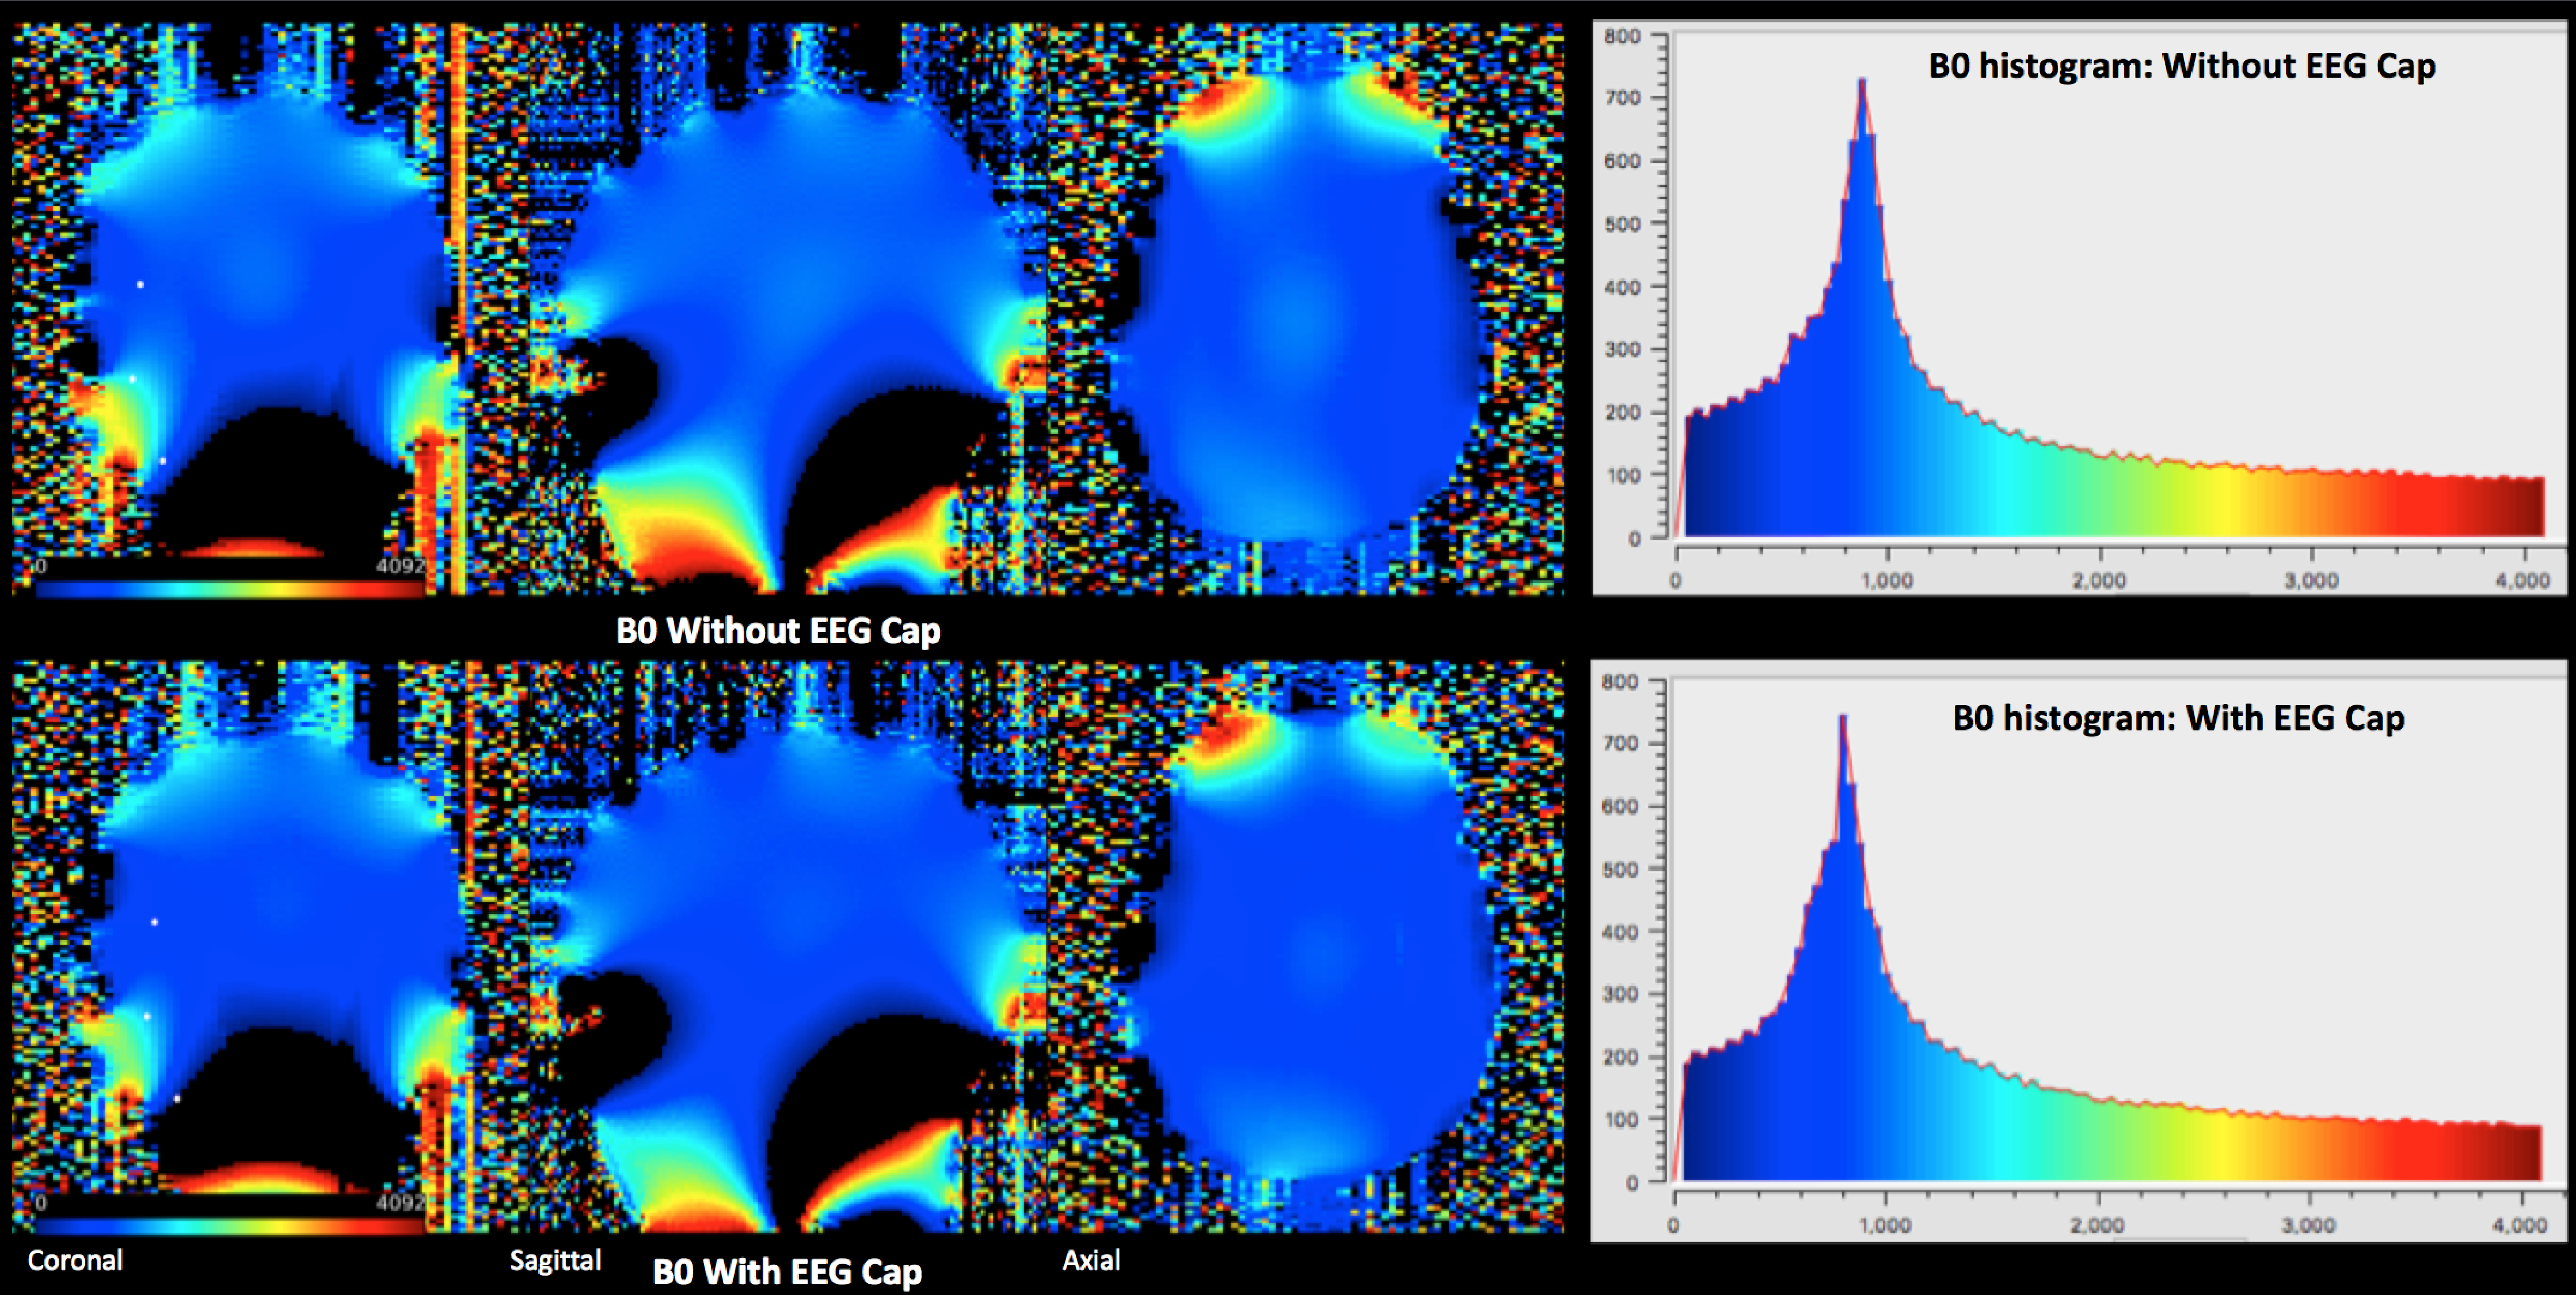
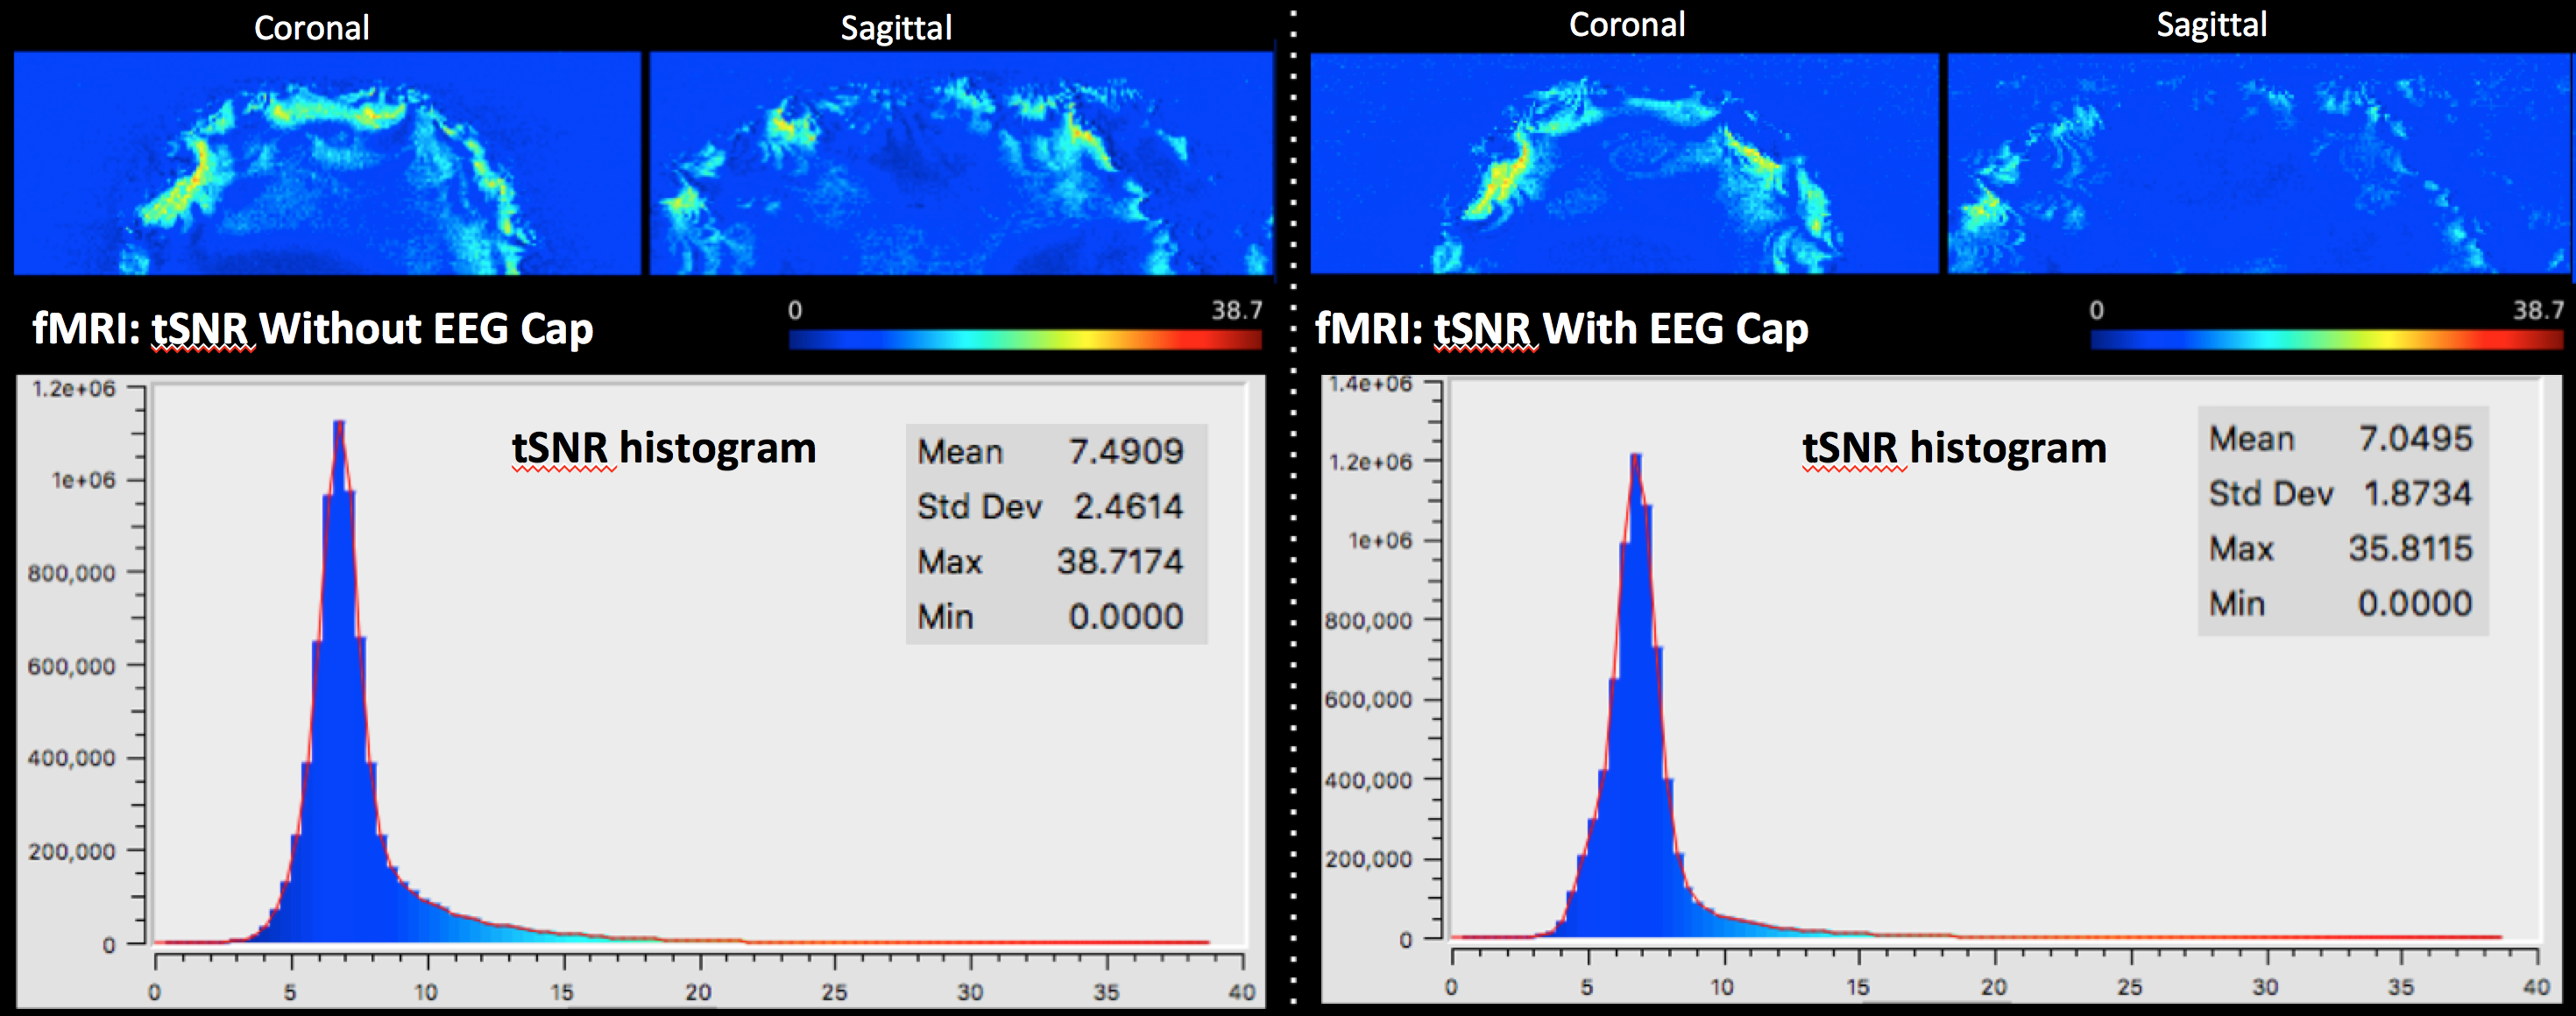
The customized EEG setup for 9.4 T worked with a customized EEG cap (s. Fig. 1A). The cables of EEG electrodes were attached to a round-shaped end connector, which then passed through the MR-coil hole (s. Fig 1B). After passing through the MR-coil, the connector was attached to the amplifier via a specific connector, whose one side has a round connector, and the other side a standard amplifier connector (s. Fig 1B). The temperature measurements with RF and gradient heating revealed a minor difference (less than 3 degrees). The B1 comparison showed lower B1 values with the EEG cap (s. Fig. 2). In contrast, B0 maps showed comparable results in both conditions, i.e., with and without the EEG cap (s. Fig. 3). The tSNR calculation of the functional data showed slightly lower tSNR with the EEG cap in contrast to without the EEG-cap (s. Fig. 4).Discussion:
The temperature of the EEG cap changed slightly after the RF and gradient heating. Our finding, therefore, suggests that only minor heating effects of the EEG electrodes reach the volunteer’s skin. Therefore EEG will be a useful add-on for multimodal imaging in the future. In the past, EEG RF heating at 3T MRI showed a higher baseline and increased temperature8. One reason might be that at 3T a body coil, whereas at 9.4T, a head only transmit coil is used. However, the main problem is that in the preliminary analysis, B1 maps revealed lower values with the EEG cap in contrast to without the EEG cap. These distortions could yield to hotspot heating in the brain. Thus, the safety assessment requires RF simulations.Conclusion:
The temperature measurements show promising potential for an EEG-fMRI setup at 9.4T. The EEG-MRI analysis revealed that there is a variation in B1 with the EEG cap, with B1 values being lower with the EEG cap. The decrease in B1 is concerning and, thus, requires further exploration with RF simulations. In contrast, B0 showed comparable results with and without an EEG cap. There is also a slight variation in the tSNR values of the fMRI data.Acknowledgements
No acknowledgement found.References
1. Huster, R. J., Debener, S., Eichele, T. & Herrmann, C. S. Methods for Simultaneous EEG-fMRI: An Introductory Review. J. Neurosci. 32, 6053–6060 (2012).
2. Simultaneous EEG and fMRI: Recording, Analysis, and Application. (Oxford University Press, 2010).
3. Ritter, P. & Villringer, A. Simultaneous EEG–fMRI. Neurosci. Biobehav. Rev. 30, 823–838 (2006).
4. Mele, G. et al. Simultaneous EEG-fMRI for Functional Neurological Assessment. Front. Neurol. 10, (2019).
5. Mulert, C. Simultaneous EEG and fMRI: towards the characterization of structure and dynamics of brain networks. Dialogues Clin. Neurosci. 15, 381–386 (2013).
6. Jorge, J., Grouiller, F., Gruetter, R., van der Zwaag, W. & Figueiredo, P. Towards high-quality simultaneous EEG-fMRI at 7 T: Detection and reduction of EEG artifacts due to head motion. NeuroImage 120, 143–153 (2015).
7. Scheeringa, R. & Fries, P. Cortical layers, rhythms and BOLD signals. NeuroImage 197, 689–698 (2019).
8. Nöth, U., Laufs, H., Stoermer, R. & Deichmann, R. Simultaneous electroencephalography-functional MRI at 3 T: An analysis of safety risks imposed by performing anatomical reference scans with the EEG equipment in place. J. Magn. Reson. Imaging 35, 561–571 (2012).
Figures