3928
Behavior-related resting-state MEG/fMRI connectivity changes are related to the hierarchical organization of the neocortex1Department of Biomedical Engineering, Pennsylvania State University, State College, PA, United States, 2Institute for Cyber Science, Pennsylvania State University, State College, PA, United States
Synopsis
It has been shown that the maximal correlation between rsfMRI connectivity and behavioral measures occurs along a positive-negative mode direction characterizing the change of the overall goodness of behavior. Here, we had a thorough examination of rsfMRI/MEG connectivity along this positive-negative mode direction. We found that behavioral changes are associated with significant connectivity modulations that are however distinct at the lower-order sensory/motor areas and higher-order cognitive regions. Moreover, this hierarchy-dependent connectivity modulation is similar for rsfMRI and middle-frequency MEG signals, but reversed for gamma-band MEG signals. The findings may provide novel insight into the neural basis of inter-subject behavioral variability.
INTRODUCTION
A recent data-driven canonical correlation analysis (CCA) on the Human Connectome Project (HCP) data from a large cohort of subjects has identified a mode direction maximally linking individuals’ resting-state fMRI (rsfMRI) connectivity and their demographical/behavioral measures1. Interestingly, this “positive-negative” mode direction is characterized by a gradual change of the overall goodness of behavioral traits. However, it has been shown that the rsfMRI-based connectivity measures are susceptible to various non-neuronal noise2 and also incapable of separating frequency-specific neuronal processes3–5. In this study, we used magnetoencephalography (MEG) signals to assess frequency-specific functional connectivity and then examined their modulation, as well as the correspondence with rsfMRI connectivity, across individuals along the “positive-negative” mode direction.METHODS
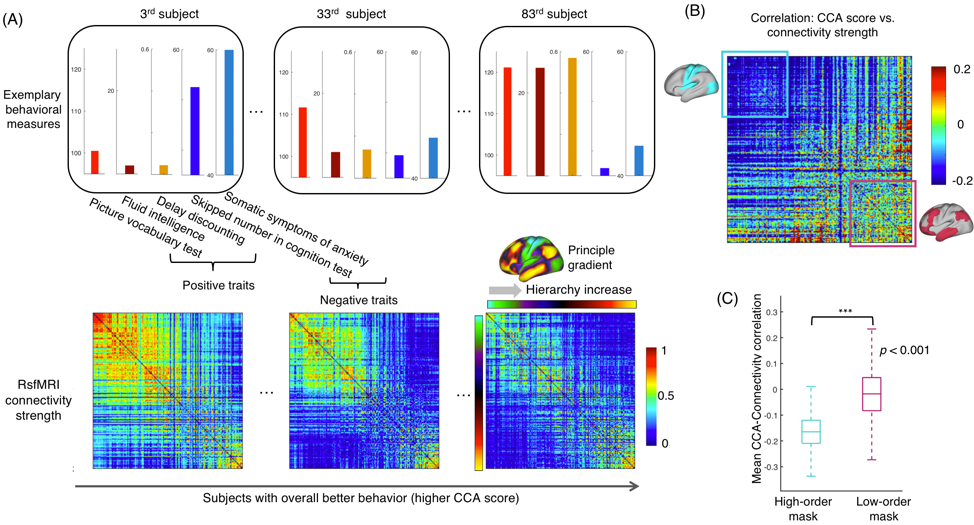
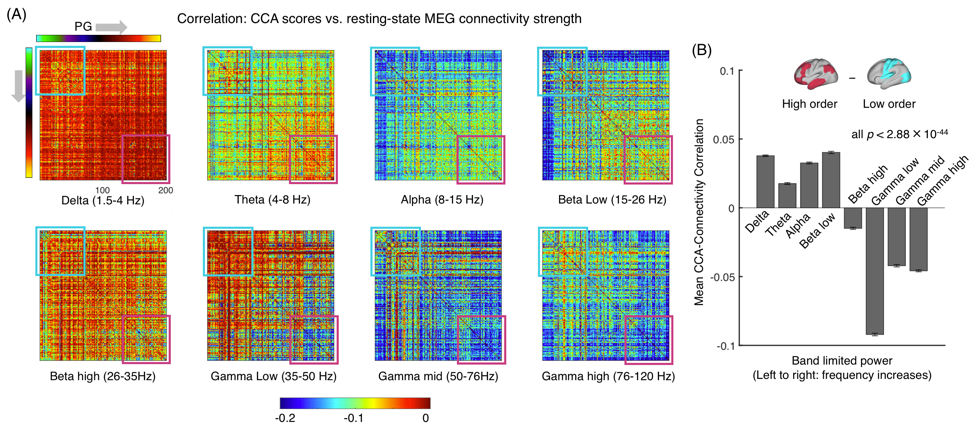
We used the behavioral and imaging data from 87 HCP subjects whose MEG data are available6. For each subject, functional connectivity matrices of 200 brain parcels7 were derived by correlating rsfMRI signals or bandlimited MEG powers of eight frequency bands: delta, 1.5-4 Hz; theta, 4-8 Hz; alpha, 8-15 Hz; beta low, 15-26 Hz; beta high, 26-35 Hz; gamma low, 35-50Hz; gamma mid, 50-76 Hz; gamma high, 76-120 Hz. The source level bandlimited powers from resting-state MEG was estimated with Beamformer filters inverse algorithms (“bfblpenv”)8,9. We sorted the rsfMRI and MEG connectivity matrices based on the hierarchical level of the 200 parcels, which was estimated according to the principal gradient (PG) of rsfMRI connectivity obtained previously10. The PG presents a direction going from the low-order sensory/motor areas to high-order cognitive regions. On the other hand, we replicated the previous study1 and derived the positive-negative CCA mode of rsfMRI connectivity and behavior, and then obtained a CCA score for each subject that represents his/her position along this mode direction. Then, we correlated, across subjects, the CCA score with the strength (i.e., the absolute value of correlation) of single rsfMRI or MEG connection to see how each connection is modulated with behavioral changes along the “positive-negative” mode.RESULTS
Inspection of individual data suggests systematic changes in rsfMRI connectivity and behavioral measures along the CCA mode direction. Consistent with the previous finding1, subjects with higher CCA scores appear to have more positive traits (Fig. 1A), e.g., the performance in picture vocabulary test, intelligence test and money related self-regulation/impulsivity, and less negative traits, e.g., skipped items in cognition test and self-report about the somatic anxiety. Their rsfMRI connectivity also showed significant modulations, particularly at relatively lower-order areas (the top-left of the sorted connectivity matrices) (Fig. 1A). Correlating the CCA score and rsfMRI connectivity strength revealed a clear gradient across the cortical hierarchy: much stronger negative correlations were seen within the lower-hierarchy regions (Fig. 1B). This is evident by a large contrast between two blocks covering the lower-order (cyan) and higher-order (purple) respectively (Fig. 1C). We repeated the same analysis for MEG connectivity of different bandlimited powers. The correlations between the CCA score and MEG connectivity strength also showed cross-hierarchy contrasts for almost all the frequency bands (Fig. 2A). However, this cross-hierarchy contrast shows opposite signs for the low and middle (<26 Hz) frequency bands and high-frequency gamma bands (>26 Hz) (Fig. 2B). The modulation of the middle-frequency MEG connectivity with the CCA score resembles that of the rsfMRI connectivity, i.e., a larger reduction of connectivity strength at the sensory/motor regions, whereas the gamma-band MEG connectivity is more significantly modulated in the high-order cognitive regions.DISCUSSION
By inspecting the rsfMRI/MEG connectivity change along a positive-negative mode direction characterizing the overall goodness of behavior, we found a hierarchy-dependent connectivity modulation. Subjects with more positive traits tend to have weaker rsfMRI connectivity and middle-frequency (<26 Hz) MEG connectivity at the low-order sensory/motor areas, as well as reduced high-frequency (>26 Hz) MEG connectivity in the high-order cognitive regions. The similar changes in rsfMRI connectivity and middle-frequency MEG connectivity are consistent with previous studies showing a close relationship between the two11,12. The opposite changes of the middle-frequency and high-frequency MEG connectivity suggest that the brain activity within these two frequency ranges may be linked to distinct brain processes. For example, the middle-frequency brain activity has been hypothesized to represent an ongoing inhibitory process13,14 whereas the broadband gamma activity has been linked to the general excitability of cortical regions15. Overall, the rsfMRI and MEG results consistently suggest that the brain connectivity modulations related to the overall goodness of behavior are distinct across cortical regions of different hierarchy, and are dependent on the frequency of neuronal oscillations.CONCLUSION
Changes in the overall goodness of behavior across individuals are associated with distinct connectivity changes at brain regions of different hierarchies. These behavior-related connectivity changes also are also frequency dependent and show opposite patterns for the middle- and high-frequency brain activity.Acknowledgements
This study is supported by the NIH Pathway to Independence Award (K99/R00).References
- Smith, S. M. et al. A positive-negative mode of population covariation links brain connectivity, demographics and behavior. Nat. Neurosci. 18, 1565–1567 (2015).
- Murphy, K., Birn, R. M. & Bandettini, P. A. Resting-state fMRI confounds and cleanup. Neuroimage (2013). doi:10.1016/j.neuroimage.2013.04.001
- Wang, X. J. Neurophysiological and computational principles of cortical rhythms in cognition. Physiological Reviews (2010). doi:10.1152/physrev.00035.2008
- Donner, T. H. & Siegel, M. A framework for local cortical oscillation patterns. Trends in Cognitive Sciences (2011). doi:10.1016/j.tics.2011.03.007
- Siegel, M., Donner, T. H. & Engel, A. K. Spectral fingerprints of large-scale neuronal interactions. Nature Reviews Neuroscience (2012). doi:10.1038/nrn3137
- Van Essen, D. C. et al. The WU-Minn Human Connectome Project: An overview. Neuroimage 80, 62–79 (2013).
- Schaefer, A. et al. Local-Global Parcellation of the Human Cerebral Cortex from Intrinsic Functional Connectivity MRI. Cereb. Cortex (2018). doi:10.1093/cercor/bhx179
- Larson-Prior, L. J. et al. Adding dynamics to the Human Connectome Project with MEG. Neuroimage (2013). doi:10.1016/j.neuroimage.2013.05.056
- Brookes, M. J. et al. Measuring functional connectivity using MEG: Methodology and comparison with fcMRI. Neuroimage (2011). doi:10.1016/j.neuroimage.2011.02.054
- Margulies, D. S. et al. Situating the default-mode network along a principal gradient of macroscale cortical organization. Proc. Natl. Acad. Sci. 113, 12574–12579 (2016).
- Brookes, M. J. et al. Investigating the electrophysiological basis of resting state networks using magnetoencephalography. Proc. Natl. Acad. Sci. U. S. A. (2011). doi:10.1073/pnas.1112685108
- Mantini, D. et al. Electrophysiological signatures of resting state networks in the human brain. Proc Natl Acad Sci U S A 104, 13170–13175 (2007).
- Engel, A. K. & Fries, P. Beta-band oscillations-signalling the status quo? Current Opinion in Neurobiology (2010). doi:10.1016/j.conb.2010.02.015
- Jensen, O. & Mazaheri, A. Shaping functional architecture by oscillatory alpha activity: Gating by inhibition. Front. Hum. Neurosci. (2010). doi:10.3389/fnhum.2010.00186
- Merker, B. Cortical gamma oscillations: The functional key is activation, not cognition. Neuroscience and Biobehavioral Reviews (2013). doi:10.1016/j.neubiorev.2013.01.013
Figures