3926
Electrophysiological and fMRI signals show consistent global propagations across the cortical hierarchy1Pennsylvania State University, State College, PA, United States
Synopsis
Infra-slow (<0.1 Hz) propagating structures have been found in resting-state fMRI. Nevertheless, the neural origin of the infra-slow rsfMRI propagations remains unclear. Besides, the study of propagating activity using fMRI cannot ignore a series issue that the brain has spatial heterogeneity of hemodynamic delays. Here, to address the questions, we combined human rsfMRI and monkey electrophysiology data and found similar propagations swiping the cortex in two opposite directions along an axis of
Introduction
Infra-slow (<0.1 Hz) propagating structures have been found in resting-state functional MRI (rsfMRI) by using a template-refining approach to extract repeated quasi-periodic patterns (QPPs) 1–5 or by decomposing rsfMRI lag structures to recover lag threads 6,7. These propagating structures contribute significantly to rsfMRI connectivity 6,8. Nevertheless, to date the neural origin of the infra-slow rsfMRI propagations remains elusive since the fMRI study of propagating activity faces an issue of region-specific hemodynamic delays 9. A series of recent studies have shown that a systemic low-frequency oscillation (sLFO) of blood signals induces systematic rsfMRI delays consistent with the expected blood transit time 10–13, suggesting a potential contribution of hemodynamic delays to apparent rsfMRI propagations. To address these issues, we examine and compare infra-slow propagating brain activity in human rsfMRI and monkey electrophysiology.Methods
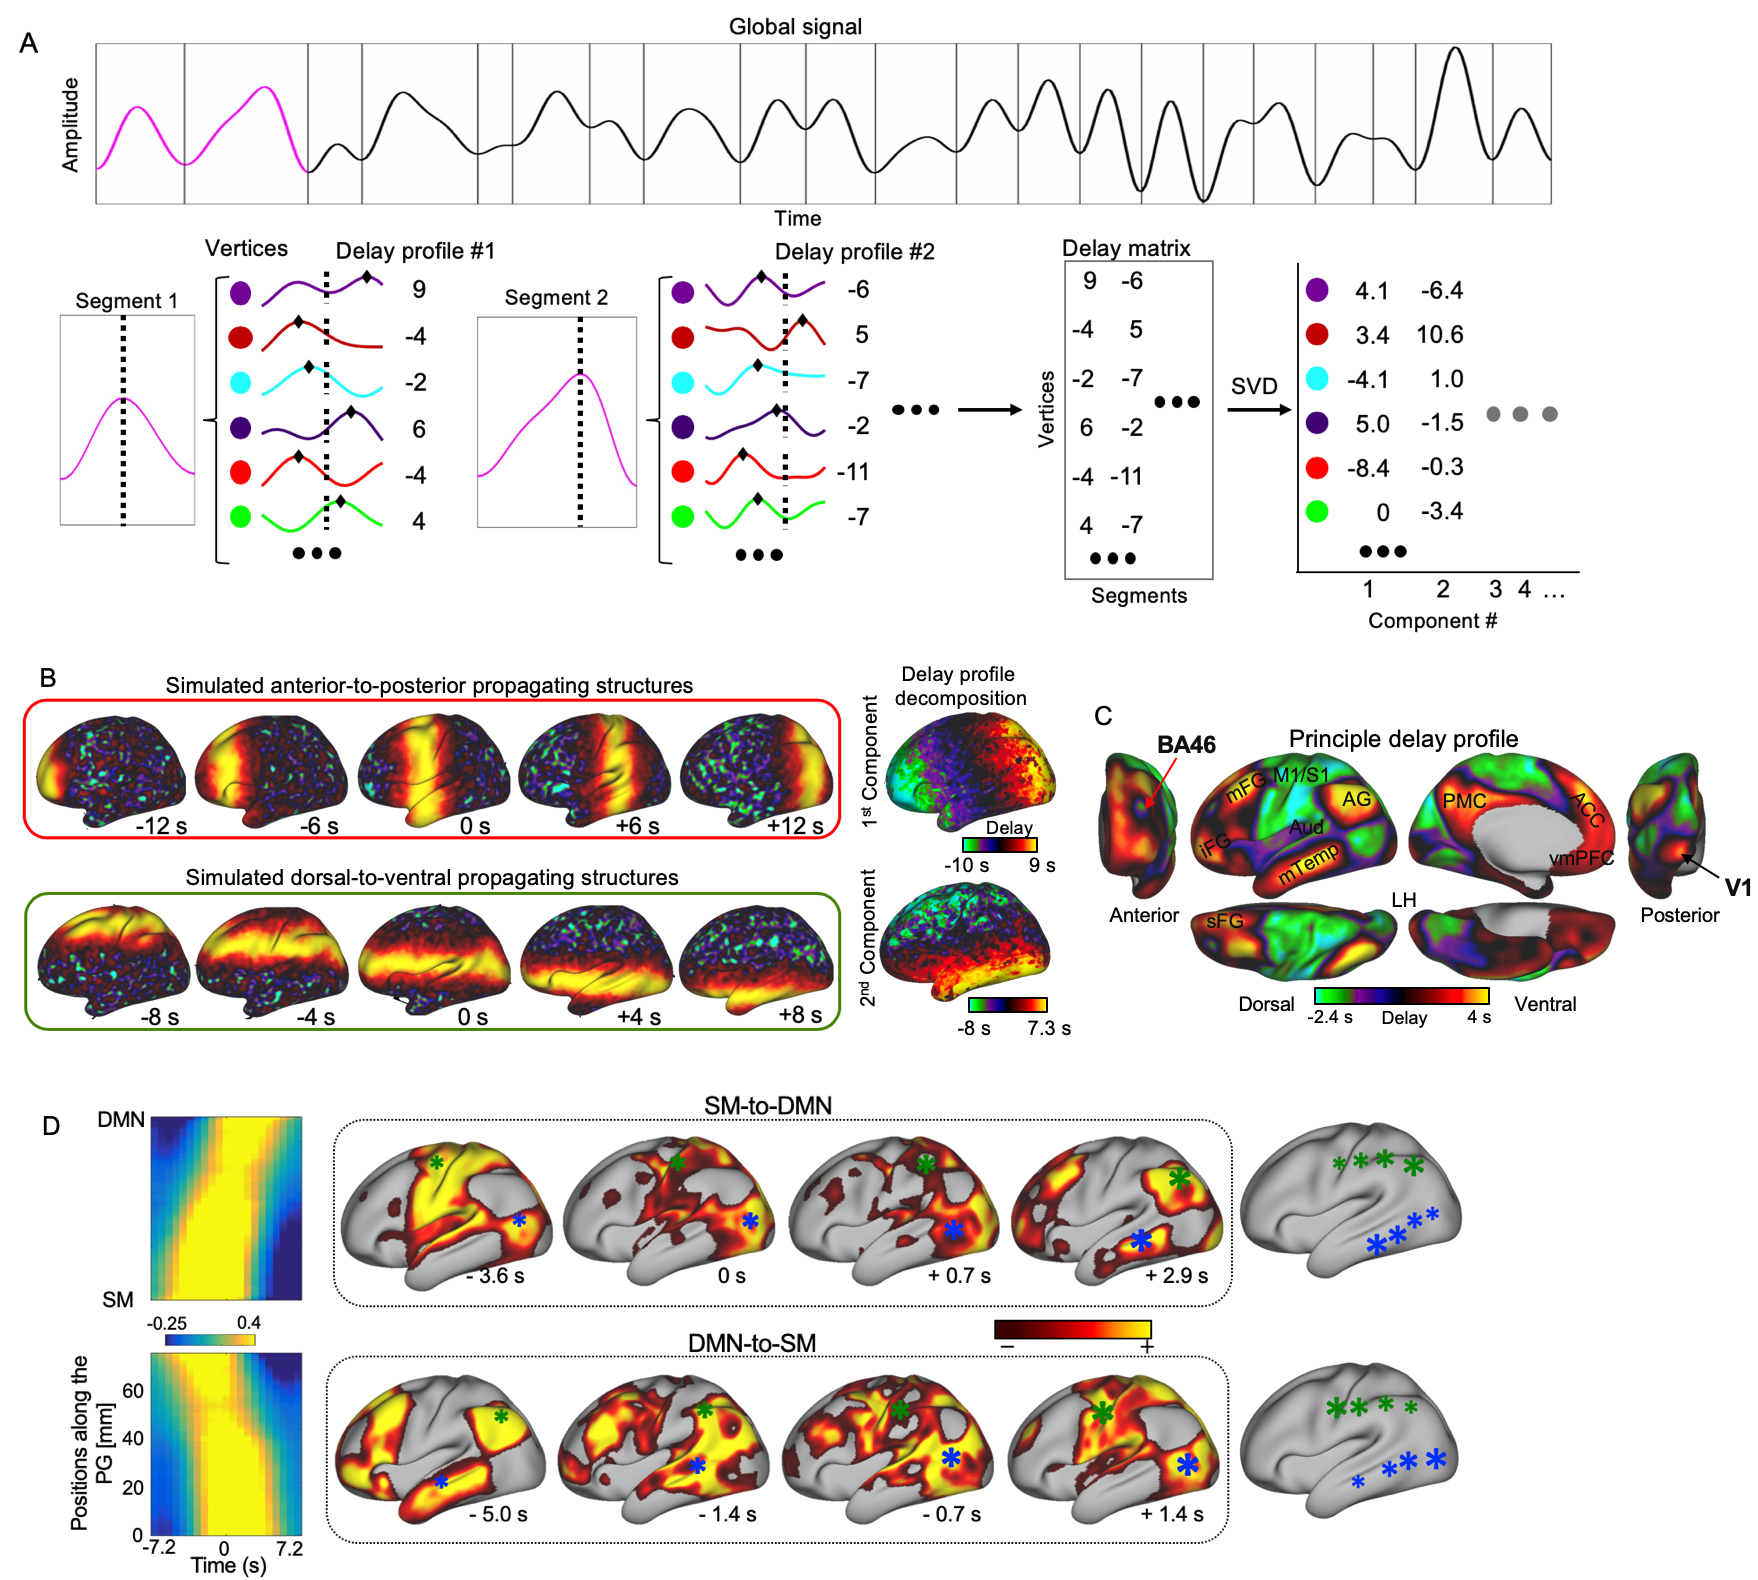
We used the HCP 500-subject data release and limited our analyses to 460 subjects who completed all four rsfMRI sessions. The monkey electrophysiology dataset was downloaded from http://neurotycho.org. Time series of fMRI or bandlimited power signals from monkey ECoG were cut into time segments based on the troughs of the global mean signal. A principal delay (PD) profile was derived as follows. A delay profile was defined for each time segment as the relative timing of local peaks at each cortical surface vertex or electrode with respect to the global peak. A delay matrix was formed by concatenating all the delay profiles, to which we then applied SVD to extract the first principle component, i.e., the principle delay profile representing a principal propagating direction (Fig. 1A). For a given direction, we identified time segments with propagation as follows. The rsfMRI or bandlimited ECoG powers were first projected onto that direction, and the Pearson’s correlation between the timing and position of local peaks was then calculated for each time segment. A time segment was identified as propagating one if its time-position correlation is significant (p= 0.05) as compared with a null distribution from control directions, e.g., randomly rotated PG map.Results
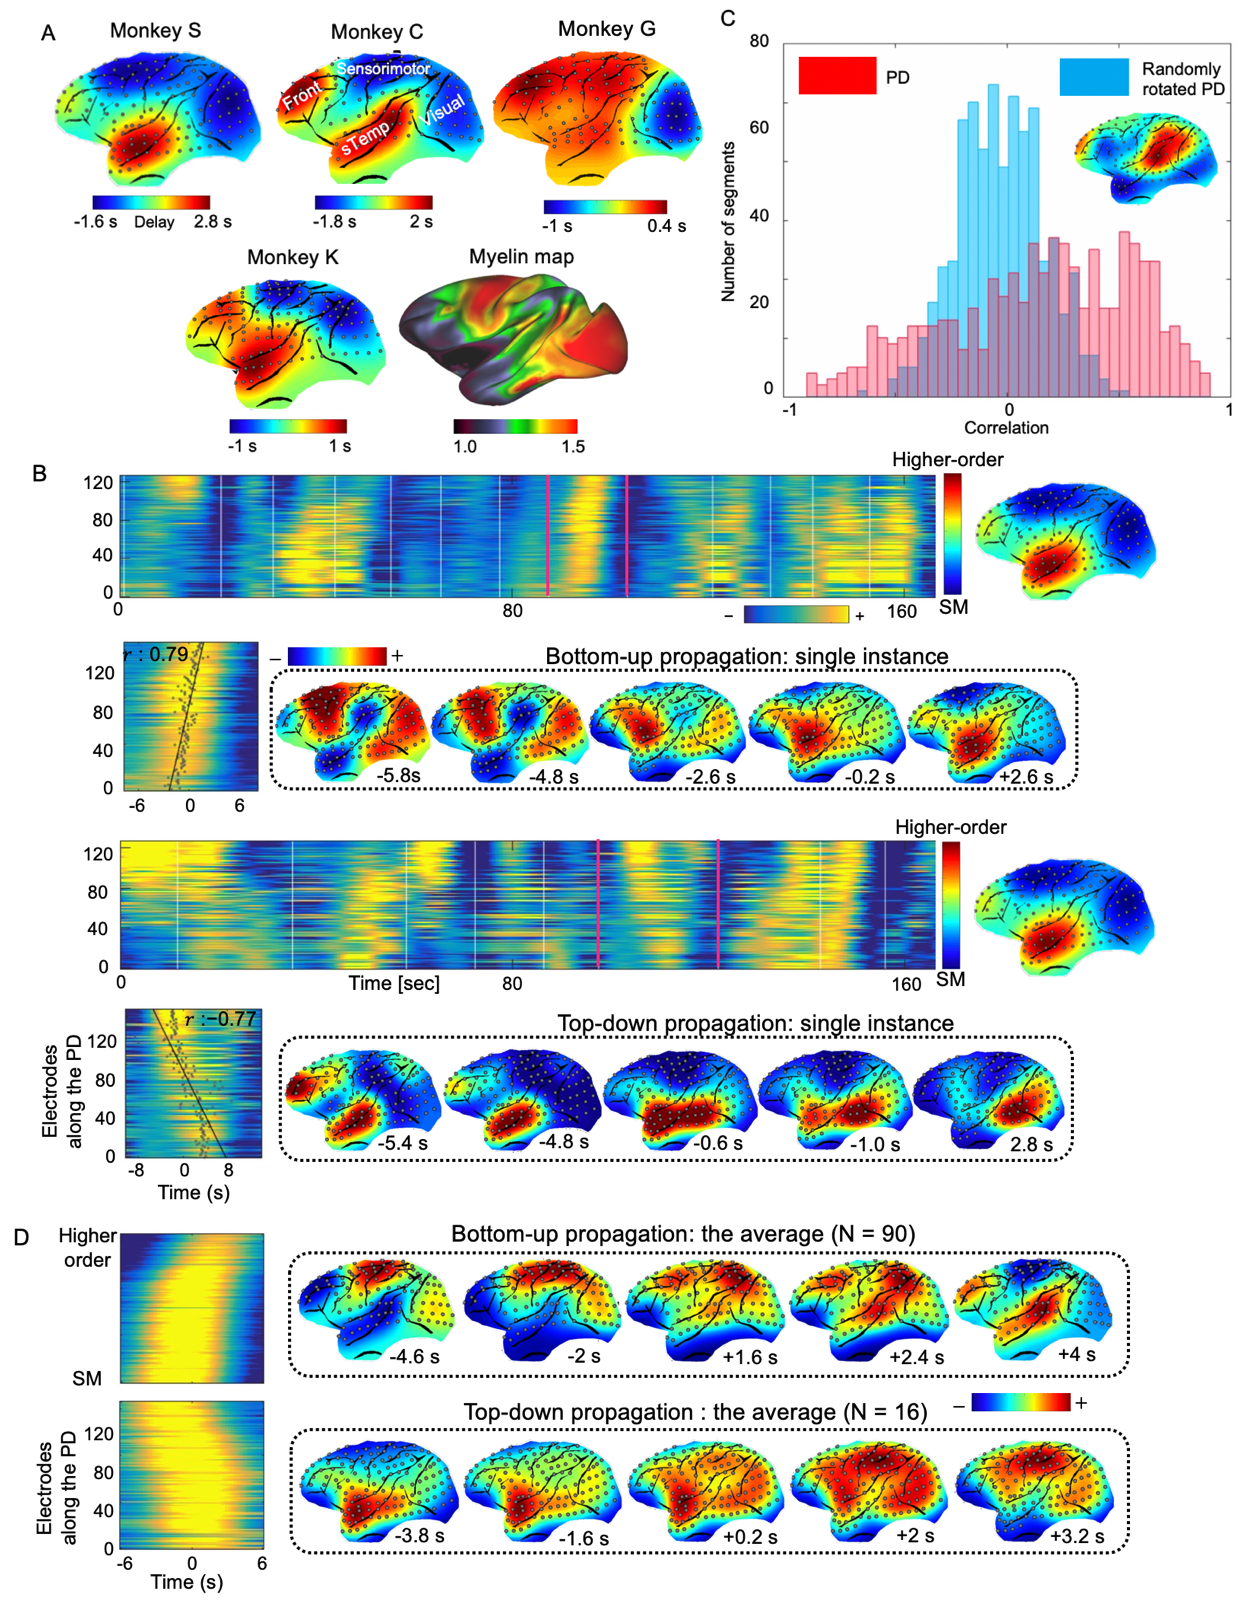
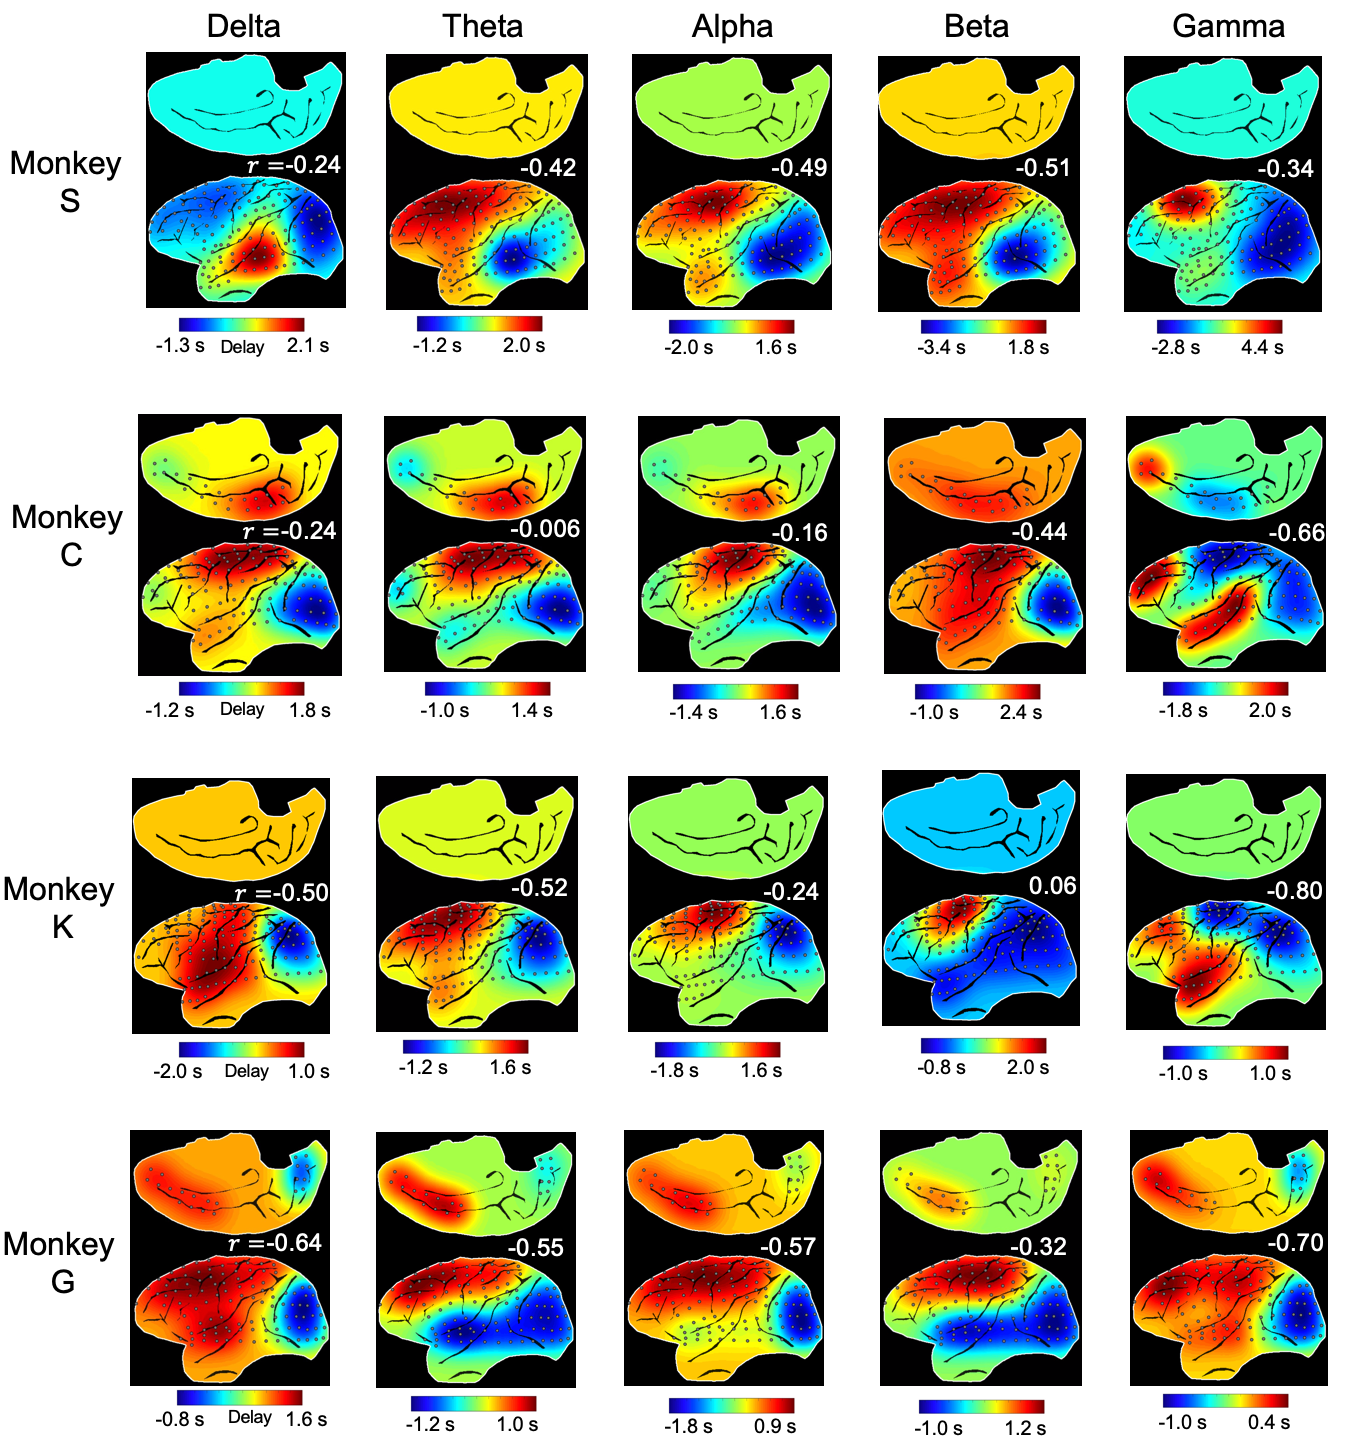
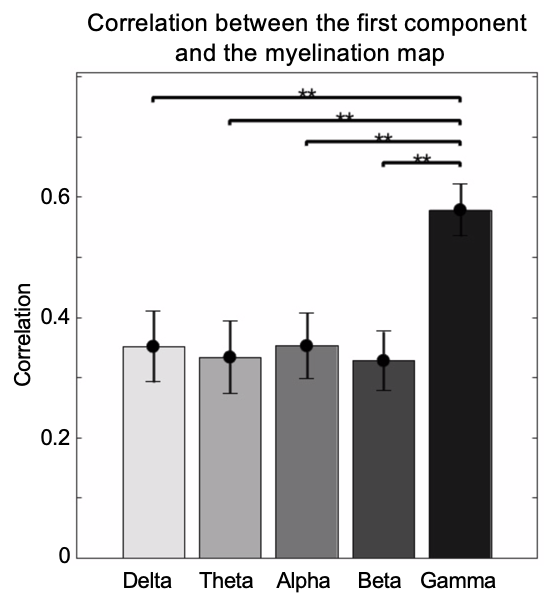
The application of delay profile decomposition to the synthesized data containing simulated propagating activity successfully recovered two propagating directions as represented by the first two principal component of delay profiles (Fig. 1B). The application of the same method to the HCP rsfMRI data from 460 subjects generated a principal delay (PD) profile (Fig. 1C) showing a clear gradient from the lower-order sensory/motor (SM) areas and higher-order cognitive regions, mostly the default mode network (DMN), similar to the principal connectivity gradient found previously 14. We then projected the rsfMRI signals onto this PD direction and identified time segments showing a significant time-position correlation. We further obtained the averaged patterns of these two types of propagations in both the time-position graph and brain surface (Fig. 1D). To determine whether similar propagations are present in electrophysiological data free of hemodynamic confounding, we applied the same method to ECoG recordings from 4 monkeys in an eyes-closed rest condition. We first focused on the gamma-band (42–95 Hz) power. The PD direction of ECoG gamma-power showed a clear cross-hierarchy contrast between the SM areas and higher-order regions (Fig. 2A). This pattern is inversely similar (r= -0.71 ±0.067, p< 10-16) to the cortical myelination map that has been suggested to be a good approximation of cortical hierarchy 15. Next, we projected the ECoG gamma power of all electrodes onto this propagating direction. The resulting time-position graphs clearly contained tilted bands with significant time-position correlations, representing the cross-hierarchy propagating activity (Fig. 2B). The time-position correlations for this cross-hierarchy axis showed a heavy tailed distribution that is significantly different (p=1.65x10⁻³⁴, two-sample KS test) from that along the control direction (Fig. 2C). We identified ECoG segments with propagations based on the time-position correlations and averaged them to obtain the mean propagating patterns (Fig. 2D). We then repeated the same analysis for power signals of the delta (1–4 Hz), theta (5–8 Hz), alpha (9–15 Hz) and beta (17–32 Hz) frequency bands, but failed to find a consistent cross-hierarchy propagating direction for any of these power signals (Fig. 3-4).Discussion
In summary, we found infra-slow propagations in both human rsfMRI and monkey ECoG, which are similar in terms for their time scale, i.e., ~5-10 seconds, and propagating direction, i.e., along the gradient of cortical hierarchy. The infra-slow propagating brain activity has been repeatedly found in rsfMRI signals with different methods. However, inferring the propagating activity with fMRI signals could be problematic given the region-specific hemodynamic delays 9. In particular, recent studies have shown the sLFO of blood signals can cause corresponding delays of rsfMR signals consistent with the blood transition time 11–14, suggesting the potential hemodynamic confounds on rsfMRI propagating structures. Here, we showed that the gamma-band ECoG power and rsfMRI signals contain similar propagating structures along the hierarchical organization of the cortex. This cross-modality comparison provides new evidence for the neural origin of the infra-slow rsfMRI propagations, and also suggests the high-frequency gamma-band brain activity may underlie these neuronal processes.Conclusion
Resting-state brain activity, measured either by human rsfMRI or monkey electrophysiology, is characterized by distinctive propagations along the gradient of cortical hierarchy. The cross-hierarchy ECoG propagations are present only in the gamma-band power.Acknowledgements
This research was supported by the National Institutes of Health (NIH) Pathway to Independence Award (K99/R00) 5R00NS092996-03.References
1. Yousefi B, Shin J, Schumacher EH, Keilholz SD. Quasi-periodic patterns of intrinsic brain activity in individuals and their relationship to global signal. Neuroimage. 2018;167(August 2017):297-308. doi:10.1016/j.neuroimage.2017.11.0432.
2. Abbas A, Belloy M, Kashyap A, Billings J, Nezafati M, Keilholz S. Quasi-periodic patterns contribute to functional connectivity in the brain. bioRxiv. 2018:323162. doi:10.1101/3231623.
3. Yousefi B, Shin J, Schumacher EH, Keilholz SD. Quasi-periodic patterns of intrinsic brain activity in individuals and their relationship to global signal. Neuroimage. 2018;167(November 2017):297-308. doi:10.1016/j.neuroimage.2017.11.0434.
4. Majeed W, Magnuson M, Keilholz SD. Spatiotemporal dynamics of low frequency fluctuations in BOLD fMRI of the rat. J Magn Reson Imaging. 2009;30(2):384-393. doi:10.1002/jmri.218485.
5. Thompson GJ, Pan WJ, Magnuson ME, Jaeger D, Keilholz SD. Quasi-periodic patterns (QPP): Large-scale dynamics in resting state fMRI that correlate with local infraslow electrical activity. Neuroimage. 2014;84:1018-1031. doi:10.1016/j.neuroimage.2013.09.0296.
6. Mitra A, Snyder AZ, Blazey T, Marcus E. Lag threads organize the brain’s intrinsic activity. Proc Natl Acad Sci. 2015;112(52):E2235–E2244. doi:10.1073/pnas.15238931137.
7. Mitra A, Snyder AZ, Hacker CD, Raichle ME. Lag structure in resting-state fMRI. J Neurophysiol. 2014;111(11):2374-2391. doi:10.1152/jn.00804.20138.
8. Abbas A, Belloy M, Kashyap A, et al. Quasi-periodic patterns contribute to functional connectivity in the brain. Neuroimage. 2019. doi:10.1016/j.neuroimage.2019.01.0769.
9. Handwerker DA, Ollinger JM, D’Esposito M. Variation of BOLD hemodynamic responses across subjects and brain regions and their effects on statistical analyses. Neuroimage. 2004. doi:10.1016/j.neuroimage.2003.11.02910.
10. Tong Y, Frederick B deB. Time lag dependent multimodal processing of concurrent fMRI and near-infrared spectroscopy (NIRS) data suggests a global circulatory origin for low-frequency oscillation signals in human brain. Neuroimage. 2010;53(2):553-564. doi:10.1016/j.neuroimage.2010.06.04911.
11. Tong Y, Frederick B de B. Concurrent fNIRS and fMRI processing allows independent visualization of the propagation of pressure waves and bulk blood flow in the cerebral vasculature. Neuroimage. 2012;61(4):1419-1427. doi:10.1016/j.neuroimage.2012.03.00912.
12. Tong Y, Yao J (Fiona), Chen JJ, Frederick B de B. The resting-state fMRI arterial signal predicts differential blood transit time through the brain. J Cereb Blood Flow Metab. 2018. doi:10.1177/0271678X1775332913.
13. Tong Y, Lindsey KP, Hocke LM, Vitaliano G, Mintzopoulos D, Frederick BD. Perfusion information extracted from resting state functional magnetic resonance imaging. J Cereb Blood Flow Metab. 2017;37(2):564-576. doi:10.1177/0271678X1663175514.
14. Margulies DS, Ghosh SS, Goulas A, et al. Situating the default-mode network along a principal gradient of macroscale cortical organization. Proc Natl Acad Sci. 2016;113(44):12574-12579. doi:10.1073/pnas.160828211315.
15. Burt JB, Demirtaş M, Eckner WJ, et al. Hierarchy of transcriptomic specialization across human cortex captured by structural neuroimaging topography. Nat Neurosci. 2018. doi:10.1038/s41593-018-0195-016.
16. Amemiya S, Takao H, Hanaoka S, Ohtomo K. Global and structured waves of rs-fMRI signal identified as putative propagation of spontaneous neural activity. Neuroimage. 2016;133:331-340. doi:10.1016/j.neuroimage.2016.03.03317.
17. Mitra A, Snyder AZ, Hacker CD, et al. Human cortical–hippocampal dialogue in wake and slow-wave sleep. Proc Natl Acad Sci. 2016;113(44):E6868-E6876. doi:10.1073/pnas.160728911318.
18. Mitra A, Kraft A, Wright P, et al. Spontaneous Infra-slow Brain Activity Has Unique Spatiotemporal Dynamics and Laminar Structure. Neuron. 2018;98(2):297-305.e6. doi:10.1016/j.neuron.2018.03.015
Figures