3925
Resting-state fMRI and EEG alpha power show distinct correlations at different time lags1Pennsylvania State University, State College, PA, United States
Synopsis
Alpha rhythm in EEG is prominent in the occipital and parietal cortex under an awake brain state. Previous studies have reported strong correlations between the resting-state fMRI signals and EEG alpha power. Here, we re-examined their correlations at different time delays. We found strong positive fMRI correlations at the zero lag, which is distinct from those observed at the typical hemodynamic delay. The finding suggests that the resting-state EEG alpha modulation is likely associated with a sequential brain process starting much earlier.
Introduction
Alpha rhythm (~10 Hz oscillations) has been observed to increase in spontaneous EEG signal in the occipital and parietal cortex under an awake brain state 1–4 and to be suppressed under a low vigilance state 5,6. The correlation between the EEG alpha and simultaneously recorded fMRI signals have been extensively studied with the purpose of locating the origin of the alpha rhythm, and widespread negative correlations between the two were seen at the sensory modalities whereas the confined positive correlations were observed at the anterior and mediodorsal thalamus 7–9. However, the thalamic correlation reaches its peak with the relative delay between the two modalities being ~2-3 sec shorter than a typical hemodynamic delay 10,11. Such a significant difference may not be explained by region-specific hemodynamic delays. Instead, the activity of the thalamus, and possibility other brain regions, might be modulated long before EEG alpha modulations. To have a systemic examination of fMRI dynamics around EEG alpha modulations, we investigate the lag-dependent correlations between resting-state fMRI and EEG alpha.Methods
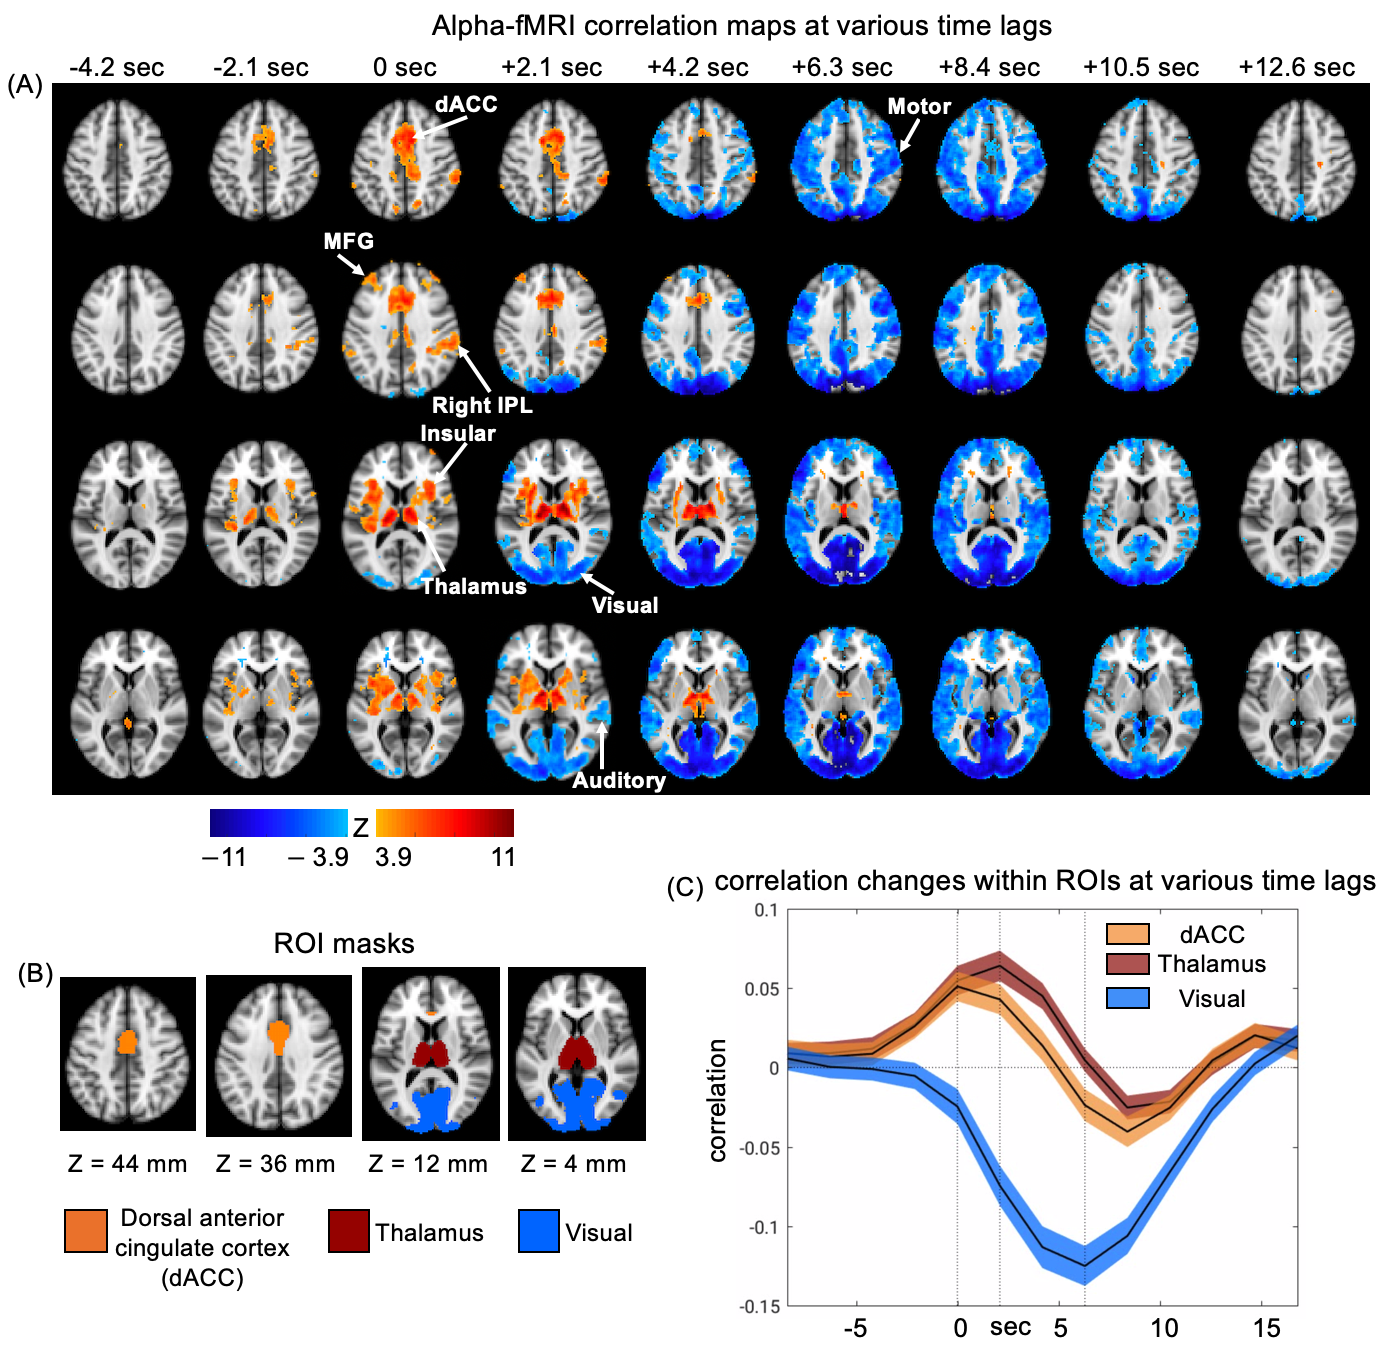
We simultaneously collected EEG and fMRI signals from 17 subjects at the resting state. Each scanning session lasted for 15 min. The gradient and ballistocardiogram artifacts in the EEG data were removed. We used 78 sessions for the following analysis. To extract the alpha-band power, we calculated spectrograms on the occipital electrodes (O1, O2, Oz) using a multi-taper time-frequency transformation by Chronux 12. Then, the power spectrogram was normalized at each frequency bin, averaged across frequency bins within 8-12 Hz and electrodes, and resampled to match with the fMRI signal. The resulting EEG alpha power signal was correlated with the voxel-wise resting-state fMRI signals with different time shifts between the two to obtained correlation maps for different lags. Then the lag-dependent correlation maps were averaged across sessions and converted to z-score maps with reference to a set of control maps, which were the correlation maps between the fMRI and time-reversing EEG alpha power. The masks of thalamus and visual cortex were generated from the Harvard-Oxford atlas 13–16 and Julich histological atlas 17–19 respectively. The dorsal anterior cingulate cortex (dACC) mask was generated based on Harvard-Oxford atlas following a strategy stated in a previous study 20.Results
Correlation maps between EEG alpha power and fMRI BOLD signals at various time lags was calculated and averaged across all 78 sessions. These lag-dependent correlation maps were converted to z-score maps and thresholded at (FDR corrected, Fig. 1A). Distinct correlational patterns were seen at different time lags (Fig. 1A). Specifically, the thalamus and multiple cortical regions, including the dorsal anterior cingulate cortex (dACC), insular, middle frontal gyrus (MFG), and right inferior parietal lobule (IPL) started to show a positive correlation with the EEG alpha with a time lag of -2.1 sec (i.e., the fMRI was shifted ahead of EEG by 2.1 sec). These cortical and thalamic regions are largely overlapped with the cingulo-opercular (CO) network 21,22. In contrast, strong negative correlations were observed mostly in the sensory/motor regions at a time lag of 6-7 sec, which is consistent with the typical hemodynamic delay 26. We further defined three brain masks to cover the dACC, the thalamus, and the visual cortex (Fig. 1B), and then plotted their lag-dependent fMRI correlations to the EEG alpha (Fig. 1C). Despite overall similar dynamics, the dACC appeared to reach its peak correlations with the EEG alpha power at a shorter lag (0 sec) compared with the thalamus (2.1 sec).Discussion
Here we examined the lag-dependent correlations between the resting-state fMRI (rsfMRI) signals and concurrently recorded EEG alpha powers, and found distinct correlational patterns at different lags. At a lag consistent with the canonical hemodynamic delay, i.e., ~6 sec, we found strong negative correlations at the sensory modalities, i.e., somatosensory/motor, auditory, and visual cortices, and confined positive correlations at the thalamus, which are consistent with previous findings 7–9. Surprisingly, significant positive fMRI-EEG correlations were observed at zero lag in a set of very specific brain regions, i.e., the CO network. With considering the hemodynamic delay, the zero-lag correlation suggests that the modulation of CO network neural activity is actually ahead of the EEG alpha modulation, as well as the changes of sensory/motor regions, by seconds. In other words, the EEG alpha modulation is likely embedded in a sequence of brain changes involving multiple networks at different times. A possible candidate is a recently discovered sequential spectral transition (SST) event, which includes a large reduction of alpha-band power and is associated with sensory-dominant fMRI changes 10,27. The SST event has been hypothesized to represent a drop of arousal, and thus a de-activation of the CO network, which is responsible for maintaining tonic alertness 21,22, preceding this event would be consistent with this hypothesis. Overall, the findings in this study provide new insight into the fMRI correlations of the alpha rhythm.Conclusion
The resting-state fMRI correlations with the EEG alpha power show distinct patterns with different time lags between the two, suggesting that the resting-state alpha power changes are embedded in a sequential brain process involving changes of multiple networks at various times.Acknowledgements
This research was supported by the National Institutes of Health (NIH) Pathway to Independence Award (K99/R00) 5R00NS092996-03.References
1. Niedermeyer E. 9 . The Normal EEG of the Waking Adult. 1999.2.
2. Buzsáki G. Rhythms of the Brain.; 2009. doi:10.1093/acprof:oso/9780195301069.001.00013.
3. Bollimunta A, Mo J, Schroeder CE, Ding M. Neuronal mechanisms and attentional modulation of corticothalamic alpha oscillations. J Neurosci. 2011;31(13):4935-4943. doi:10.1523/JNEUROSCI.5580-10.20114.
4. Goldman R, Stern J, Jr JE, Cohen M. Simultaneous EEG and fMRI of the alpha rhythm. Neuroreport. 2002;13(18):2487-2492. doi:10.1097/01.wnr.0000047685.08940.d0.Simultaneous5.
5. Cameron D.H. Neurophysiology of sleep and wakefulness. 2005;11(4):567-586.6.
6. Klimesch W. EEG alpha and theta oscillations reflect cognitive and memory performance: A review and analysis. Brain Res Rev. 1999;29(2-3):169-195. doi:10.1016/S0165-0173(98)00056-37.
7. Liu Z, de Zwart JA, Yao B, van Gelderen P, Kuo LW, Duyn JH. Finding thalamic BOLD correlates to posterior alpha EEG. Neuroimage. 2012;63(3):1060-1069. doi:10.1016/j.neuroimage.2012.08.0258.
8. Horovitz SG, Fukunaga M, De Zwart JA, et al. Low frequency BOLD fluctuations during resting wakefulness and light sleep: A simultaneous EEG-fMRI study. Hum Brain Mapp. 2008;29(6):671-682. doi:10.1002/hbm.204289.
9. Goldman RI, Stern JM, Engel J, Cohen MS. Simultaneous EEG and fMRI of the alpha rhythm. Neuroreport. 2002;13(18):2487-2492. doi:10.1097/00001756-200212200-0002210.
10. Liu X, De Zwart JA, Schölvinck ML, et al. Subcortical evidence for a contribution of arousal to fMRI studies of brain activity. Nat Commun. 2018;9(1):1-10. doi:10.1038/s41467-017-02815-311.
11. Feige B, Scheffler K, Esposito F, Di Salle F, Hennig J, Seifritz E. Cortical and subcortical correlates of electroencephalographic alpha rhythm modulation. J Neurophysiol. 2005;93(5):2864-2872. doi:10.1152/jn.00721.200412.
12. Mitra P, Bokil H. Observed Brain Dynamics. Obs Brain Dyn. 2009:1-404. doi:10.1093/acprof:oso/9780195178081.001.000113.
13. Makris N, Goldstein JM, Kennedy D, et al. Decreased volume of left and total anterior insular lobule in schizophrenia. Schizophr Res. 2006;83(2):155-171. doi:https://doi.org/10.1016/j.schres.2005.11.02014.
14. Frazier JA, Chiu S, Breeze JL, et al. Structural brain magnetic resonance imaging of limbic and thalamic volumes in pediatric bipolar disorder. Am J Psychiatry. 2005;162(7):1256-1265. doi:10.1176/appi.ajp.162.7.125615.
15. Desikan RS, Ségonne F, Fischl B, et al. An automated labeling system for subdividing the human cerebral cortex on MRI scans into gyral based regions of interest. Neuroimage. 2006;31(3):968-980. doi:https://doi.org/10.1016/j.neuroimage.2006.01.02116.
16. Goldstein JM, Seidman LJ, Makris N, et al. Hypothalamic Abnormalities in Schizophrenia: Sex Effects and Genetic Vulnerability. Biol Psychiatry. 2007;61(8):935-945. doi:https://doi.org/10.1016/j.biopsych.2006.06.02717.
17. Eickhoff SB, Stephan KE, Mohlberg H, et al. A new SPM toolbox for combining probabilistic cytoarchitectonic maps and functional imaging data. Neuroimage. 2005;25(4):1325-1335. doi:10.1016/j.neuroimage.2004.12.03418.
18. Eickhoff SB, Heim S, Zilles K, Amunts K. Testing anatomically specified hypotheses in functional imaging using cytoarchitectonic maps. Neuroimage. 2006;32(2):570-582. doi:10.1016/j.neuroimage.2006.04.20419.
19. Eickhoff SB, Paus T, Caspers S, et al. Assignment of functional activations to probabilistic cytoarchitectonic areas revisited. Neuroimage. 2007;36(3):511-521. doi:10.1016/j.neuroimage.2007.03.06020.
20. Klumpp H, Fitzgerald JM, Kinney KL, et al. Predicting cognitive behavioral therapy response in social anxiety disorder with anterior cingulate cortex and amygdala during emotion regulation. NeuroImage Clin. 2017;15(March):25-34. doi:10.1016/j.nicl.2017.04.00621.
21. Sadaghiani S, Scheeringa R, Lehongre K, Morillon B, Giraud A-L, Kleinschmidt A. Intrinsic connectivity networks, alpha oscillations, and tonic alertness: a simultaneous electroencephalography/functional magnetic resonance imaging study. J Neurosci. 2010;30(30):10243-10250. doi:10.1523/JNEUROSCI.1004-10.201022.
22. Sadaghiani S, D’Esposito M. Functional characterization of the cingulo-opercular network in the maintenance of tonic alertness. Cereb Cortex. 2015;25(9):2763-2773. doi:10.1093/cercor/bhu07223.
23. Singh-Curry V, Husain M. The functional role of the inferior parietal lobe in the dorsal and ventral stream dichotomy. Neuropsychologia. 2009;47(6):1434-1448. doi:10.1016/j.neuropsychologia.2008.11.03324.
24. Japee S, Holiday K, Satyshur MD, Mukai I, Ungerleider LG. A role of right middle frontal gyrus in reorienting of attention: A case study. Front Syst Neurosci. 2015;9(MAR):1-16. doi:10.3389/fnsys.2015.0002325.
25. Andersson M, Ystad M, Lundervold A, Lundervold AJ. Correlations between measures of executive attention and cortical thickness of left posterior middle frontal gyrus - a dichotic listening study. Behav Brain Funct. 2009;5(1):41. doi:10.1186/1744-9081-5-4126.
26. Buxton RB, Uludaǧ K, Dubowitz DJ, Liu TT. Modeling the hemodynamic response to brain activation. Neuroimage. 2004;23(SUPPL. 1):220-233. doi:10.1016/j.neuroimage.2004.07.01327.
27. Liu X, Yanagawa T, Leopold DA, et al. Arousal transitions in sleep, wakefulness, and anesthesia are characterized by an orderly sequence of cortical events. Neuroimage. 2015;116:222-231. doi:10.1016/j.neuroimage.2015.04.003
Figures