3924
How brain reacts to attack at a hub region1The Huck Institutes of the Life Sciences, Penn State University, University Park, PA, United States, 2Biomedical Engineering, Penn State University, University Park, PA, United States
Synopsis
The brain function is a network phenomenon. However, exactly how brain network reconfigures when a brain region stops functioning is virtually unknown. By combining chemogenetic and resting-state fMRI methods in an awake rats, we investigated the causal impact of inactivating a hub region, dorsal anterior cingulate cortex on brain network properties. We found that disrupting hub activity changed organization of the default-mode network (DMN) and DMN-related behavior. It also altered topological architecture of the whole-brain network. Our study established a system that allows for mechanistically dissecting the relationship between local regions and the whole brain network organization.
Introduction
The neural substrates causing the large-scale network alterations observed in brain disorders remain elusive. A key hypothesis is the dysfunction of brain hub regions. Thus, comprehensively understanding the causal relationship between hub activity and brain network organization is critical. Given the difficulty to test it directly in humans, we developed a platform to investigate how brain network reconfigures by local region manipulation in rodents. We combined the chemogenetics and resting-state fMRI in awake rodents to investigate the causal impact of manipulating a hub region, dorsal anterior cingulate cortex (dACC), on brain network function and organization, as well as the related behavior.Methods
Animals were stereotactically injected with adeno-associated viruses (AAVs) expressing inhibitory G-protein coupled hM4Di receptor with a pan-neuronal synapsin promoter (AAV8.hSyn.hM4Di.mCherry, Addgene). After recovery and protein expression, animals received either Clozapine-N-Oxide (CNO) or saline 30 min before electrophysiology recording, rsfMRI scanning or behavioral tests. We acquired T2*-weighted gradient-echo rsfMRI images using the echo-planar-imaging (EPI) sequence with the following parameters: repetition time = 1000ms; echo time = 15ms; matrix size = 64×64; field of view = 3.2 × 3.2 cm2; slice thickness = 1mm; flip angle = 60; Volume:600. All acquired image data were preprocessed with the following steps including coregistration, realignment (SPM12), spatial smoothing, voxel-wise nuisance regression of motion parameters, as well as the signals from the white matter and ventricles, and bandpass filtering (0.01-0.1Hz). The further analysis includes seed-based analysis, ROI-based analysis, graph analysis, fALFF, and BOLD amplitude calculation. Animals also underwent two behavioral sessions with either CNO or saline injection with a random order separated by at least 7 days. Each session was composed of a 45 min home-cage test. Behaviors including the total distance traveled, mean speed, time of mobility and time of immobility for at least 2s were recorded by an infrared camera and analyzed by behavioral tracking software (ANY-maze, 483 Stoelting Co., Wood Dale, IL).Results
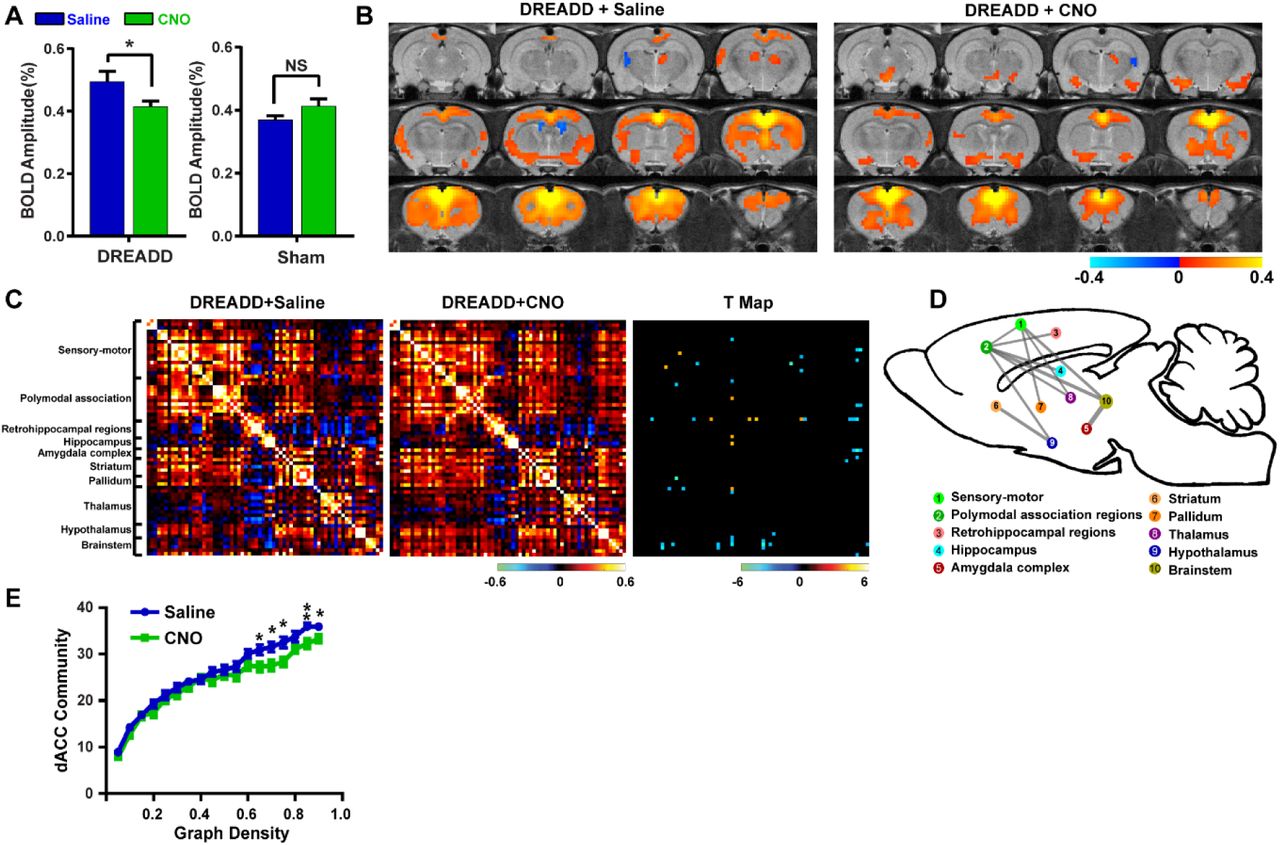
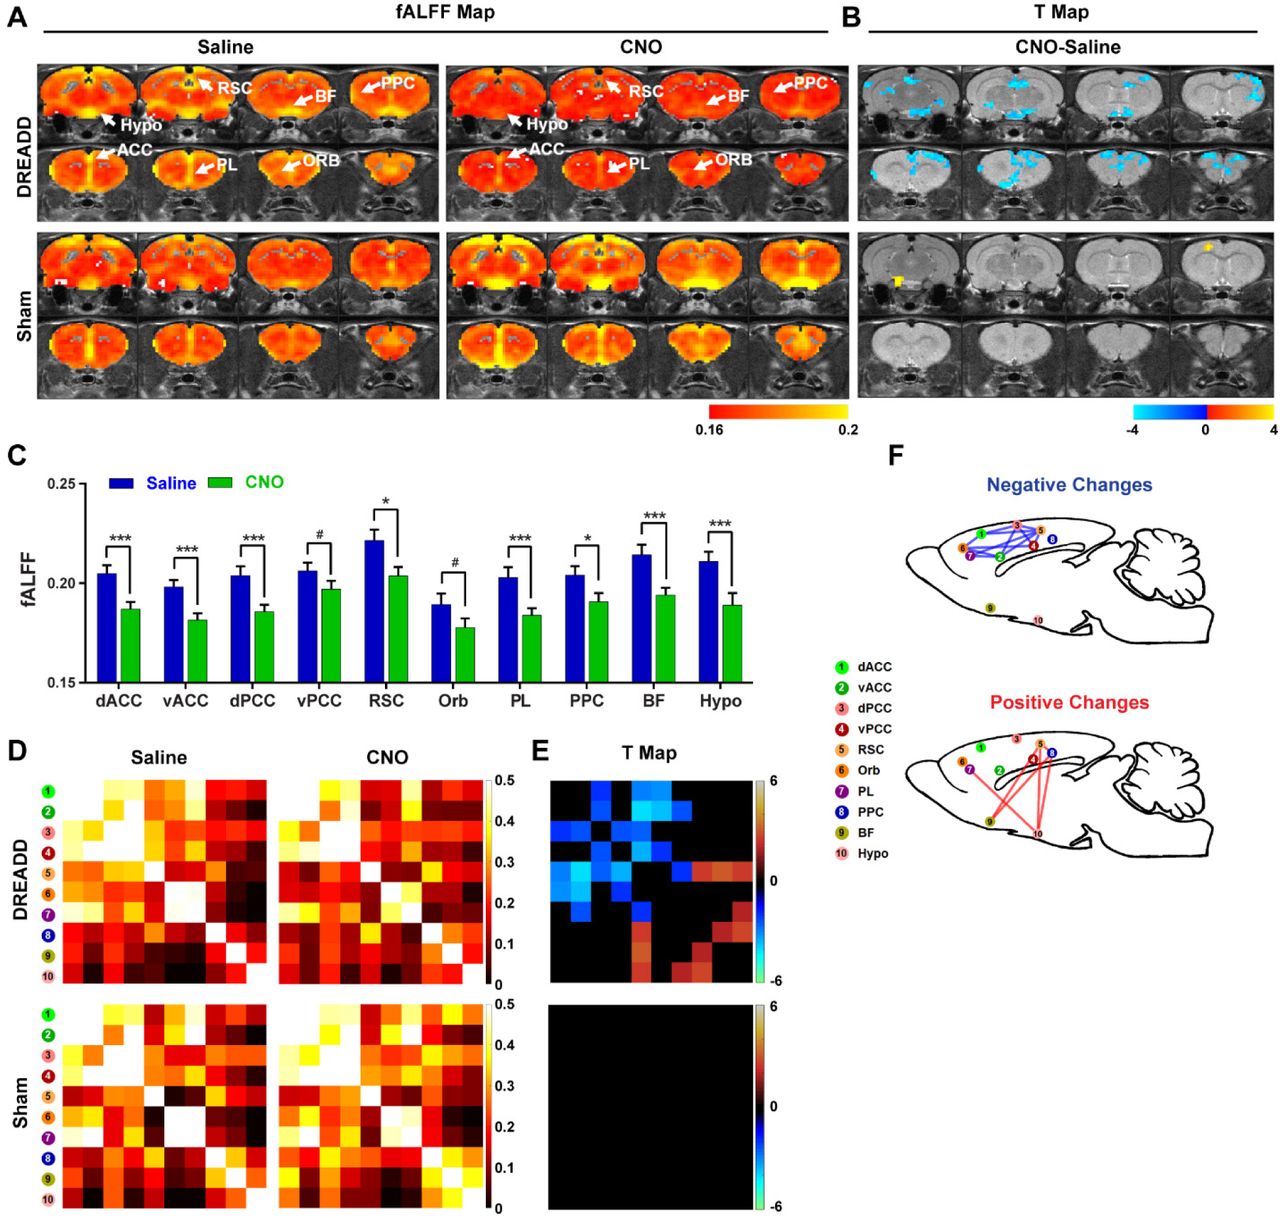
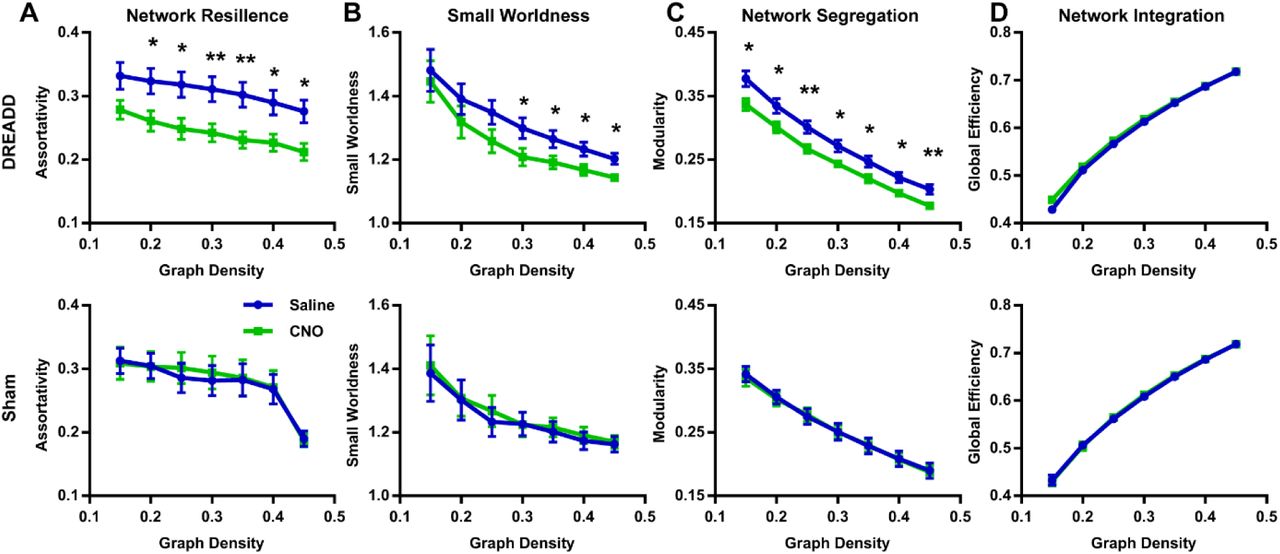
We first validated the inhibitory effect of DREADD and observed suppressed both evoked and spontaneous neural activities in local regions. Suppressing the dACC reduced its BOLD amplitude, RSFC in dACC seedmaps and size of dACC-related modules, indicating the local disruption by inactivation (fig 1). Our data show that suppressing the dACC disrupted activity and connectivity across the whole DMN, and DMN activity changes were correlated with altered DMN-related behaviors (fig.2; fig.3). These data suggest that, like humans, DMN in rodents is a functional network with coordinated activity to mediate behavior. Furthermore, we demonstrate that suppressing the dACC impacts the organization of the whole-brain network including network resilience, segregation and small worldness, but not network integration (fig.4). All these changes are absent in sham rats or when a non-hub region is suppressed.Discussion
The discovery of rodent DMN was mainly based on the anatomical resemblance of the network structure with the DMN in humans and primates1,2, but its functional role in behavior remains unclear. Our results support the concept that, like humans and primates, the DMN in rodents is a functional network with coordinated neural activity from distributed brain regions, and this network might support behavior related to internally oriented brain states. The topological changes resulting from hub inactivation, including reduced network resilience, segregation and small worldness, are important for our understanding of the role of individual regions in the global brain network organization. Our data revealed that changes in a hub, but not a non-hub, can significantly alter brain network topology. These results provide critical insight into understanding the pathogenesis of neurological and psychiatric disorders, which indicate that altered brain topological properties reported in these brain disorders might start from dysfunction of certain hub nodes.Conclusion
This study provides direct measurement of the brain’s response to targeted attack at a hub region, and presents a comprehensive framework demonstrating the pivotal role of hubs in the brain network. By combining DREADDs and rsfMRI in an awake rodent model, we have established a system that enables us to manipulate the activity in any brain region, and measure the corresponding changes in brain-wide networks. This system allows for mechanistically dissecting the causal relationship between a (or multiple) local brain region(s) and brain network properties.Acknowledgements
We would like to thank Yikang Liu and David Dopfel for their technical support. The present study was partially supported by National Institute of Neurological Disorders and Stroke Grant R01NS085200 (PI: Nanyin Zhang, PhD) and National Institute of Mental Health Grant R01MH098003 and RF1MH114224 (PI: Nanyin Zhang, PhD).References
1. Stafford, J. M. et al. Large-scale topology and the default mode network in the mouse connectome. Proc. Natl. Acad. Sci. U. S. A. (2014). doi:10.1073/pnas.1404346111
2. Lu, H. et al. Rat brains also have a default mode network. Proc. Natl. Acad. Sci. (2012). doi:10.1073/pnas.1200506109
Figures