3922
Mapping the brain-wide network effects by optogenetic activation of the corpus callosum with an MRI-guided robotic arm1Research Group of Translational Neuroimaging and Neural Control, High-field Magnetic Resonance, Max Planck Institute for Biological Cybernetics, Tübingen, Germany, 2Graduate School of Neural Information Processing, University of Tübingen, Tübingen, Germany, 3Werner Reichardt Center for Integrative Neuroscience, Tübingen, Germany, 4Laboratory of Functional and Molecular Imaging, National Institute of Neurological Disorders and Stroke, National Institutes of Health, Bethesda, MD, United States, 5Athinoula A. Martinos Center for Biomedical Imaging, Massachusetts General Hospital and Harvard Medical School, Charlestown, MA, United States
Synopsis
This study not only specifies the optogenetically driven corpus callosum-mediated regulation of the local excitation/inhibition balance in the local barrel cortex, but also depicts the power of the multi-modal fMRI to characterize the brain-wide network activity associated with circuit-specific optogenetic activations. It highlights a vital aspect of the brain-wide activation for circuit-specific causality studies with optogenetic tools.
Introduction
The transcallosal inhibition explains dampened cortical responses with bilateral-stimulation paradigm in both human and rodents (1-4). Recently, the optogenetically driven manipulation of corpus callosum-specific activity enabled direct investigation of functional roles of callosal projections on regulating the interhemispheric excitatory-inhibitory balance in animals. However, its global effect is rarely reported. Here, we optogenetically activated CC (5) and provided direct evidence for CC-mediated inhibition with fMRI, showing that the direct callosal inputs suppressed evoked calcium and BOLD signals in the barrel cortex (BC) by whisker stimulation. Our work links the callosal circuit-specific regulation to the global brain dynamic changes based on the interhemispheric inhibition (6-8).Methods
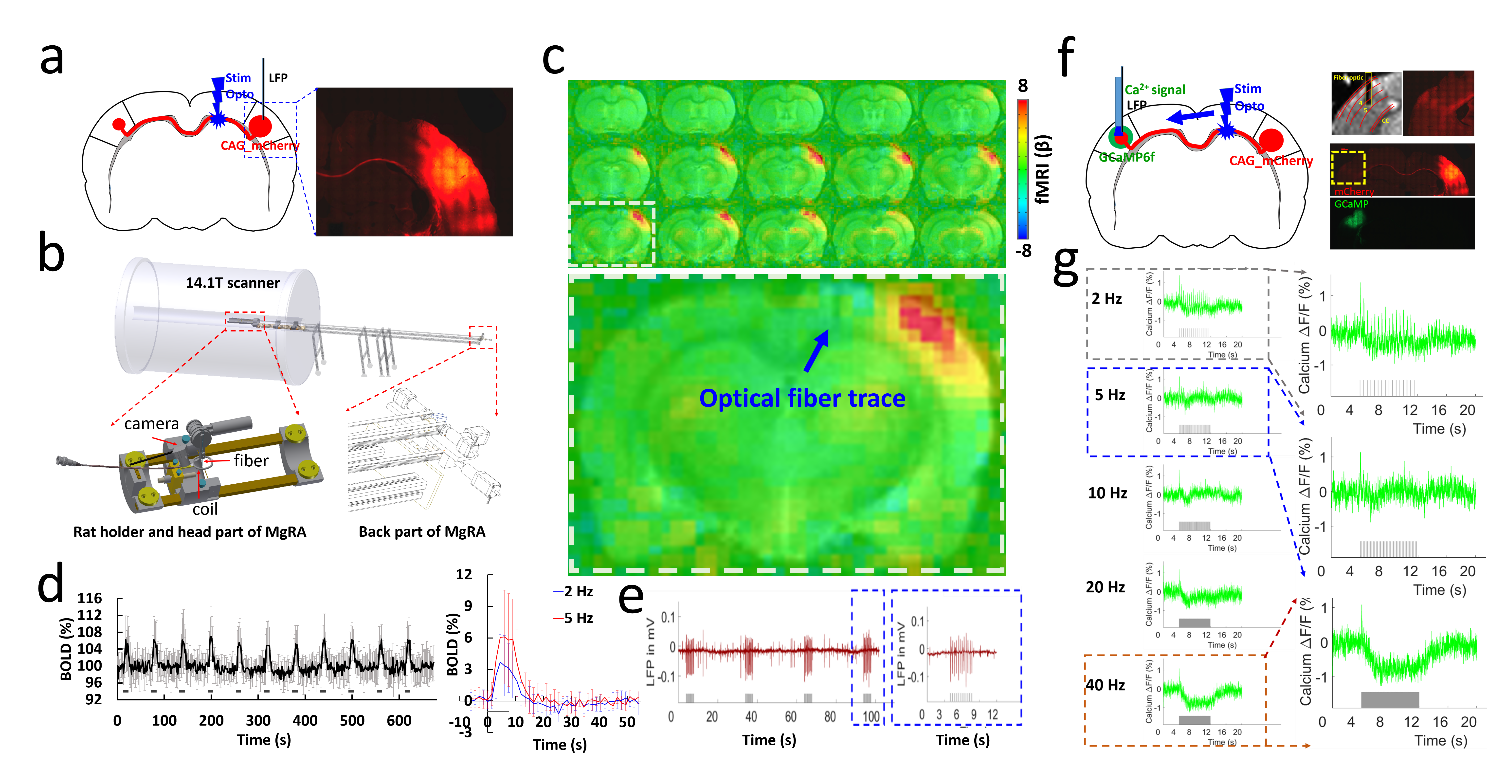
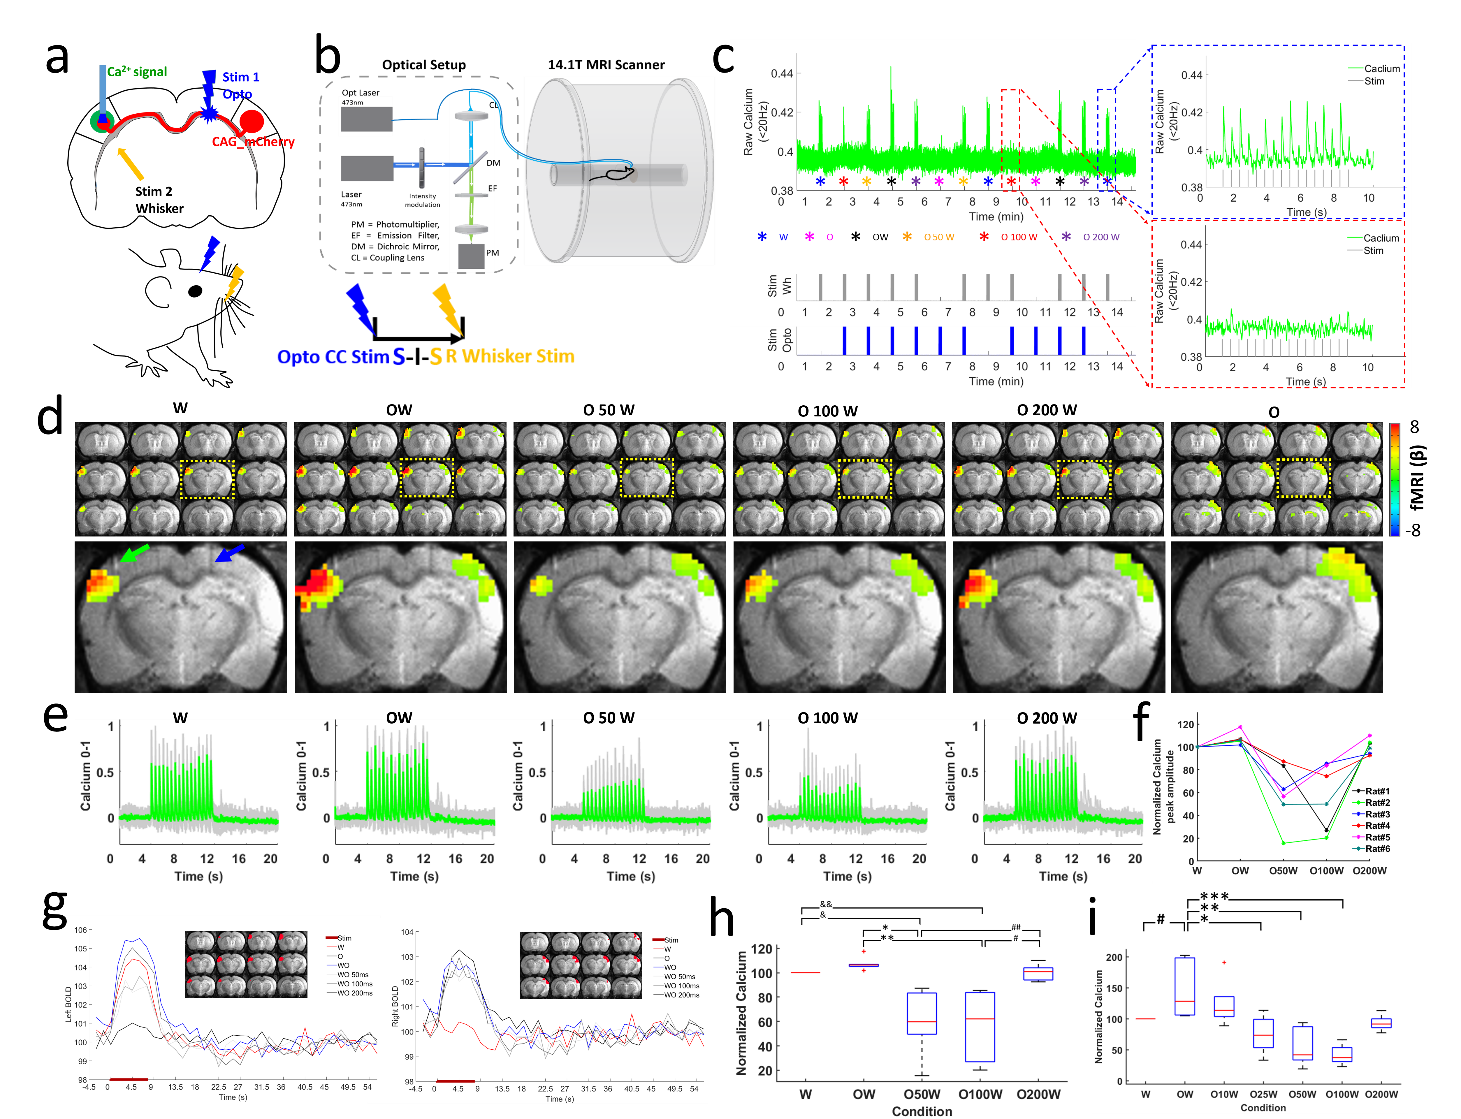
AAV.CaMKII.ChR2.mCherry was injected into the BC of rats, expressed in callosal projection neurons and along their axonal fiber bundles projecting to the opposite BC (Fig.1a), where the GCaMP6f was expressed (Fig.1f). Optogenetic stimulation was delivered to the corpus callosum, followed by a whisker stimulus to the whisker pad with different intervals, i.e., 6 conditions, whisker stimuli only (W), CC stimuli only (O), CC stimuli and whisker stimuli together (OW), CC stimuli and 50 ms, 100 ms, 200 ms delayed whisker stimuli (O50W, O100W, O200W), and the paired conditions of each trail were randomized (Fig. 2c). Whole brain BOLD signals were acquired with simultaneous calcium signal in the BC while an MRI-guided robotic arm was used to precisely target the callosal fiber bundle to deliver blue light pulses (473nm) at 2 Hz, 10 ms width for the fMRI block design (8 s on/52 s off,13 epochs,Fig.2b,c). Whole brain 3D EPI: TR,1.5 s, 400×400×400 μm3 spatial resolution. MRI data analysis was performed using Analysis of Functional NeuroImages software (NIH, Bethesda).Results
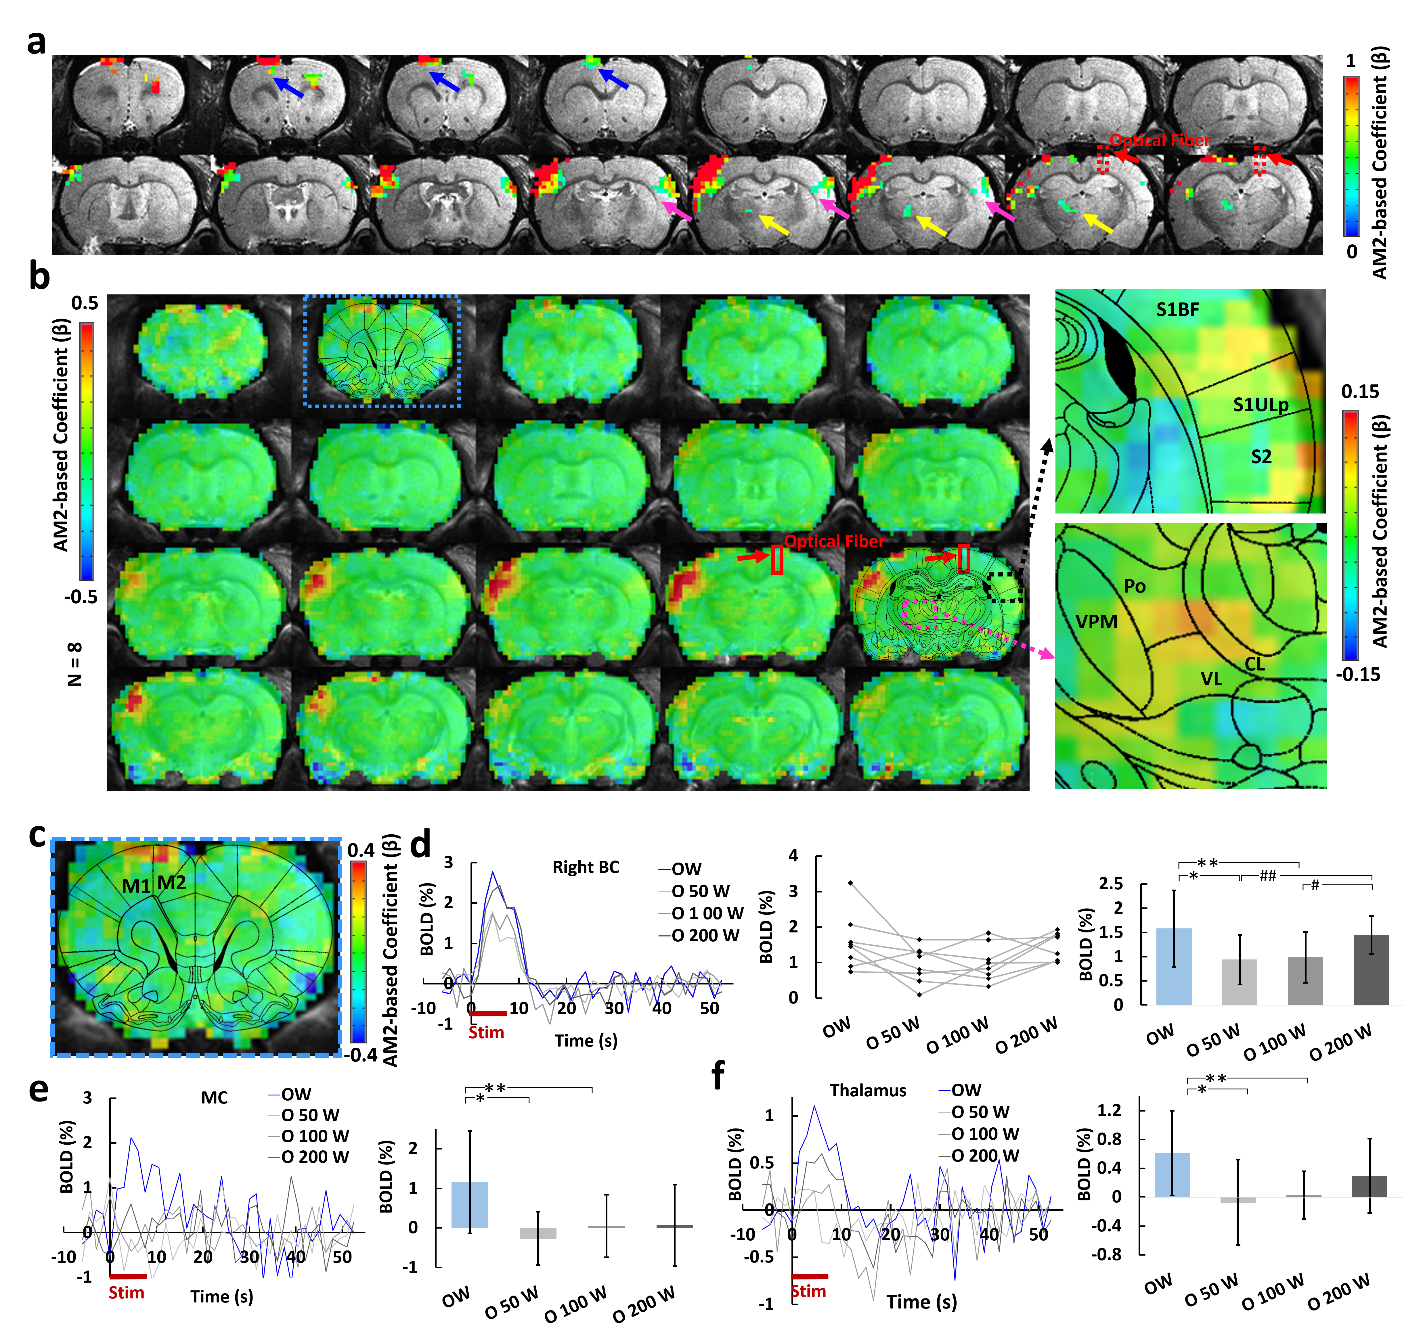
Upon the optogenetic stim on CC, salient BOLD signal was detected due to the antidromic activity from the axonal fibers backward to the soma of callosal projection neurons in the ipsilateral BC (Fig.1c,d), further confirmed by LFP (Fig.1e). For the orthodromic activity, there was clear spike for each stimulus at 2 Hz, while with higher frequencies, light flashes 2-16 induced responses were consistently weaker than the first response (Fig.1g). Moreover, there was a baseline drift during the whole 40Hz stimulation period (Fig.1g), therefore, confirming the CC-mediated interhemispheric inhibition. With two stimuli paradigm (Fig. 2a), the antidromic activity in the right cortex kept similar for 6 conditions, while the BOLD and calcium signals in the left cortex induced by paired whisker stimuli was the strongest for OW condition, was suppressed for the O50W and O100W conditions (Fig.2d-h), almost recovered for the O200W condition. The calcium-amplitude modulation (AM)-based correlation with whole-brain fMRI signal revealed that the inhibitory effects spread to contralateral BC as well as ipsilateral MC and PO (Fig.3).Conclusion
Upon specific corpus callosum optogenetic stimulation, we not only detected strong antidromic neuronal activity, but also detailed temporal dynamics through CC-mediated orthodromic inhibitory activity. Moreover, the calcium amplitude-based correlation map was created to reveal the CC-mediated brain-wide inhibitory effects. This work raises the need of multi-modal fMRI platform to elucidate the brain-wide network activation in response to projection-specific optogenetic stimulation.Acknowledgements
We thank Mr. S. Yu for building up the first prototype of the robotic arm and Mr. J. Boldt for helping to improve the MgRA system. This research was supported by NIH Brain Initiative funding (RF1NS113278-01), the S10 instrument grant (S10 RR023009-01) to Martinos Center, German Research Foundation (DFG) Yu215/3-1, BMBF 01GQ1702, internal funding from Max Planck Society, the China Scholarship Council (Ph.D. fellowship to Y. Chen) and the intramural research program of NINDS (A. P. Koretsky).References
1. Schnitzler A, Kessler KR, & Benecke R (1996) Transcallosally mediated inhibition of interneurons within human primary motor cortex. Exp Brain Res 112(3):381-391.
2. Bocci T, et al. (2011) Transcallosal inhibition dampens neural responses to high contrast stimuli in human visual cortex. Neuroscience 187:43-51.
3. Ogawa S, et al. (2000) An approach to probe some neural systems interaction by functional MRI at neural time scale down to milliseconds. Proc Natl Acad Sci U S A 97(20):11026-11031.
4. Nemoto M, et al. (2012) Diversity of neural-hemodynamic relationships associated with differences in cortical processing during bilateral somatosensory activation in rats. Neuroimage 59(4):3325-3338.
5.Yu X, et al. (2013) Targeting projection fibers for optogentics and fMRI. ISMRM.
6. Palmer LM, et al. (2012) The cellular basis of GABA(B)-mediated interhemispheric inhibition. Science 335(6071):989-993.
7. Kawaguchi Y (1992) Receptor subtypes involved in callosally-induced postsynaptic potentials in rat frontal agranular cortex in vitro. Exp Brain Res 88(1):33-40.
8. Kumar SS & Huguenard JR (2001) Properties of excitatory synaptic connections mediated by the corpus callosum in the developing rat neocortex. J Neurophysiol 86(6):2973-2985.
Figures