3921
EMD-derived Energy-Period Profiles of Brain Networks in fMRI Resting-State Data: An Application to Parkinson’s Disease1Cleveland Clinic Lou Ruvo Center for Brain Health, Las Vegas, NV, United States, 2University of Colorado, Boulder, CO, United States, 3University of Management & Technology, Lahore, Pakistan, 4University of North Texas Health Science Center, Fort Worth, TX, United States, 5Muhammad Ali Parkinson Center at Barrow Neurological Institute, Phoenix, AZ, United States
Synopsis
Traditionally, functional networks in resting-state data were investigated with Fourier and wavelet-related methods to characterize their frequency content. In this study, Empirical Mode Decomposition (EMD), a nonlinear method, is used to determine energy-period profiles of Intrinsic Mode Functions (IMFs) for different resting-state networks. In an application to early Parkinson’s disease (PD) vs. normal controls (NC), energy and period content were computed with EMD and compared with results using short-time Fourier transform (STFT) and maximal overlap discrete wavelet transform (MODWT) methods. Using a support vector machine, EMD achieved highest prediction accuracy in classifying NC and PD subjects among the three methods.
Introduction
Previous neuroimaging studies of Parkinson’s disease (PD) patients have shown that whole-brain functional networks such as the default mode network (DMN) and networks involving the motor pathway are affected, leading to different functional connectivity when compared to normal controls (NC)1. Other studies of the temporal characteristics of these brain networks have also shown abnormal spontaneous low-frequency content in PD2. To measure changes in resting-state networks for PD in the early stages (first 3 years) in unmedicated patients is difficult with conventional linear methods. The purpose of this study is to examine common resting-state networks in early-stage PD in more detail by using Empirical Mode Decomposition3 (EMD), which is a nonlinear method, and compare results with standard short-time Fourier transform (STFT) and maximal overlap discrete wavelet transform (MODWT) methods. EMD is a data driven-method that partitions a time series into naturally occurring intrinsic mode functions (IMFs) where each IMF occupies a characteristic frequency band4. To investigate differences in the time signatures of resting-state networks in PD vs NC, we compare energy and period information5 for IMFs.Methods
We obtained data from the publicly available anonymized Parkinson's Progression Markers Initiative (PPMI) database6 and included 18 NCs (14 Male (M); age: 64.25±9.78 years (mean ± SD), years of education 16.72 ± 2.67 years) and 18 newly diagnosed, early-stage, and never medicated PD subjects (10 M; age: 57.11±11.63 years; years of education: 17.00±2.77 years; disease duration: 0.83±0.84 years) in our analysis. Differences in gender, age, and years of education were not found to be statistically significant. Briefly, all subjects underwent resting-state fMRI scans on 3T Siemens scanners (8 min 24 seconds, EPI, 210 time points, TR = 2400ms, TE = 25ms, FOV = 22.4 cm, flip angle = 80deg, resolution = 3.3 × 3.3 × 3.3 mm3, 40 axial slices). Standard preprocessing methods were used. Group ICA (using fastICA7) was performed by stacking all data (NC+PD) in the temporal domain to obtain 30 resting-state networks. Then, spatial regression8 was used on the networks of the group time series data to obtain the time series for the NC group and for the PD group. STFT, MODWT, and EMD were used to decompose the time series of the resting-state networks into components covering a frequency range from 0.01Hz to the Nyquist frequency (0.5/TR) of the data. For each component and method, the average instantaneous energy, period, and their standard deviations were computed for NC and PD. To quantify the significance of the energy-period relationships, we carried out a leave-one-out classification with a linear support vector machine (SVM) using 10 different regularization values (0.01:0.01:0.1) of the SVM box constraint.Results
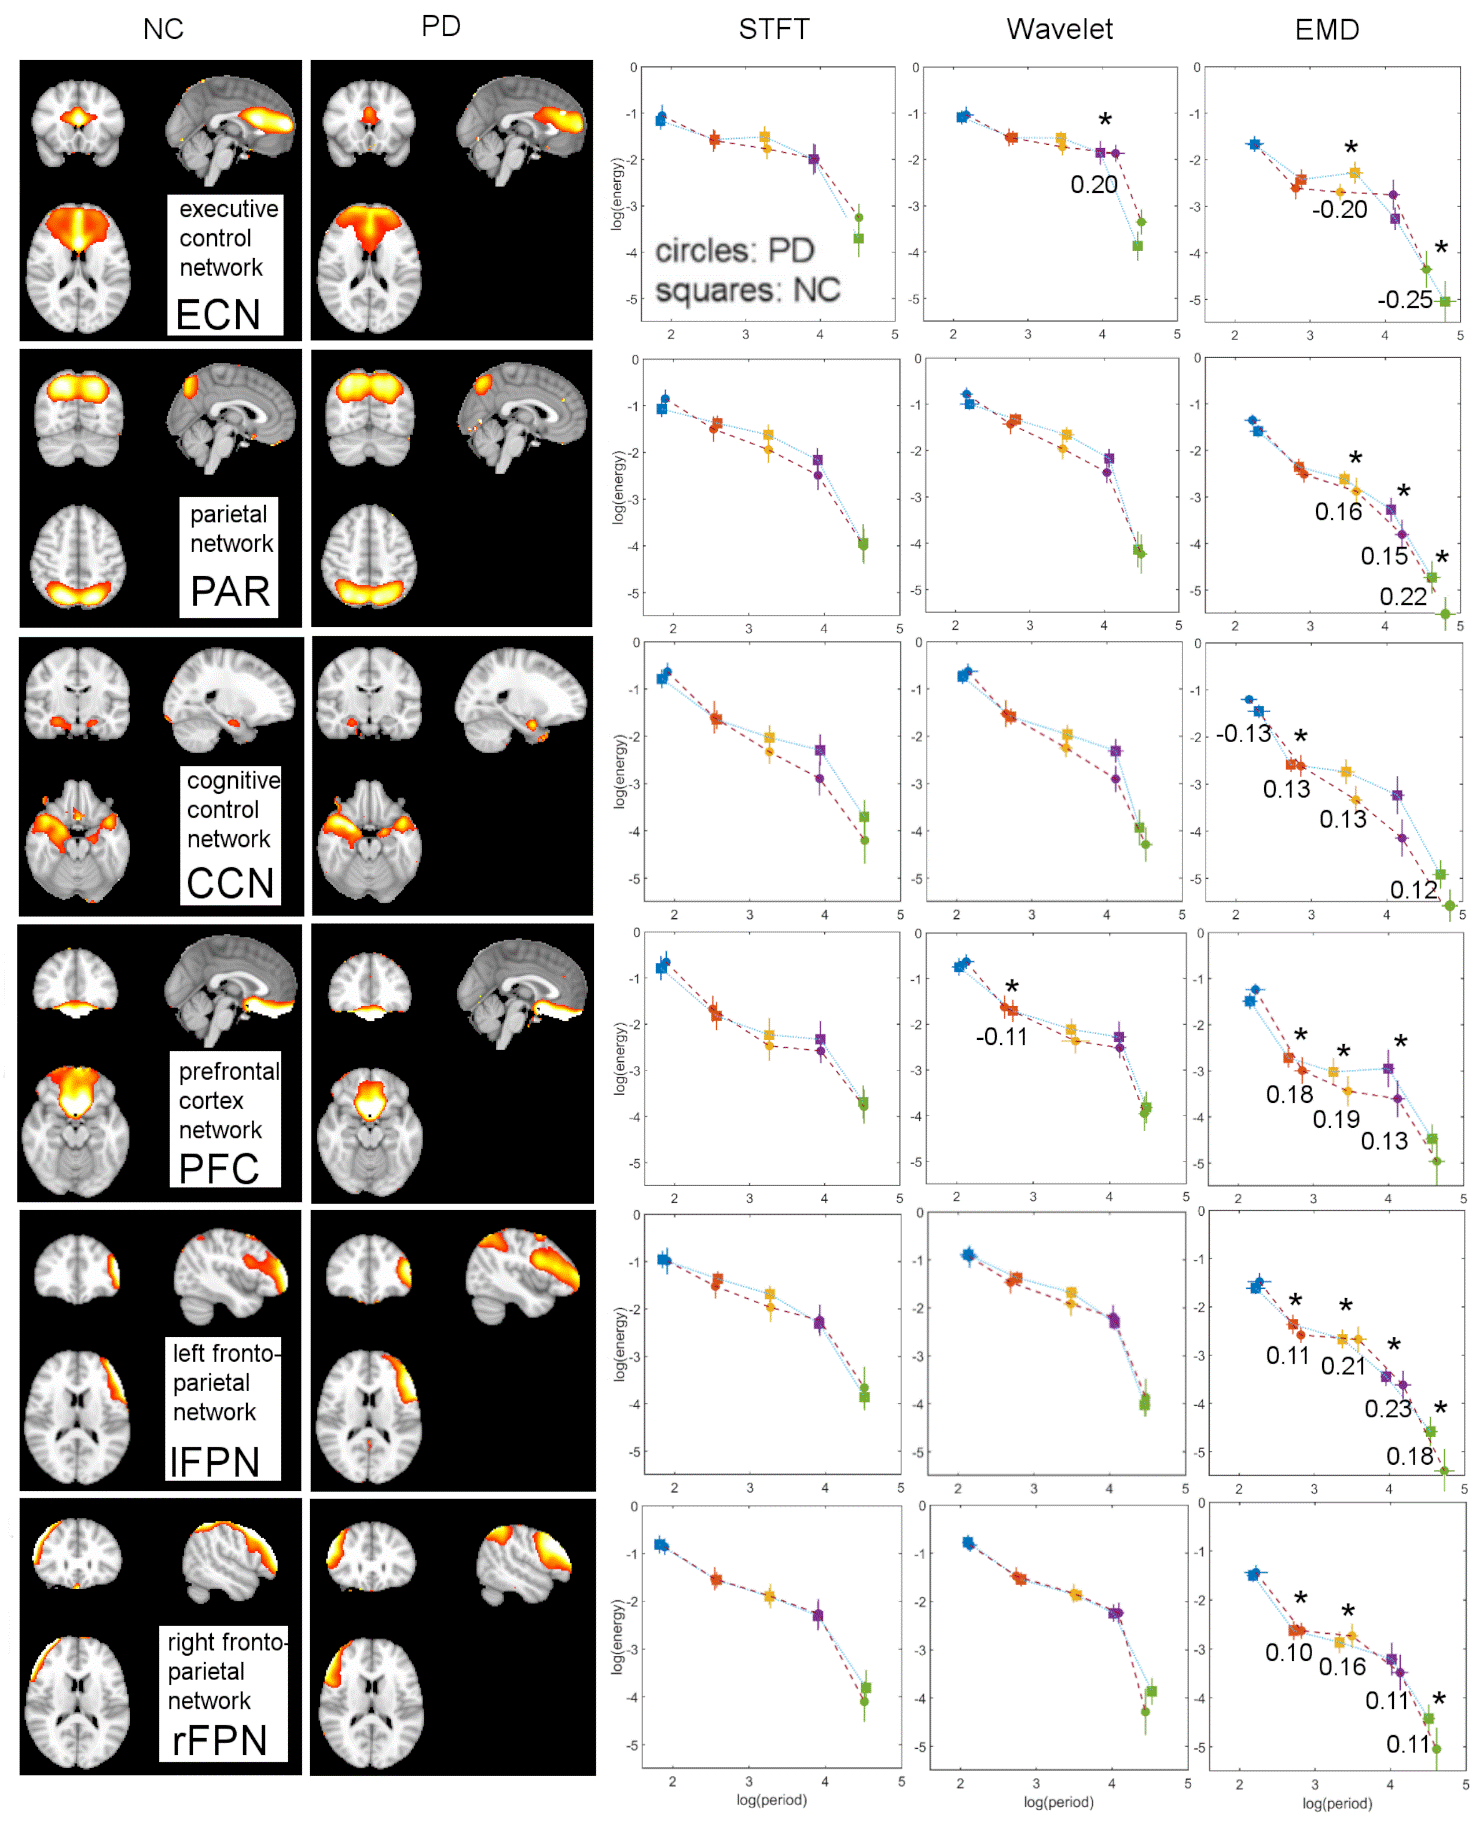
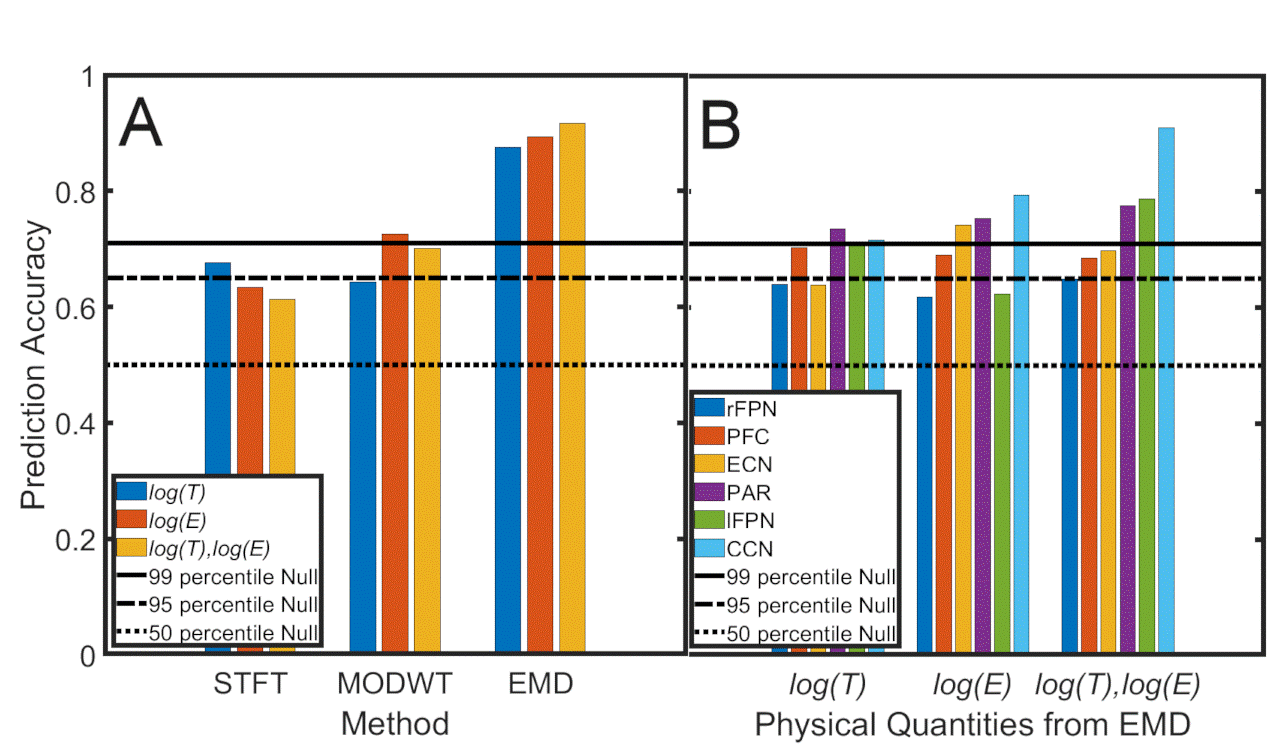
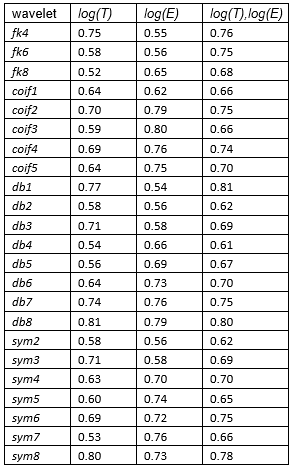
Fig.1 shows the spatial maps and corresponding energy-period profiles for six resting-state networks for the three different methods (STFT, MODWT (with db6 wavelet) and EMD). The studied networks are the executive control network (ECN), the parietal network (PAR), the cognitive control network (CCN), the (inferior) prefrontal cortex network (PFC), and the left/right frontoparietal networks (lFPN, rFPN). Most significant differences in period and energy content between NC and PD were found by EMD (indicated by a star). Average prediction accuracies were determined for log(T) data, log(E) data, and both log(T) and log(E) data of all six resting-state networks combined and for each method (STFT, MODWT (with db6 wavelet), EMD) (Fig.2A). Furthermore, network-specific prediction accuracies were computed and are shown for EMD only in Fig.2B. The null distribution of the prediction accuracy was also computed using permutation analysis. Fig.2A shows clearly that EMD has the highest prediction accuracy (0.92) among the three methods using the combined resting-state networks. Though different wavelets lead to slightly different prediction accuracies (Table 1), the values obtained are still inferior to EMD. For EMD, the prediction accuracy is well above the 99 percentiles of the null distribution. For the individual networks in Fig.2B we obtained that prediction accuracies using period information are either close or above the 95 percentiles of the null distribution.Discussion
In PD, changes in whole-brain functional connectivity have been recently observed affecting wide-spread cortical regions. We demonstrated that in early-stage, never-medicated PD there are significant differences in the temporal and energy characteristics of several whole-brain resting-state networks when EMD is applied, which cannot be found with STFT and MODWT, independent of the type of wavelet.Conclusion
In a clinical application to early PD, we used EMD to study the energy and period content of IMFs for typical resting-state networks. EMD showed the largest differences between PD and NC subjects. Most IMFs of the PAR, CCN, PFC, lFPN, and rFPN resting-state networks were found to have decreased frequency (increased period) and reduced energy content in PD (compared to NC). Using a support-vector machine classifier showed that EMD achieves highest prediction accuracies.Acknowledgements
The research was supported by the National Institute of Health (grant number 1R01EB014284 and COBRE P20GM109025). Data used in the preparation of this article were obtained from the Parkinson’s Progression Markers Initiative (PPMI) database (www.ppmi-info.org/data).References
1. Van Eimeren, T, Monchi, O, Ballanger, B, Strafella, A.P. Dysfunction of the Default Mode Network in Parkinson’s Disease: A functional magnetic resonance study. Arch Neurol 2009, 66:877-883.
2. Hu, X-F, Zhang, J-Q, Jiang, X-M, Zhou, C-Y, Wei, L-Q, Yin, X-T, Li, J, Zhang, Y-L, Wang, J. Amplitude of Low-frequency Oscillations in Parkinson’s Disease. Chin Med J (Engl) 2015, 128:593-601.
3. Huang, N.E. and Shen, S.S.P. 2014. Hilbert Huang Transform and its Applications. Interdisciplinary Mathematical Sciences, Vol.16. World Scientific Publishing Co. PTe. Ltd. Singapore.
4. Flandrin, P, et al. Empirical mode decomposition as a filter bank, IEEE Sig. Proc. Letters 2004, 11(2), 112-114.
5. Huang, N. E., Shen, Z., Long, S.R., Wu, M.C., Shih, H.H., Zheng, Q., Yen, N.-C., Tung, C.C., Liu, H.H. 1998. The empirical mode decomposition and the Hilbert spectrum for nonlinear and non-stationary time series analysis. Proc. R. Soc. Lond. A 454, 903-995.
6. Marek, K., Jennings, D., Lasch, S., Siderowf, A., Tanner, C., Simuni, T., ..., Taylor, P. (2011). The Parkinson Progression Marker Initiative (PPMI). Progress in Neurobiology, 95(4), 629-635. https://doi.org/10.1016/j.pneurobio.2011.09.005.
7. Hyvärinen, A. 1999. Fast and Robust Fixed-Point Algorithms for Independent Component Analysis. IEEE Transactions on Neural Networks 10(3):626-634.
8. Beckmann, C.F., Mackay, C.E., Filippini, N., Smith, S.M. 2009. Group comparison of resting-state FMRI data using multi-subject ICA and dual regression. Organization of Human Brain Mapping Conference, San Francisco.
Figures