3920
Evidences of Disrupted Temporal Variabilities in patients with subjective cognitive decline: a resting-state fMRI study1Radiology department, The First Affiliated Hospital of Nanjing Medical University, Nanjing, China, 2Rehabilitation Department, The First Affiliated Hospital of Nanjing Medical University, Nanjing, China, 3Rehabilitation Department, Nanjing Drum Tower Hospital, The Affiliated Hospital of the Medical School at Nanjing University, Nanjing, China, 4Nanjing Medical University, Nanjing, China, 5MR Research China, GE Healthcare, Beijing, China
Synopsis
In this study, the whole brain temporal variability (TV) changes have been respectively investigated for patients with subjective cognitive decline (SCD) and mild cognitive impairment (MCI) and healthy controls (HCs). Significantly different TVs have been separately found between SCD, MCI patients and HCs in the regions involved in executive function, episodic memory, visual processing and visual memory and language perception and processing. Additionally, the TVs at these regions also showed strong correlations with multiple clinical scales. Therefore, TV method can be considered an effective tool in the early detection of SCD patients.
Introduction
Elderly persons with subjective cognitive decline (SCD) perceive memory decline, but are usually determined clinically without objective neuropsychological dysfunction1. These patients are considered at high risk of cognitive decline, and will eventually progress to mild cognitive impairment (MCI) and further to Alzheimer's Disease (AD)1.So far, a number of functional MRI (fMRI) studies on MCI and AD diseases have extensively focused on the static characterizations of blood-oxygen-level-dependent (BOLD) signals.2,3 However, our human brain is a constantly changing system. To understand the dynamic process of our brain and how it accounts for clinical disease is nontrivial. Lately, a significant temporal and spatial variability changes were found in posterior cingulate gyrus, hippocampus, amygdala, precuneus and temporal pole in patients with early MCI.4
It remains however, unknown if SCD patients have associated with aberrant temporal variabilities, and if those changes are correlated to cognitive assessments. To investigate this, the temporal variability (TV) index was correspondingly calculated in patients with SCD and MCI as well as health controls, and then compared between each two groups. In addition, the correlations between the region-specific TVs for all subjects and each of clinical scales were estimated, respectively.
Materials and Methods
SubjectsIn total, 36 patients, of which 18 patients (mean age: 70.33±6.84 years) were clinically confirmed with SCD and the rest 18 (mean age: 71.11±6.98 years) were diagnosed with MCI, have been recruited in this study. For comparison, 26 health controls (HCs, mean age: 72.35±5.59 years) were also included.
Each subject involved was assessed with multiple clinical scales, including Mini-Mental-State-Examination (MMSE), Montreal-Cognitive-Assessment, Wechsler-Memory-Scale-Revised-logical-memory-Test, Trail-Making-Test (TMT) A&B, Auditory-Verbal-Learning-Test (AVLT), Boston-Naming-Test, Functional-Activities-Questionnaire, Short-Form-Health-Survey and Geriatric-Depression-Scale.
High resolution T1-weighted (T1w) MR anatomical brain images and the resting state (rs)-fMRI images have been acquired for each subject. The written consent was obtained from each subject prior to MRI measurements.
MRI experiment
All MR experiments were performed at a 3T-MR scanner (Discovery 750W, GE Healthcare, USA) equipped with a 24-channel head coil. A fast-spoiled-gradient-echo based 3D-BRAVO sequence was employed to acquire 1mm3-isotropic T1w MR images. The corresponding scan parameters were of field-of-view (FOV)= 256x256mm2, repetition time (TR)=8.5ms, echo time (TE)=3.2ms, inversion time (TI)=450ms, flip angle (FA)=12degree, number of slices=192, slice thickness=1mm, matrix size=256x256 and bandwidth=31.25kHz.
In rs-fMRI experiment, a multi-phase single-shot echo-planar-imaging sequence was applied for BOLD imaging acquisition. The scan parameters applied were shown as follows: FOV=224X224mm2, TR=2000ms, TE=30ms, FA=90degree, matrix size=64x64, number of slices=33, slice thickness=3.5mm, slice gap=0.7mm and number of phases=240. Total scan time was less than 13 minutes.
Data analysis
All preprocessing was performed using the Data Processing & Analysis for Brain Imaging (DPABI_V4.2, http://rfmri.org/dpabi).
After the preprocessing, the time series of the former 90 brain regions of the Automated Anatomical Labeling (AAL) atlas were extracted. The TV per each brain region was calculated based on the procedures defined previously. 5
All statistical analyses were performed in SPSS software 20.0. Two-sample-t test was applied to detect the difference of TV between SCD, MCl patients and HCs. In addition, Pearson correlation analysis was separately employed to evaluate the relationship between TVs for all subjects and each of clinical scale scores. Significance threshold was set as p < 0.05.
Results
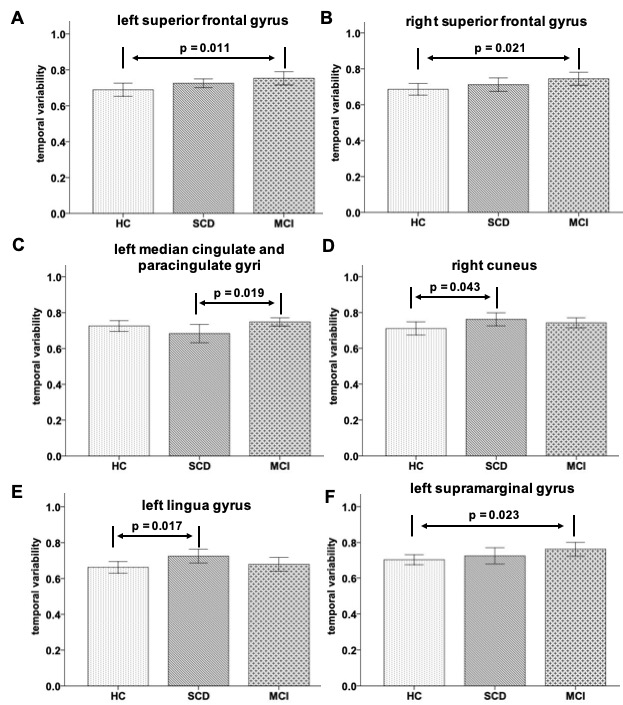
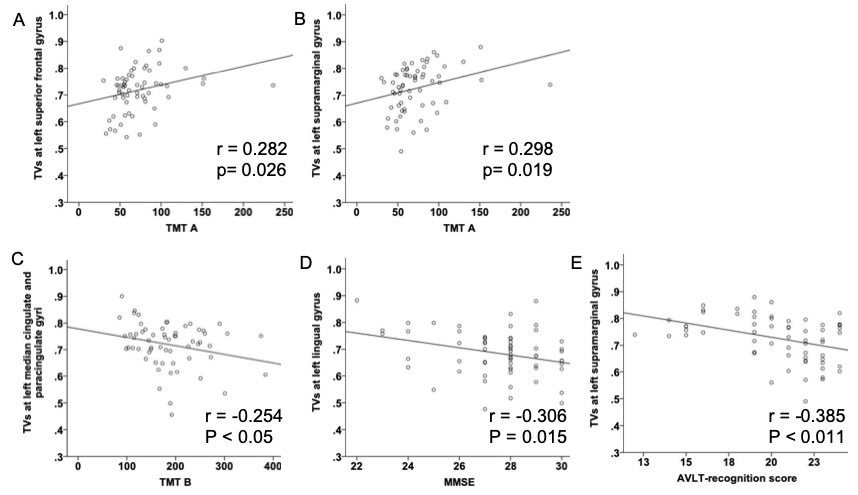
As shown in Figure 1, two-sample-t test revealed that for left superior frontal gyrus region, mean TV in MCI group was significantly larger than that in the HC group (mean: 0.75±0.08 vs 0.69±0.09; p=0.011). Significantly higher TVs were shown in MCI patients than in HCs for right superior frontal gyrus region (mean: 0.74±0.08 vs 0.69±0.08; p=0.021), and for left supramarginal gyrus (mean: 0.76±0.08 vs 0.70±0.07; p=0.023). For right cuneus and left lingua gyrus regions, mean TV showed larger changes in SCD patients than in HCs, respectively (mean: 0.76±0.08 vs 0.71±0.09, 0.73±0.08 vs 0.66±0.08; p=0.043, p=0.017). Additionally, the TV at left median cingulate and paracingulate gyri was significantly lower in patients with SCD than with MCI (mean: 0.68±0.11 vs 0.75±0.05; p=0.019).Using Pearson correlation analysis (Fig.2), for left superior frontal gyrus and left supramarginal gyrus regions, the TVs showed significant positive correlations with TMT A (r=0.282, p=0.026; r=0.298, p=0.019), respectively. Meanwhile, significant negative correlations were found in TVs at left median cingulate and paracingulate gyri with TMT B (r=-0.254; p<0.05), at left lingual gyrus with MMSE (r=-0.306; p=0.015), and at left supramarginal gyrus with AVLT-recognition score (r=-0.385; p<0.001).
Discussion and conclusion
In this study, we systematically investigated the whole brain TV changes for patients with SCD, MCI and HCs. Significantly different TVs have been separately found in the regions of left and right superior frontal gyrus, left median cingulate and paracingulate gyri, right cuneus, left lingual gyrus and left supramarginal gyrus between SCD, MCI patients and HCs. These regions are involved in executive function, episodic memory, visual processing and visual memory and language perception and processing.In addition, the positive correlation between the TV at left superior frontal gyrus and TMT A revealed impaired executive function, and the negative correlation between the TV at supramarginal gyrus and AVLT-recognition score showed a language perception and processing impairment in patients with SCD and MCI.
In conclusion, temporal variability method can be considered an effective tool in the early detection of SCD patients.
Acknowledgements
No acknowledgement found.References
1. Lin Y, Shan PY, Jiang WJ et al. Subjective cognitive decline: preclinical manifestation of Alzheimer's disease. Neurol. Sci. 2019;40:41-9.
2. Lin L, Xing G, Han Y. Advances in Resting State Neuroimaging of Mild Cognitive Impairment. Front Psychiatry. 2018;9:671.
3. Pan P, Zhu L, Yu T et al. Aberrant spontaneous low-frequency brain activity in amnestic mild cognitive impairment: A meta-analysis of resting-state fMRI studies. Ageing Res. Rev. 2017;35:12-21.
4. Jie B, Liu M, Shen D et al. Integration of temporal and spatial properties of dynamic connectivity networks for automatic diagnosis of brain disease. Med Image Anal. 2018;47:81-94.
5. Zhang J, Cheng W, Liu Z et al. Neural, electrophysiological and anatomical basis of brain-network variability and its characteristic changes in mental disorders. Brain. 2016;139:2307-21.
Figures