3919
Abnormal Stationary and Dynamic Functional Connectivity in Multiple System Atrophy1Aerospace Center Hospital, Beijing, China, 2MR Scientific Marketing, Diagnosis Imaging, Siemens Healthcare Ltd, Beijing, China
Synopsis
This study aims to explore whether the differences in static and dynamic functional connectivity (s-FC and d-FC) can serve as potential biomarkers of multiple system atrophy (MSA). 24 MSA patients and 20 normal controls (NCs) were enrolled. We applied both s-FC and d-FC to evaluate functional changes in MSA patients and calculated the graph theory attributes based on s-FC and d-FC. We found that there were significant correlations between indicators of s-FC and d-FC and clinical performance. Furthermore, the receiver operating characteristic (ROC) analysis revealed that the substantially different FC features can serve as predictors to distinguish MSA from NC.
Background and Purpose
Multiple system atrophy (MSA) is a progressive neurodegenerative disorder1. Recent advances in neuroimaging techniques provide the opportunity to study the disconnections (i.e., disruption of functional connectivity) in MSA in vivo. Previous studies mostly assumed that the functional connectivity (FC) was constant during the MRI scanning, and ignored its dynamic nature2,3,4. To fill in the gap, the purpose of this study is to combine the stationary and dynamic FC in the investigation of the changes of functional connectivity in MSA.Material and Methods
The study enrolled 24 MSA patients and 20 age- and gender-matched normal controls (NCs), the average of age for MSA and NCs is 57.56 and 57.61 respectively. MSA patients contained 11 males and 13 females, while NCs contained 8 males and 12 females. The diagnosis of MSA was according to the established international diagnostic criteria of probable MSA defined by the American Academy of Neurology and American Autonomic Society1.All subjects underwent MRI scan on a 3T whole-body MRI scanner (MAGNETOM Verio, Siemens Healthcare, Erlangen, Germany). The resting state fMRI data was acquired in axial orientation using an echo-planar imaging (EPI) sequence with the following parameters: repetition time (TR)/echo time (TE)/flip angle (FA) = 2000 ms/40 ms/90°, field of view (FOV) = 24×24 cm2, image matrix = 64×64, slices = 33, slice thickness = 3 mm, slice gap = 1 mm, bandwidth = 2232 Hz/pixel. The data processing was carried out using an in-house developed tool written in Python and MATLAB. We applied both static and dynamic functional connectivity (s-FC and d-FC) to evaluate functional changes in MSA patients. Graph theory attributes were also calculated based on static and dynamic FC.
During network construction, we adopted a specified brain atlas to define nodes and constructed brain network for each participant. The atlas consists of whole-brain Brodmann areas5 and the cerebellum parcellation from the Automated Anatomical Labeling atlas6. When measuring dynamic functional connectivity (d-FC), we adopted a sliding-window method, with window length = 100 TR (200 s) and step size = 3 TR (6s). We calculated 4 graph theory attributes to reflect the topology of brain networks. The graph theory attributes are all associated with nodes in network. The statistical analysis procedure, including comparison and correlation, was summarized in Figure 1.
Results
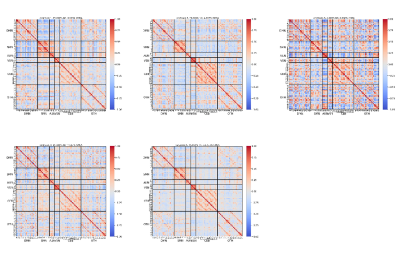
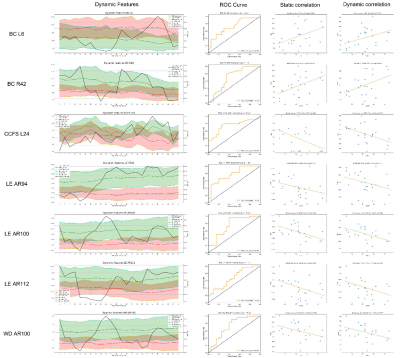
Dynamic functional states The healthy control and patient data were clustered, yielding five cluster centroids as dynamic functional states. The heatmap of these states and the percentage of each group stayed in each state were shown in Figure 2. It can be seen that patients tend to spend less time on states featuring with strong connectivity (State 2 and 4), while staying longer at less connected states (State 5). Also, the most strongly connected state was rare to both patients and healthy controls (State 3). The connection within cerebellum was stronger in State 2 than State 5, but patients distribute mainly in the latter state.Graph attributes For patients, the clustering coefficient (CCFS), local efficiency (LE) and weighted degree (WD) were lower than healthy controls in the identified areas and showed mostly negative correlation, while BC had mixed results and positive correlation respectively. The same statistical analysis was performed on dynamic graph attributes as well and similar results were found. The stability of dynamic graph attributes was also examined. LE and WD of patients were more stable compared with healthy controls, whereas CCFS of patients was less stable and BC stability was mixed. For each of the significant regions, we plotted graph attributes and area under the ROC curve (AUC ROC) as time slice varies. The ROC curve where AUC reaches its maximum was also visualized. Besides, the correlation of the static and dynamic features related to this region and graph attributes was generated (Figure 3).
Discussion and Conclusion
We applied both s-FC and d-FC to evaluate functional changes in MSA patients. Graph theory attributes were also calculated based on s-FC and d-FC. Results showed that MSA patients differ from NCs in the s-FC and d-FC at the whole-brain level. Moreover, from clinical perspective, we found that there were significant correlations between indicators of s-FC and d-FC and clinical performance. Combined with the above findings and the ROC analysis results, we suggest that the substantially different FC features can serve as predictors to distinguish MSA from NC.Acknowledgements
This work was supported by the Beijing natural scientific foundation of China (No.7182105) and the National natural scientific foundation of China (Grant No. 81571648).References
1. Gilman S, Wenning GK, Low PA, et al. Second consensus statement on the diagnosis of multiple system atrophy. Neurology. 2008; 71(9): 670.
2. Hutchison RM, Womelsdorf T, Allen EA, et al. Dynamic functional connectivity: Promise, issues, and interpretations. NeuroImage. 2013; 80: 360-378.
3. Mueller S, Wang D, Michael D, et al. Individual Variability in Functional Connectivity Architecture of the Human Brain. Neuron. 2013; 77(3): 586-595.
4. Allen EA, Damaraju E, Plis SM, et al. Tracking Whole-Brain Connectivity Dynamics in the Resting State. Cerebral Cortex. 2014; 24(3): 663-676.
5. Brodmann K. Vergleichende Lokalisationslehre der Grosshirnrinde in ihren Prinzipien dargestellt auf Grund des Zellenbaues. Leipzig: Barth. 1909.
6. Tzourio-Mazoyer N, Landeau B, Papathanassiou D, et al. Automated Anatomical Labeling of Activations in SPM Using a Macroscopic Anatomical Parcellation of the MNI MRI Single-Subject Brain. NeuroImage. 2002; 15(1): 273-289.
Figures


