3913
A cortical-depth-dependent analysis of fingertip maps in human somatosensory cortex measured at ultra-high field (7T).1School of Psychology, University of Queensland, St Lucia, Australia, 2Centre for Advanced Imaging, University of Queensland, St Lucia, Australia
Synopsis
While cortical-depth-dependent fMRI studies are becoming increasingly common, these studies often focus on comparing average responses at different depths. Here we aimed, instead, to explore the integrity of a spatial response pattern across depth. For this, we analysed sub-millimeter fingertip mapping data from human somatosensory cortex. Data were acquired using fMRI at 7T and was comprised of two sets of somatotopic maps (bottom-up or top-down driven). Both sets of somatotopic maps were found to vary across depth and were marked by a banded pattern at superficial layers; however, this pattern dissipated in deeper layers – being dominated by noise.
INTRODUCTION:
Ultra-high field (7T) permits high-resolution fMRI, which is particularly useful for resolving fine details tangential to the surface as well as differences across cortical depth. Whereas most cortical-depth-dependent (or layer) fMRI studies focus on measuring the degree of activation at different depths by averaging all the responses at each depth, there has been far less work assessing the consistency of the spatial distribution of responses across depth. To address this, we performed a depth-dependent analysis of bottom-up and top-down driven somatotopic digit maps in human primary somatosensory cortex, S1. Whereas a clear, fingertip-specific banded pattern was seen in superficial layers, the pattern became less apparent when progressing towards deep layers.METHODS:
Two types of somatotopic fingertip maps were obtained, driven primarily by (1) bottom-up or (2) top-down processes. The bottom-up maps were generated via a sensory condition in which phase-encoded vibrotactile stimulation1 was delivered across the 4 fingertips (index, middle, ring and little). The top-down maps were generated via an attention condition using the Attentional Drift Design2. For this, attention was swept across the fingertips with the same timing as in the sensory condition, while all four fingertips were under constant sensory stimulation.Data were acquired on a Siemans Magnetom 7T scanner with a 32-channel head coil (NOVA Medical) for 6 healthy participants (age: M=27years). An MP2RAGE sequence was used to collect whole-brain anatomical images (0.5mm isotropic) with the following timing parameters: TI1/TI2/TR/TE=840/2370/4300/2.88ms. Functional data were collected using a 3D-EPI sequence3 (TR/TE=82/30ms, 0.8mm isotropic) positioned to cover S1 in the left hemisphere (contralateral to stimulated/attended fingers).
Anatomical datasets were segmented to construct the boundary surfaces (pial and white matter), which were then used with an equivolumetric layering approach4 to define 11 cortical depth surfaces. Functional data were upsampled (by a factor of 4) and interpolated onto each of the surfaces. Intracortical (within layer) smoothing was then performed to smooth the data at each depth to a target FWHM of 1.2mm tangential to the surface. A response delay analysis was then performed for both experimental conditions. This analysis yields the correlation coefficient (CC) and response delay at which the correlation between the empirical time-course and the reference waveform is maximum (which can be used to estimate the preferred fingertip for every active vertex in S1). An ROI was defined on the surface model, enclosing the fingertip representations along the post-central gyrus. A mask was then generated to include vertices which were significantly active (p<0.05) across any layers, for either task.
RESULTS:
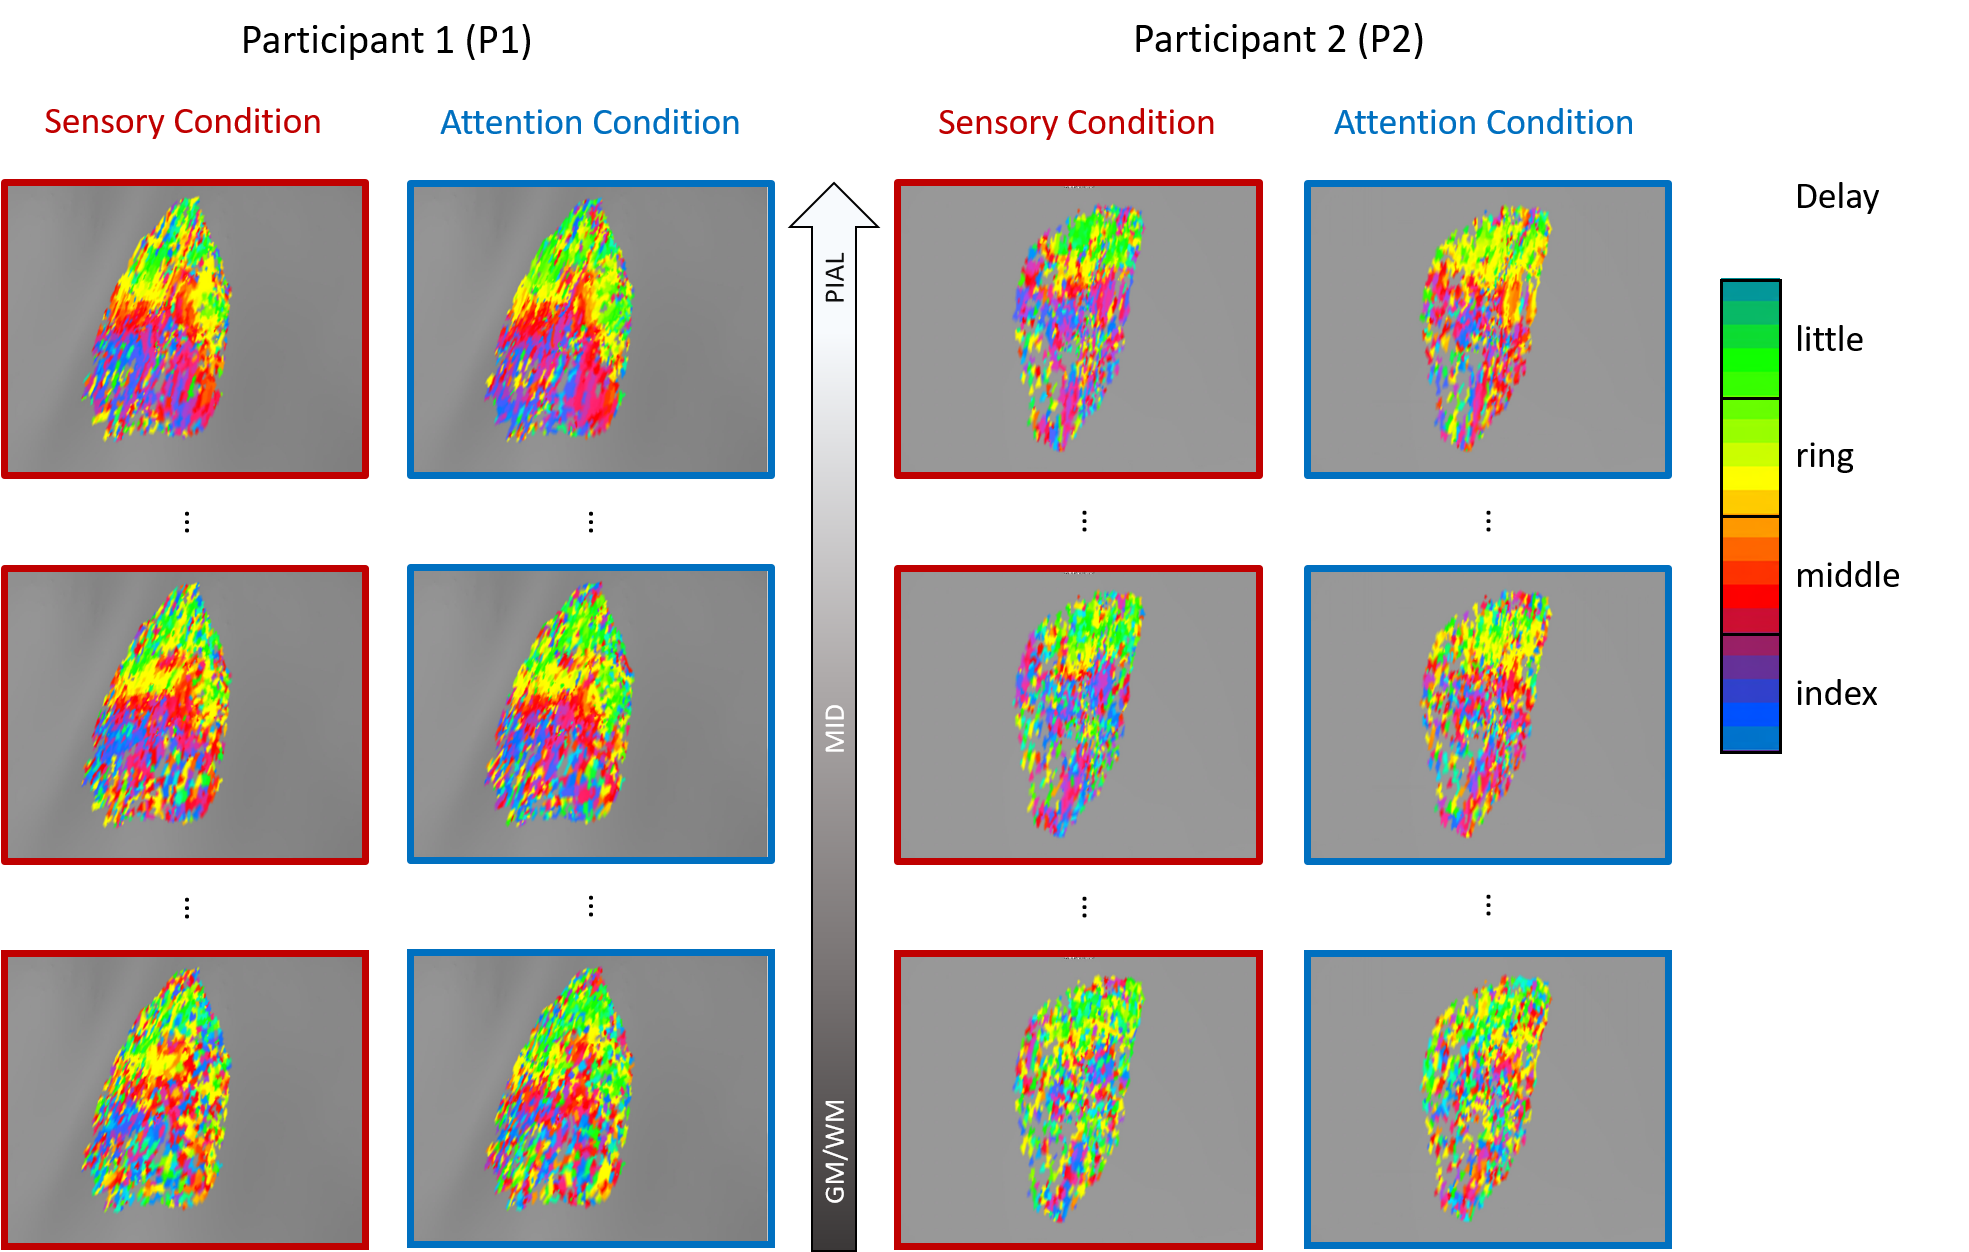
Results for 2 participants are shown in Figure 1. A clear banded pattern is visible at the most superficial depth for both participants, with each band representing a different fingertip. As we progress through the layers, at a mid-grey depth the banded pattern is still observed although interspersed more noise than superficial layers. Note the difference in data quality between the two participants. That is, the pattern is more easily observed for P1 than P2. As we approach the white matter boundary, the fingertip maps become even less clear. The deep maps are nearly devoid of the banded structure present more superficially for P2 – with only slightly more structure is visible for P1.The degree of cortical magnification varies according to digit5 such that the thumb and index finger have a larger cortical representation, translating to more vertices, than the other digits. Given the unequal distribution of vertices per finger, we would expect a non-uniform distribution across the delay values, with more vertices preferring the index finger. We see this pattern of non-uniformity at the pial layer for both P1 and P2 over both experimental conditions (see Figure 2). However, as one progresses to deeper depths, the distributions tend to flatten out. This can be most clearly seen in the P2 attention condition histogram in which the distribution is nearly uniform at the grey/white matter boundary.
When analysing phase-encoded data it is common to threshold BOLD responses based on the degree of correlation between the observed and the reference time-series (CC). Conventionally, in order to produce low-noise coherence maps, this threshold it set near a level of p<0.05, which translates to a CC of ~0.3. However, when analyzing sub-millimeter data, our data reveals that if this thresholding were performed without consideration of cortical depth, the data would be biased toward more superficial laminas. This is most easily observed on P2 where a threshold of 0.3 would eliminate consideration of activation in depths from mid-grey to white matter.
DISCUSSION:
Our findings in S1 are in line with previous work in visual cortex examining how gradient echo EPI responses vary across depth (strongest and most spatially spread responses are found most superficially)6. While superficial depths display the strongest BOLD signal, this signal is also the most blurred due to the surface veins. Individual digit bands are still visible in the mid-layer delay maps, thus, when mapping fingertips representations it may be beneficial to use mid-depth responses to achieve more spatially concise single digit representations. In the deepest layers, however, it becomes nearly impossible to identify individual fingertips with the uniform distribution of vertices suggesting that the deepest layers are marked mostly by noise.Acknowledgements
We thank Aiman Al-Najjar, Nicole Atcheson, and Steffen Bollmann for help with data collection, and the authors acknowledge the facilities of the National Imaging Facility (NIF) at the Centre for Advanced Imaging, University of Queensland. This work was supported by the National Health and Medical Research Council (APP 1088419). M.B. acknowledges funding from Australian Research Council Future Fellowship grant FT140100865, S.B. and A.Y. acknowledge support through the Australian Government Research Training Program Scholarship, and A.M.P. acknowledges funding from the Australian Research Council (DE180100433).References
1 Puckett A M, et al. Measuring the effects of attention to individual fingertips in somatosensory cortex using ultra-high field (7T) fMRI. Neuroimage (2017)
2 A.M. Puckett, E.A. DeYoe. The attentional field revealed by single-voxel modeling of fMRI time courses J. Neurosci., 35 (2015), pp. 5030-5042
3 Poser, B. A., et al. CAIPIRINHA-accelerated 3D EPI for temporal and/or spatial resolution EPI acquisitions. Proc. Of the ISMRM (2014).
4 Wagstyl, K., Paquola, C., Bethlehem, R., Evans, A.C. & Huth, A. Equivolumetric Layering for Mesh Surfaces. (2018). doi:10.5281/zenodo.1442584
5 Sutherling, W.W., Levesque, M.F., Baumgartner, C. Cortical sensory representation of the human hand: size of finger regions and nonoverlapping digit somatotopy. Neurology 42, 1020-1028. (1992).
6 Polimeni, J.R., Fischl, B., Greve, D.N., Wald, L.L. Laminar analysis of 7 T BOLD using an imposed spatial activation pattern in human V1. NeuroImage 52, 1334–1346. (2010).
Figures