3912
Modeling human primary somatosensory cortex using population Receptive Fields.
Wouter Schellekens1, Martijn Thio1, Nick Ramsey2, and Natalia Petridou1
1Radiology, UMC Utrecht, Utrecht, Netherlands, 2Neurosurgery, UMC Utrecht, Utrecht, Netherlands
1Radiology, UMC Utrecht, Utrecht, Netherlands, 2Neurosurgery, UMC Utrecht, Utrecht, Netherlands
Synopsis
In the current study, we apply population Receptive Field modeling to somatosensory vibrotactile stimulation, using 7 Tesla functional MRI. We find somatotopic structures within primary somatosensory cortical areas BA3, BA1, and BA2. Furthermore, the receptive field sizes describe tactile information integration and allows for the direct assessment of processing hierarchy within primary somatosensory cortex. This finding is further supported by the estimated HRFs, showing that the BOLD response is quickest to emerge in BA3 which is known to receive primary input from the thalamus.
Introduction
A goal in sensory neuroscience is to predict neuronal responses to sensory input. Population Receptive Field (pRF) modeling has been an important step forwards, describing the relation of various sensory inputs with respect to neuronal responses using simple (Gaussian) functions. In the current study, we investigate whether the pRF modeling approach can also be applied to neuronal responses caused by vibrotactile stimulation of the fingertips in humans as measured with functional MRI at 7 Tesla. Receptive field modeling allows for the assessment of a somatotopic organization within primary somatosensory cortex (S1) on the basis of receptive field centers, as well as a categorization of receptive field size differences between sub regions within S1 and differences in tactile stimulus input. We expect to find somatotopic structures throughout S1 (Brodmann areas: BA1, BA2, BA3). Furthermore, the receptive field centers are hypothesized to describe the level of signal integration, which is expected to increase when moving up the cortical hierarchy.Methods
Seven healthy volunteers received vibrotactile stimulation on the fingertips (frequencies: 30-190Hz). Fingertips were intermittently stimulated (i.e. 200ms on, 100ms off) for a period of 4 seconds. The order of fingertip stimulation was pseudo-randomized and each digit was stimulated 8 times per frequency. We modeled the BOLD responses according to a Gaussian receptive field (RF) model, resulting in a preferred fingertip (i.e. Gaussian center) and RF size (i.e. Gaussian standard deviation) per voxel. We checked for the presence of an ordered somatotopy (i.e. spatial alignment of preferred fingertips) and RF properties within 3 pre-selected ROIs: Brodmann area BA3b, BA1, and BA2, which together comprise primary somatosensory cortex. Receptive field properties were also investigated per center value and stimulation frequency. Finally, we performed an hemodynamic response function (HRF) estimation (32x all digits simultaneously for 0.5s) to investigate differences in processing hierarchy between the selected Brodmann areas.Results
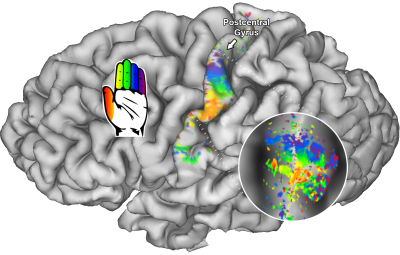
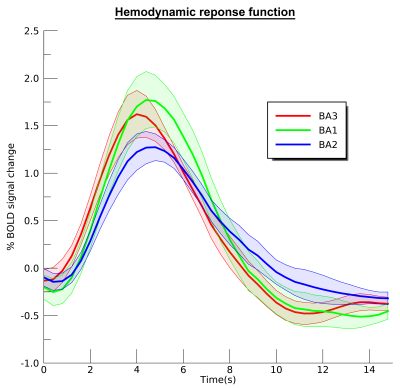
We found neatly ordered somatotopic structures of finger digits throughout S1 (BA3: t(6)=18.07; p<.001; BA1: t(6)=17.83; p<.001, and BA2: t(6)=4.53; p=.002 ) (figure 1). We additionally found that RF sizes differed per Brodmann area (t(6)=16.86; p<.001), showing smallest RF size for BA3 and largest RF size for BA2 (figure 2). RF size also changed per center finger digit (t(6)=3.68; p=.005) and per applied frequency (t(6)=2.84; p=.015). These results show that the thumb representation displays smallest RF sizes of the 5 finger digits, just as the lowest frequency (30Hz) also displays lower RF sizes than the selected higher frequencies. Finally, we the HRF experiment resulted in estimated HRFs that were approximately 0.5s faster in BA3 than in BA2 (figure 3).Discussion
Using pRF modeling, we found ordered somatotopic organizations in primary somatosensory cortical areas BA3, BA1 and BA2. Furthermore, fingertip representations of the thumb and index finger showed smallest RF sizes, indicating high-precision processing of somatosensory input coming from these digits. Plausibly, the reported differences in RF size for frequency are also caused by required specificity. The RF differences between cortical areas clearly expose different processing stages. It is known that BA3 receives the primary input from the thalamus, and is therefore expected to display the highest level of detail (smallest RF sizes), whereas tactile information is believed to be integrated within further cortical areas (larger RF sizes). These findings are supported by the HRF experiment that showed BA3 quickest to rise, while BA2 displayed the slowest and widest curve.Conclusion
In the current study, we show that pRF modeling can be applied to somatosensory cortex following vibrotactile stimulation in humans measured at 7 Tesla fMRI. We were able to detect the somatotopic organization in S1 and also describe different stages of information integration and subsequently the inherent cortical hierarchy.Acknowledgements
This work was supported by a grant from the National Institute of Health under Award Number RO1MH111417.References
No reference found.Figures

Receptive field centers individual subject at 110Hz are displayed on a pial and flattened surface (circle).

Mean receptive field sizes for the selected Brodmann areas (A), center finger representation (B), and applied stimulation frequency (C).

Estimated hemodynamic response functions for the selected Brodmann areas.