3911
Towards accurate quantification of cerebrovascular reactivity using real-time phase-contrast MRI1Johns Hopkins University School of Medicine, Baltimore, MD, United States
Synopsis
Cerebrovascular reactivity (CVR) is typically measured from changes in cerebral perfusion responsive to a hypercapnic gas challenge. Recently, a real-time PC MRI technique using highly undersampled radial FLASH acquisitions with regularized nonlinear inversion reconstruction has been developed and showed great promise in quantifying CBF-based CVR during resting-state without hypercapnic gas challenge. However, quantification of CVR using this method requires optimization. In the present work, using the regular PC MRI as the gold standard, we compared four different analysis methods of the real-time PC MRI results, in order to identify the optimal approach for accurate CVR quantification using real-time PC MRI.
INTRODUCTION
Cerebrovascular reactivity (CVR), a specific measure of the cerebral blood vessels’ dilatory function, is an important marker of brain’s vascular health. CVR is typically measured from changes in cerebral blood flow (CBF) responsive to a hypercapnic gas challenge1, which requires breathing apparatus and substantial subject cooperation, Recent studies have showed the promise of utilizing spontaneous fluctuations in breathing patterns during resting-state BOLD scans to measure CVR without gas inhalation2-4. Although CBF-based CVR measurements is thought to be more accurate than BOLD-based measurement, standard CBF techniques, including arterial spin labeling (ASL)5 and phase-contrast (PC) MRI6, are too slow (~10s per image) to capture the dynamic CBF changes during spontaneous breathing for resting-state CVR quantification. Recently, a real-time PC MRI technique using highly undersampled radial FLASH acquisitions with regularized nonlinear inversion reconstruction has been developed to achieve fast CBF measure7. Our previous study has demonstrated the proof-of-principle of using this technique to measure CBF-based CVR during resting-state8. However, due to the blurry nature of the undersampled images, quantification of CBF and CVR using this method requires further optimization. In the present work, using the regular PC MRI results as the gold standard, we compared four different analysis methods of the real-time PC MRI results. Our goal is to identify the optimal approach for accurate CVR quantification using real-time PC MRI.METHODS
CVR scans: Eight healthy subjects (age 22.0±3.6 yr) were scanned on a Siemens 3T Prisma scanner. Each subject had a real-time PC and a regular PC MRI scans. In both scans the subject breathed room air for 1min, and then hypercapnia (5% CO2) air for 2min. End-tidal CO2 (EtCO2) was recorded throughout the scans. Imaging parameters were: 200x200x5mm3 field-of-view; 0.39x0.39x5mm3 spatial resolution; encoding velocity (Venc) was 90cm/s for real-time PC, and was 60cm/s and 90cm/s for room air and hypercapnia (5% CO2), respectively, for regular PC; imaging slice positioned at 10mm above the sinus confluence to target CBF in the superior sagittal sinus (SSS). The real-time PC obtained dynamic CBF maps at 59.3ms temporal resolution. The regular PC was performed with 5 averages and 1min/scan.Data analysis: The real-time PC MRI yielded two types of images, the complex average and phase maps. A magnitude image was first calculated for each dynamic, given by Mag=2*complex_average*sin(phase/2π). Next, four automatic methods were adopted to define the SSS ROI automatically. Method 1: for each dynamic, any connected voxels with a magnitude intensity higher than a threshold (N times of the noise level, where N=3, 4 and 5 were tested) within the SSS area were included in the ROI. Method 2: the threshold was set as X% of the mean magnitude of top Y voxels within the SSS area, where X=20,30,…,80%, and Y=20,30,40 and 50, respectively. Method 3: top K number of voxels within the SSS area, where K was determined from the regular PC scan. Method 4: a large ROI was drawn manually around the SSS in the mean magnitude image, and applied to each dynamic. Once the ROIs were determined, the velocities of ROI voxels were integrated to yield CBF in the units of ml/min for each time point. CVR was then calculated using a general linear model in which CBF time course was the dependent variable and EtCO2 time course was the independent variable. CBF and CVR of the regular PC MRI were obtained following standard analysis1,6.
RESULTS
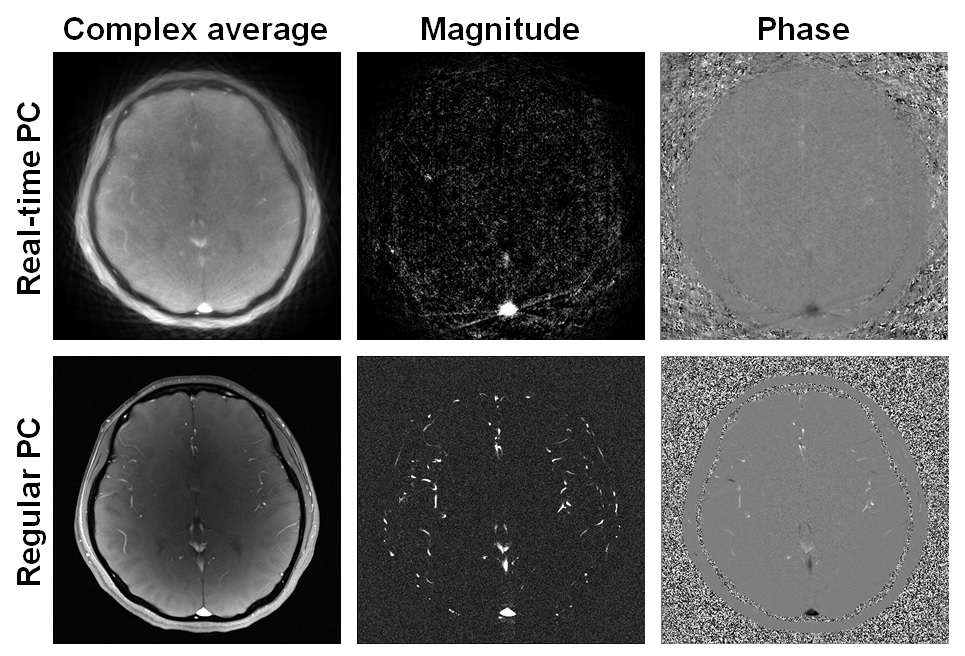
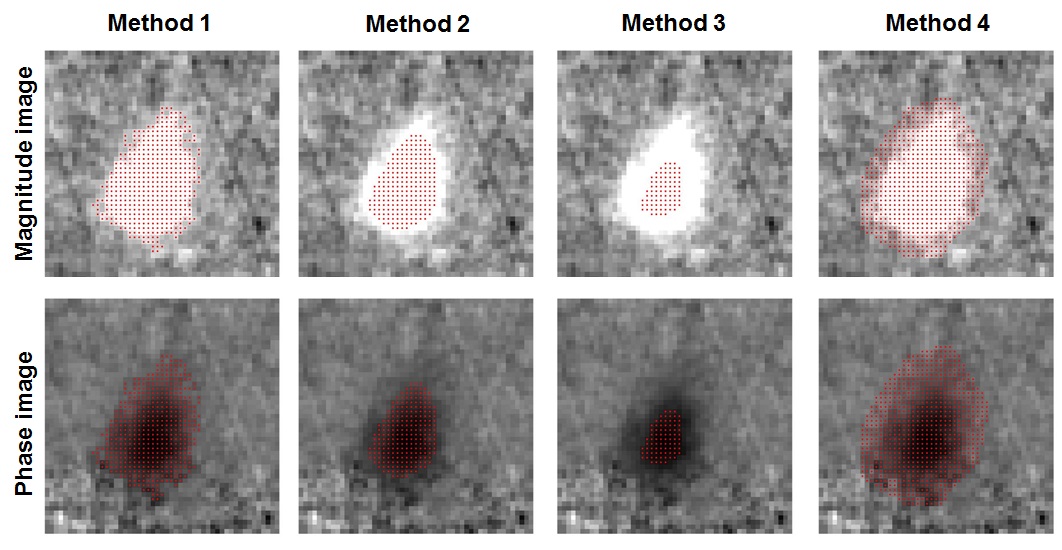
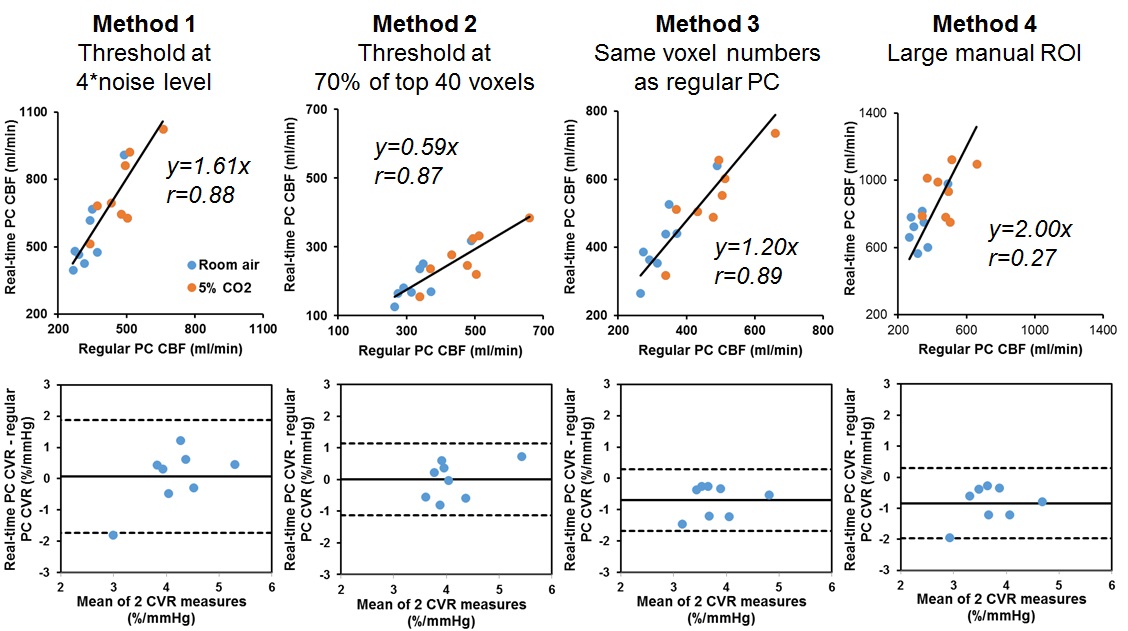
Figure 1 shows typical real-time and regular PC images from a subject. Compared to the regular PC, the real-time PC images were not as well-resolved and showed some streaking artifacts due to the under-sampling, which may add noise to CBF quantification. Figure 2 shows the example ROI obtained from each analysis method, displayed on both the magnitude and velocity images.Figure 3 compares the CBF and CVR results obtained using real-time PC and regular PC scans. Although there were significant correlation (p<0.001) between the CBF values from the two PC scans for Method 1, 2 and 3, Methods 1 largely overestimated CBF, while Methods 2 largely underestimated CBF, given the specific threshold criteria. However, for both Methods 1 and 2, although CBF values were biased using real-time PC, the resulted CVR, which measures the relative changes in CBF, was found to be consistent with those measured by the regular PC, with Method 2 showed better precision.
Compared across the different thresholds in Method 2, 70% of the mean magnitude intensity of top 40 voxels yielded the most accurate CVR quantification (Figure 3), whereas 30% of the mean magnitude intensity of top 30 voxels yields the most accurate CBF quantification (y=1.06x, r=0.95).
DISCUSSION
The real-time PC MRI provides CBF measurements with high temporary resolution, which can be used to capture CBF time course for CVR assessment. However, the spatial smoothing and artifacts in the real-time images may largely affect CBF quantification. Our results suggest that accurate and precise CVR quantification can be obtained with careful selection of ROIs. For the imaging parameters used, 70% of the magnitude signal intensity of top 40 voxels in SSS area is the optimal threshold for CVR analysis. However, if CBF quantification is the goal, different ROI selection criteria should be used.Acknowledgements
No acknowledgement found.References
1. Liu P, De Vis JB, Lu H. Cerebrovascular reactivity (CVR) MRI with CO2 challenge: A technical review. Neuroimage. 2019;187:104-115.
2. Golestani AM, Chang C, Kwinta JB, Khatamian YB, Chen JJ. Mapping the end-tidal CO2 response function in the resting-state BOLD fMRI signal: spatial specificity, test-retest reliability and effect of fMRI sampling rate. Neuroimage. 2015;104: 266-277.
3. Jahanian H, Christen T, Moseley ME, Pajewski NM, Wright CB, Tamura MK, Zaharchuk G, Group, S.S.R. Measuring vascular reactivity with resting-state blood oxygenation level-dependent (BOLD) signal fluctuations: A potential alternative to the breath-holding challenge? J Cereb Blood Flow Metab. 2017;37:2526-2538.
4. Liu P, Li Y, Pinho M, Park DC, Welch BG, Lu H. Cerebrovascular reactivity mapping without gas challenges. Neuroimage. 2017;146:320-326.
5. Gauthier CJ, Madjar C, Desjardins-Crépeau L, Bellec P, Bherer L, Hoge RD. Age dependence of hemodynamic response characteristics in human functional magnetic resonance imaging. Neurobiol Aging. 2013;34(5):1469-85.
6. Xu F, Uh J, Brier MR, Hart J Jr, Yezhuvath US, Gu H, Yang Y, Lu H. The influence of carbon dioxide on brain activity and metabolism in conscious humans. Cereb Cortex. 2011;21(6):1426-34.
7. Untenberger M, Tan Z, Voit D, Joseph AA, Roeloffs V, Merboldt KD, Schaetz S, Frahm J. Advances in real-time phase-contrast flow MRI using asymmetric radial gradient echoes. Magn Reson Med. 2016;75(5):1901-8.
8. Zhu J, Jiang D, Schär M, Voit D, Frahm, J, Bottomley P, Lu H, Liu P. Measuring cerebrovascular reactivity without gas challenge: a real-time phase-contrast MRI approach. ISMRM 2019, p2929.
Figures