3910
Application of machine learning multivariate pattern analysis for type 2 diabetes: A resting-state fMRI study1Shanghai General Hospital, Shanghai Jiaotong University School of Medicine, Shanghai, China, 2Philips Healthcare, Shanghai, China
Synopsis
Type 2 diabetes (T2DM) mellitus can increase risk of cognition impairment and dementia. Recently, machine learning, espicailly support vector machine, were introduced to functional MRI studies in individual classification of diseases. In current study, we used support vector machine to perform individual classification of T2DM and healthy controls (HC) using ALFF features based on rs-fMRI data. The selected features were determined to be key features for classification between groups using recursive feature elimination and may be associated with abnormalities of the spontaneous brain activity
Introduction
Type 2 diabetes mellitus(T2DM) is a metabolic disease and estimated to affect 450 million adults around the world[1]. T2DM can increase risk of cognition impairment and dementia[2]. Several studies confirmed that T2DM patients exhibited altered spontaneous brain activity in multiple brain regions. Recently, SVM methods have attracted increasing attention and have been shown to be a successful approach for the analysis of rs-fMRI data to assist in identifying conditions and determining neuroimage biomarker[3]. In current study, an SVM classifier was trained to distinguish T2DM patients from healthy controls (HC) by using the ALFF values, and important features contributing to the classification were identified.Materials and methods
A total of 69 T2DM patients as well as 54 age- and sex-matched HCs were recruited from clinics and hospitals after providing written informed consent, which was approved by the Shanghai General Hospital Ethics Committee. Resting-state fMRI data of all the subjects were obtained with a 3T MR scanner (Ingenia, Philips Healthcare, Best, Netherlands). Rs-fMRI data were preprocessed by using the DPARSF toobox (http://www.restfmri.net/forum/DPARSF). The Amplitude of Low-Frequency Fluctuations (ALFF) were calculated based on preprocessed fMRI data. The mean ALFF values of 116 brain regions were extracted based on AAL template and were used as features to classify groups. The 5-fold cross validation was applied to generate classification model due to limited sample size. we employed recursive feature elimination (RFE) to select features, and the surviving features were considered key brain regions in the classification process. We used support vector machine (SVM) with linear kernel as the classifier. SVM was an effective and robust classifier to build the model. The linear kernel function were used in this study and it was easier to explain the coefficients of the features for the final model. The model performance was assessed using ROC analysis (receiver operating characteristic). The area under the ROC curve (AUC), accuracy, sensitivity, specificity were also reported in current study. All above processes were implemented with FeAture Explorer (FAE, v0.2.1, https://github.com/salan668/FAE) on Python (3.5.4, https://www.python.org/).Results
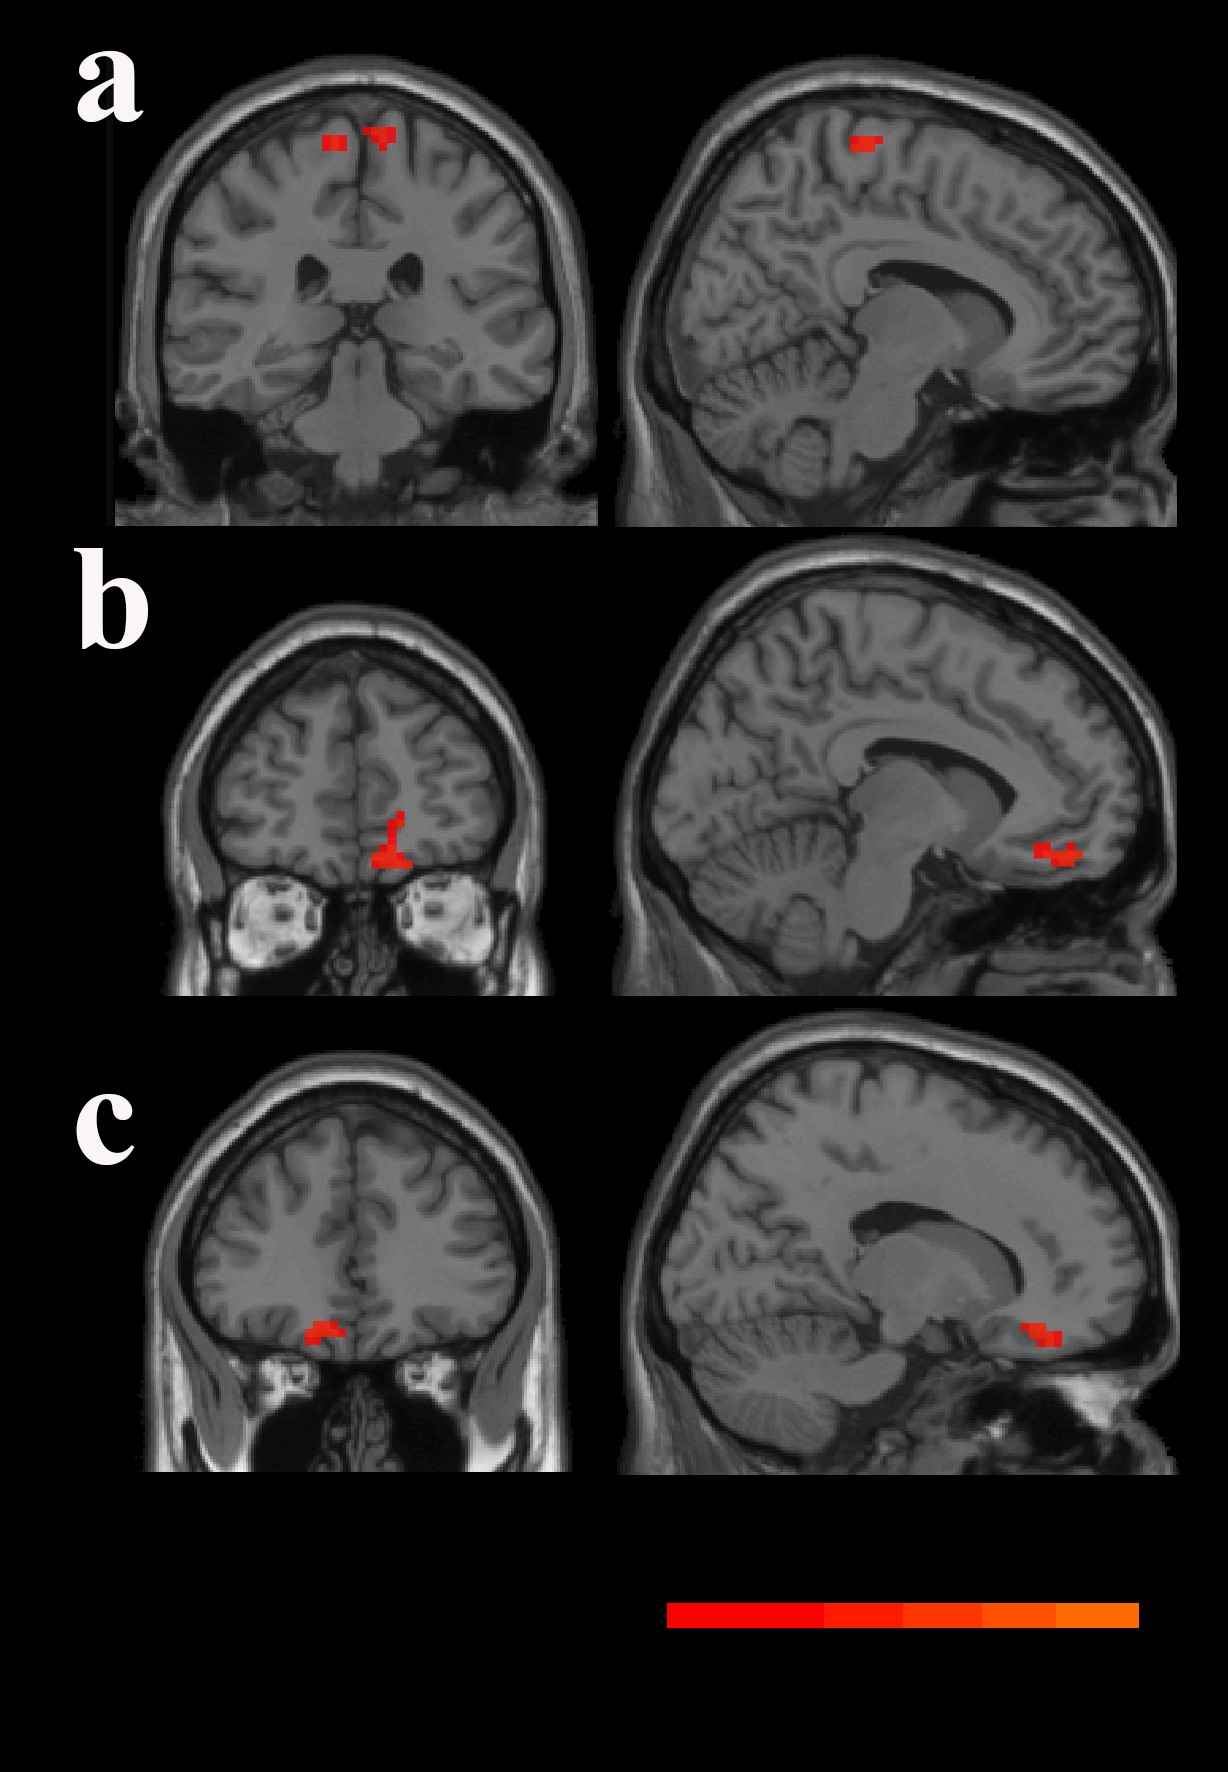
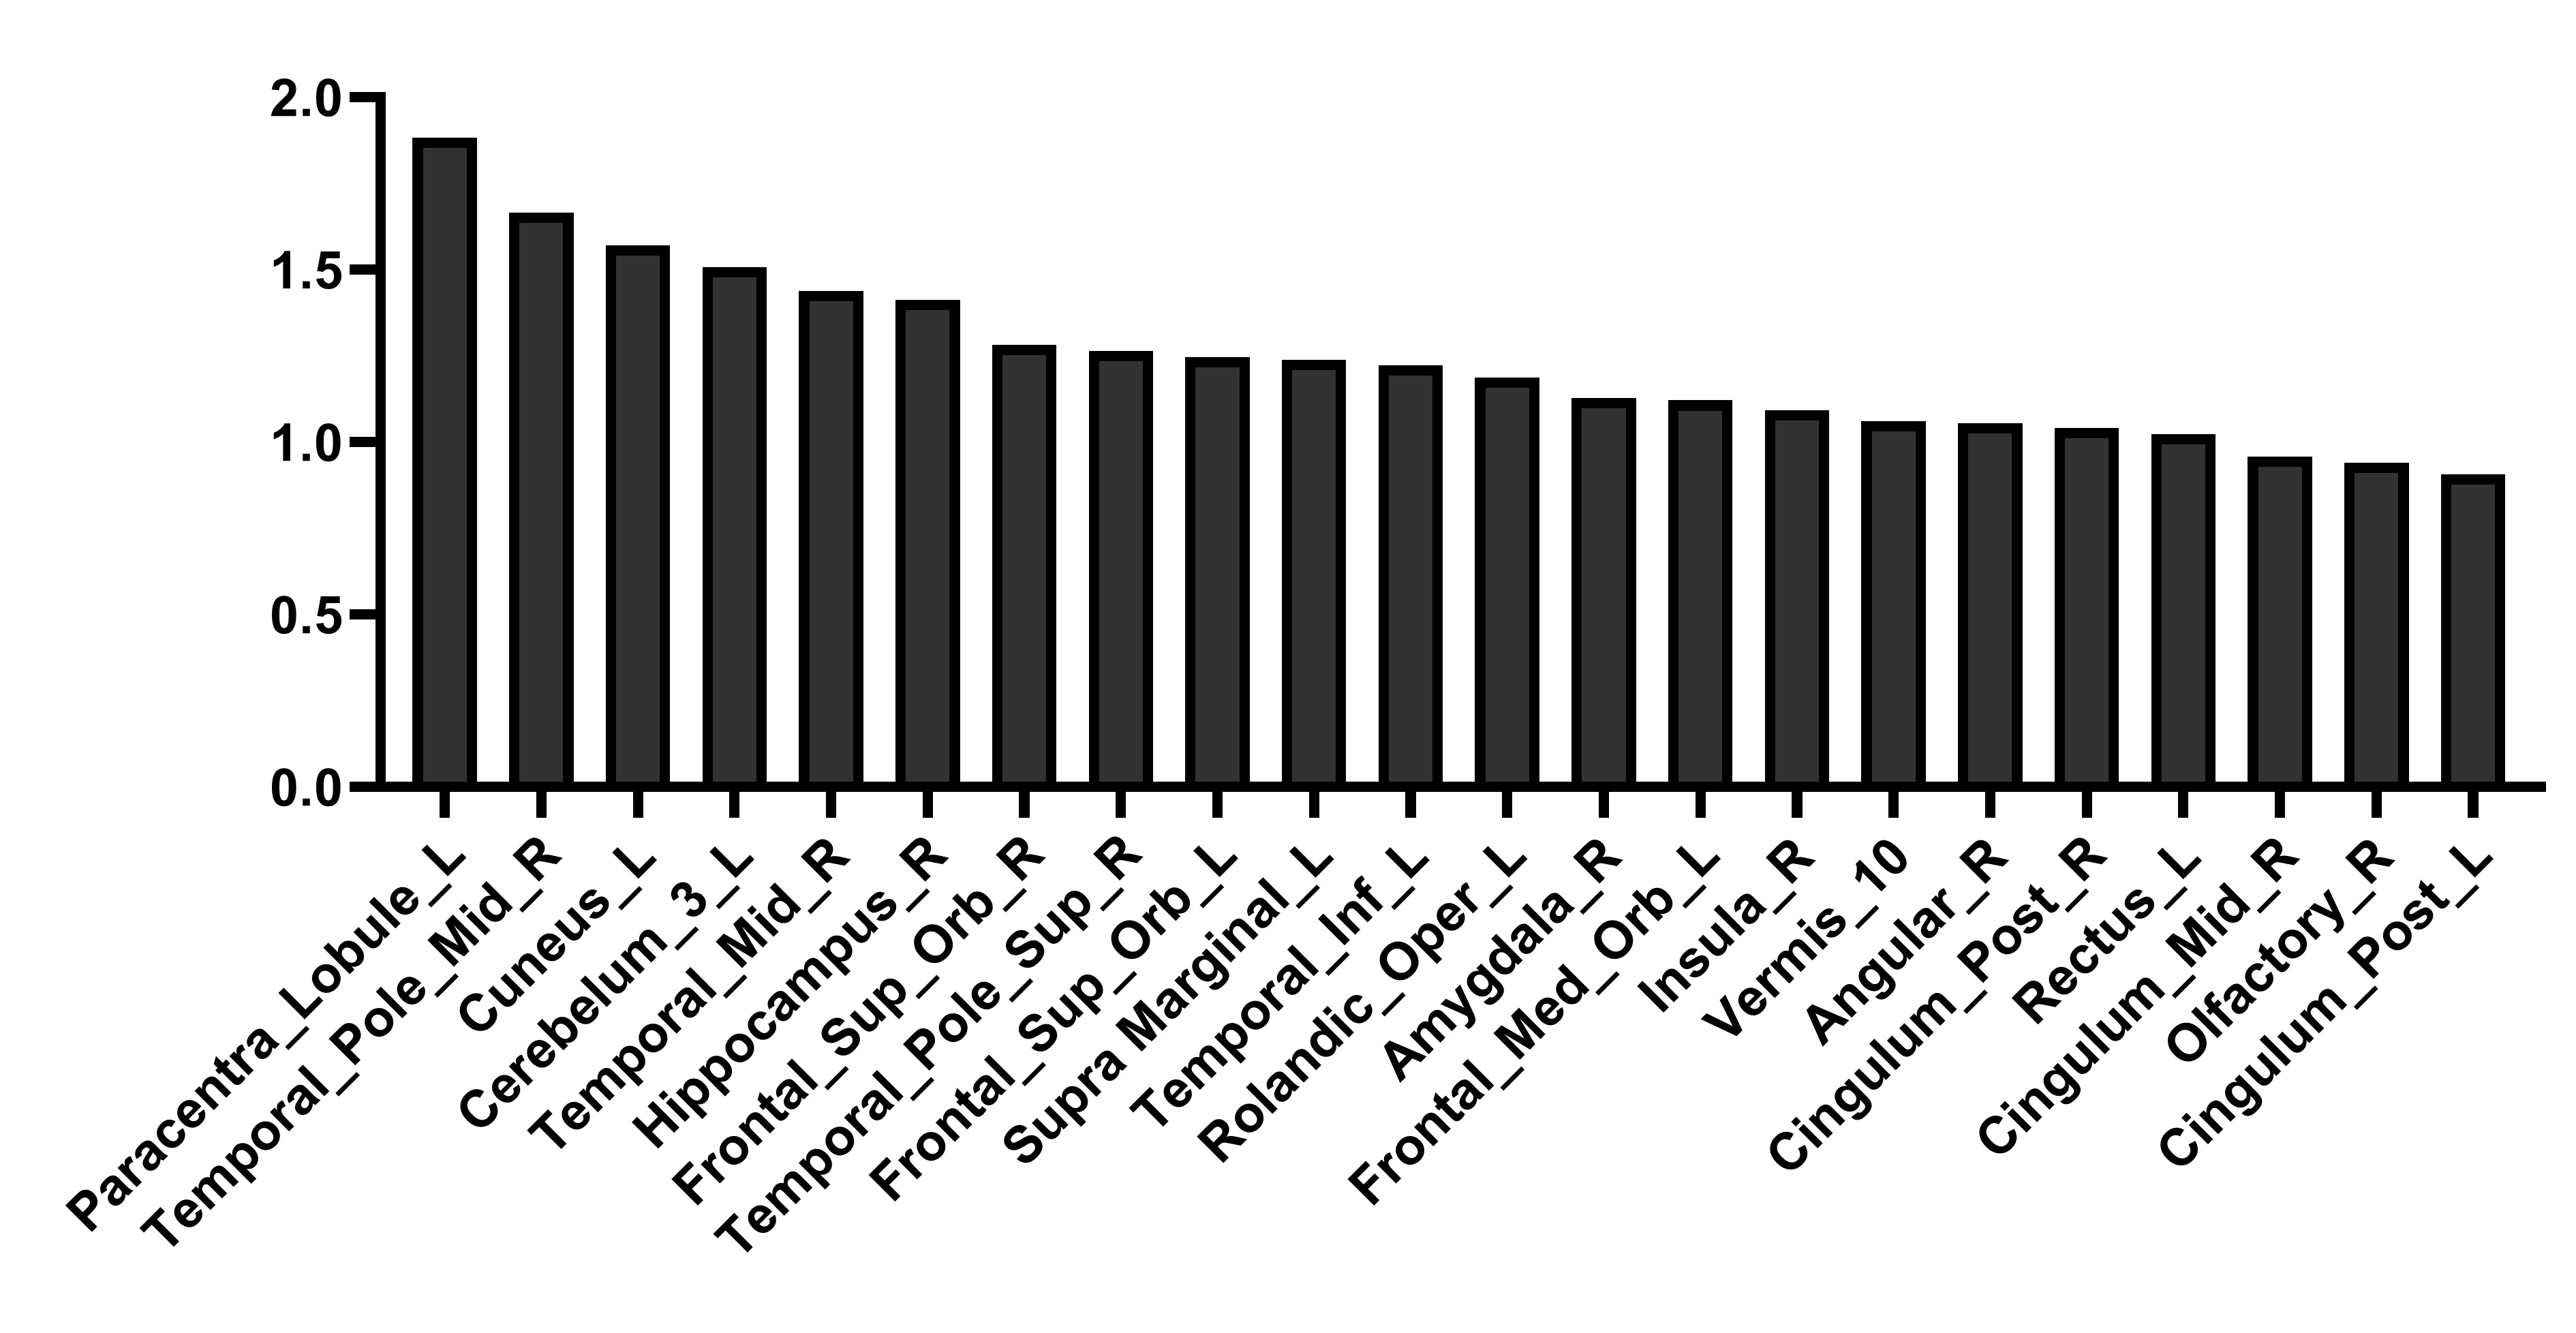
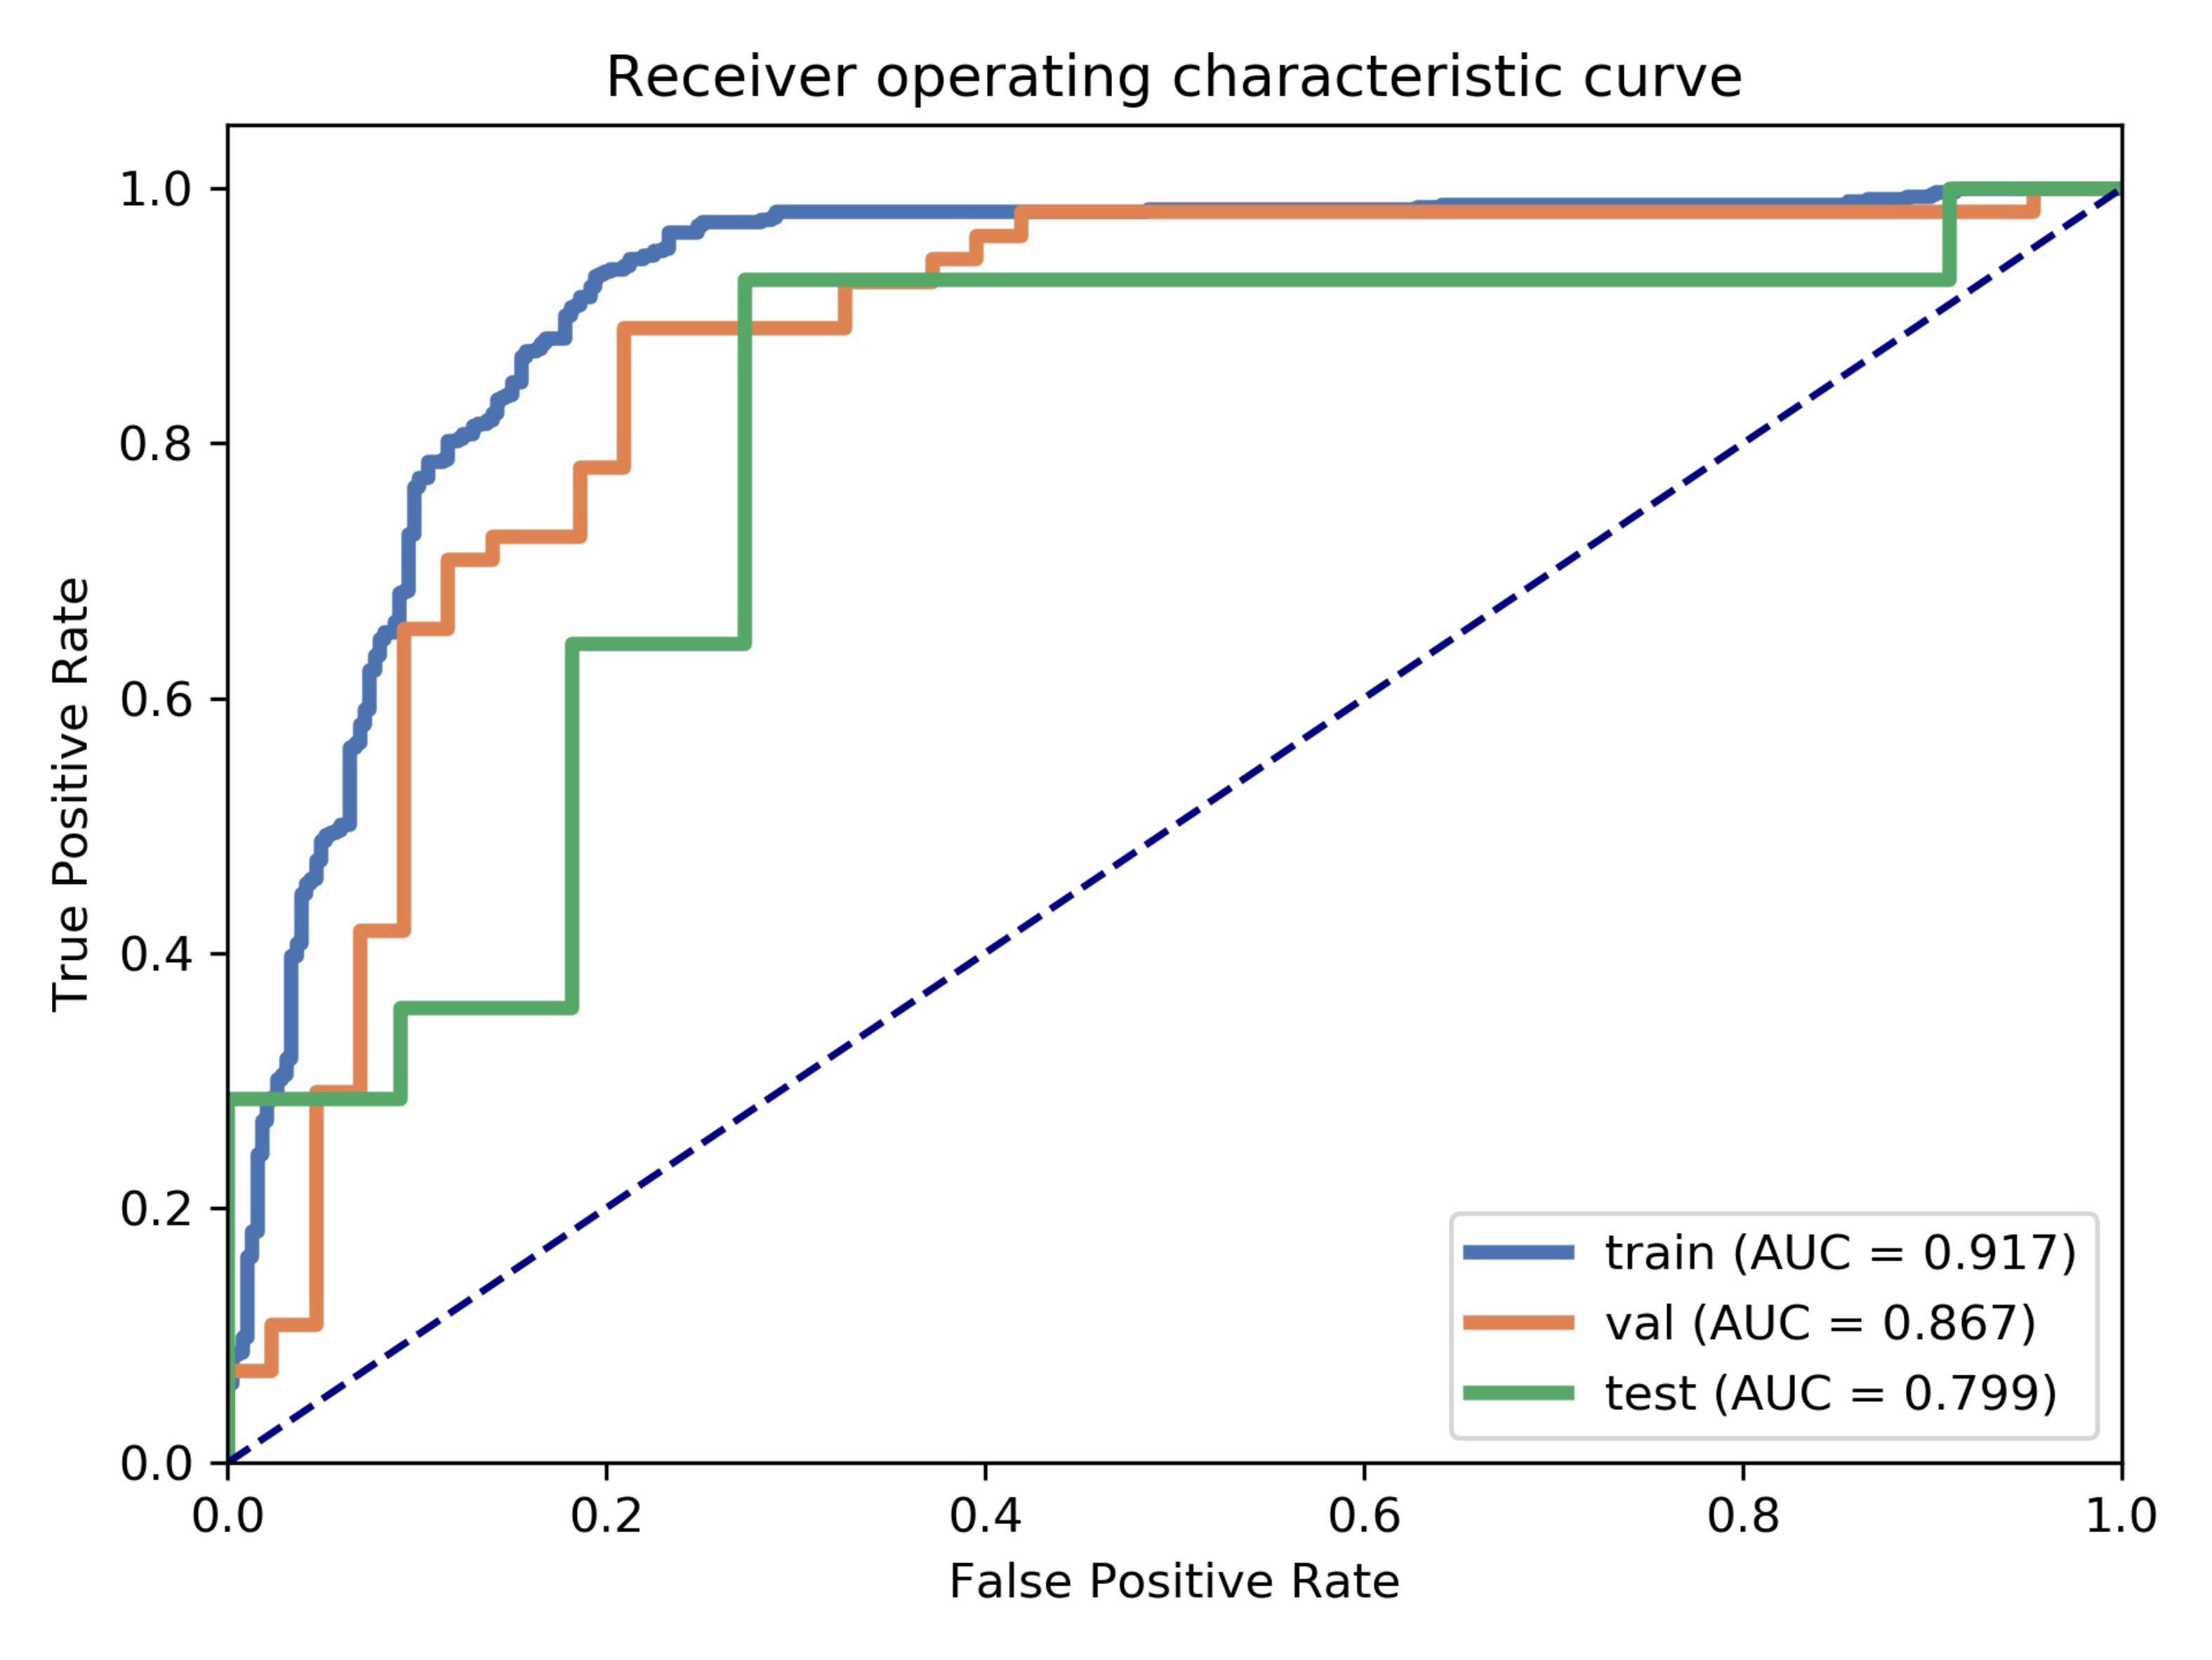
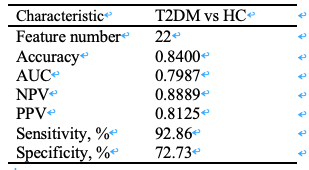
Compared with the HC, patients with T2DM had significantly decreased ALFF in the precentral gyrus and bilateral gyrus rectus (GRF-corrected cluster-level p < 0.05 and voxel-level threshold of p < 0.001; Fig. 1). We achieved the highest AUC on the validation dataset via cross-validation based on 22 features, and can generate a classification model to distinguish between T2DM and HC. Figure 2 displays the 22 key features and brain regions that showed the greatest discriminative power with the SVM model in classifying T2DM versus HC. These brain regions include the frontal lobe (left paracentral lobule and left gyrus rectus); the cerebellum; and multiple default-mode network (DMN) regions, such as the middle temporal gyrus (MTG), hippocampus, orbitofrontal cortex (OFC), and posterior cingulate cortex (PCC). We also found that the model achieved an accuracy and an AUC of 84.0% and 0.80, respectively, on the test dataset using the selected features; the details are presented in Table 1 and Figure 3.Discussion
In current study, we applied machine learning methods to neuroimaging data and achieved meaningful results. First, we found altered ALFF values in the precentral gyrus and bilateral gyrus rectus. Second, our results showed that important features contributing to the classification were identified and that the classification model achieved high accuracy (84.00%) when classifying the T2DM and HC groups. These findings may provide complementary information for understanding the underlying mechanisms of brain dysfunction in T2DM patients.Acknowledgements
This research is financially supported by the National Natural Science Foundation of China (KAL 81972872, 11826020), the Shanghai Pujiang Project (KAL 2014PJD028), the Shanghai Jiaotong University Cross-cooperation Project (KAL YG2015MS31), the Shanghai Science and Technology Commission Project (KAL 17441900700), and the Shanghai Shenkang Project (KAL 6CR3091B).References
1. Macpherson H, Formica M, Harris E, et al. Brain functional alterations in Type 2 Diabetes – A systematic review of fMRI studies[J]. Frontiers in Neuroendocrinology, 2017: 34-46.
2. Cheng G, Huang C, Deng H, et al. Diabetes as a risk factor for dementia and mild cognitive impairment: a meta-analysis of longitudinal studies.[J]. Internal Medicine Journal, 2012, 42(5): 484-491.
3. Bu, X., et al., Investigating the predictive value of different resting-state functional MRI parameters in obsessive-compulsive disorder. Translational Psychiatry, 2019. 9.
Figures