3909
Local and Distant Communications in Sleeping Brain Modeled by Multiscale Entropy
Yi-Chia Kung1, ChangWei Wesley Wu2,3, Pei-Jung Tsai4, Chia-Wei Lee5, Chun-Yi Zac Lo6, and Ching-Po Lin1
1Institute of Neuroscience, National Yang-Ming University, Taipei, Taiwan, 2Graduate Institute of Mind, Brain and Consciousness, Taipei Medical University, Taipei, Taiwan, 3Research Center of Brain and Consciousness, Shuang-Ho Hospital, New Taipei, Taiwan, 4Institute on Drug Abuse, National Institutes of Health, Baltimore, MD, United States, 5Department of Radiology, Wan Fang Hospital, Taipei Medical University, Taipei, Taiwan, 6Institute of Science and Technology for Brain-inspired Intelligence (ISTBI), Shanghai, China
1Institute of Neuroscience, National Yang-Ming University, Taipei, Taiwan, 2Graduate Institute of Mind, Brain and Consciousness, Taipei Medical University, Taipei, Taiwan, 3Research Center of Brain and Consciousness, Shuang-Ho Hospital, New Taipei, Taiwan, 4Institute on Drug Abuse, National Institutes of Health, Baltimore, MD, United States, 5Department of Radiology, Wan Fang Hospital, Taipei Medical University, Taipei, Taiwan, 6Institute of Science and Technology for Brain-inspired Intelligence (ISTBI), Shanghai, China
Synopsis
Multiscale entropy (MSE) was used to disclose the mixture between functional integration and segregation of brain circuits across NREM sleep. MSE showed N0>N2 and N1>N2 in Scale 1, accompanied with N2>N1 and N2>N3 in Scale 3. The scale-dependent entropy reflects distinct aspects of information processing in the sleeping brain: brain tends to distribute information distantly during the N2 stage and disintegrate both locally and distantly at the N3 stage.
Introduction
A growing body of the literature indicated that the neurophysiology changes across NREM sleep stages with the complexity alteration. Multiscale entropy (MSE) analysis enables capturing multiple complexity levels within each temporal signal across different time scales, which has been applied to the functional MRI (fMRI) for differentiating patients with schizophrenia1. Previous study indicated that MSE at different scales indicates different types of local and distant neural communications2. In this study, we applied the scale-dependent MSE to human fMRI data in sleep and attempted to reveal the distinct brain communication patterns. We suggest the distinct pattern of brain communication in NREM sleep could lead to the entropy change and corresponding consciousness loss.Methods
The simultaneous EEG-fMRI data were collected from 12 healthy men (age=22.9±2.5 y/o) using 3T SIEMENS Trio MRI with a 32-channel MRI-compatible system (Brain Products, Gilching, Germany) at National Yang-Ming University. The fMRI data were acquired at most two hours long during sleep (TR/TE/FA=2500ms/30ms/80°, FOV=220, matrix size=64x64, 35 slices with 3.4 mm thickness). T1-weighted image (3d-MPRAGE, voxel size=1x1x1mm, TR/TE/TI/FA=1900ms/2.28ms/900ms/9°) and resting-state fMRI were acquired before the sleep session, regarded as wakefulness (N0). Recorded EEG data were analyzed offline for sleep scoring by a licensed sleep technician to categorize sleep stages as Stage I (N1), Stage II (N2), or Stage III (N3). MSE analysis3 using a coarse-graining procedure to estimate sample entropy in multiple time scales (scale = 1-3 due to limited time samples). MSE calculation could be summarized as follows: (a) coarse-grained time series was constructed according to different scale factors; (b) the sample entropy was quantified for each coarse-grained time series, and (c) the sample entropy profile was examined over a range of scales.Results
MSE in Scale 1 and Scale 3 shows the significant difference (Figure 1, repeated measure ANOVA, PFDR<.05) among sleep stages. Precisely, entropy shows N0>N2 (P=.0001) and N1>N2 (P=.013) in Scale 1, accompanied with N2>N1 (P=.006) and N2>N3 (P=.002) in Scale 3. We further examined the changes for the sleep-related networks including default mode network, dorsal attention network, and cingulo-opercular network (Figure 2). Complexity during N2 reduced in Scale 1 than wakefulness; while in Scale 3, entropy in N2 was increased relative to N0 and N3. In contrast to the wakefulness (N0), brain in N2 sleep moved toward a true complexity pattern, where sample entropy decreased in shortest time scales while increased in the largest scale factor.Discussion
Our finding suggests that the changes in entropy that occur throughout the sleep-wake cycle are strongly dependent on the time scale. Based on the regulation of neural synchrony theory, scale-dependent neural complexity is related to the information process that reflects the tendency of brain communication. Coarse time scales reflect long-range interactions among distributed neural populations, while fine time scales reflect interconnectivity across local neural populations4. Compared to the other NREM sleep stage, the highest entropy at coarse time scale during N2 sleep reflected the brain communication toward distributed interaction5. In contrast, the lower complexity in N1 and N3 sleep presented decreased long-range communication, in good agreements with the reduced physical long-distance connections in NREM sleep6.Conclusion
The MSE approach for brain functional network provides new metric for distinct information processing in NREM sleep. The scale-dependent entropy suggests the mixture between functional integration and segregation of a system’s output7. Brain communication tends to integration at the distributed level during N2 sleep and in favor of local integration during N1 and N3.Acknowledgements
This study was supported in part by grants from Ministry of Science and Technology, Taiwan (MOST 108-2321-B-010-010-MY2, MOST 108-2420-H-010-011, MOST108-2410-H-038-007) and National Health Research Institutes, Taiwan (NHRI-EX108-10611EI).References
- Yang AC, Hong C-J, Liou Y-J, et al. Decreased resting-state brain activity complexity in schizophrenia characterized by both increased regularity and randomness. Hum Brain Mapp. 2015;36(6):2174-2186. doi:10.1002/hbm.22763.
- McDonough IM, Nashiro K. Network complexity as a measure of information processing across resting-state networks: evidence from the Human Connectome Project. Front Hum Neurosci. 2014;8:409. doi:10.3389/fnhum.2014.00409.
- Costa M, Goldberger AL, Peng CK. Multiscale entropy analysis of biological signals. Phys Rev E. 2005;71(2 Pt 1):021906. doi:10.1103/PhysRevE.71.021906.
- Wang DJJ, Jann K, Fan C, et al. Neurophysiological Basis of Multi-Scale Entropy of Brain Complexity and Its Relationship With Functional Connectivity. Front Neurosci. 2018;12:352. doi:10.3389/fnins.2018.00352.
- McIntosh AR, Vakorin V, Kovacevic N, Wang H, Diaconescu A, Protzner AB. Spatiotemporal dependency of age-related changes in brain signal variability. Cereb Cortex. 2014;24(7):1806-1817. doi:10.1093/cercor/bht030.
- Spoormaker VI, Schröter MS, Gleiser PM, et al. Development of a large-scale functional brain network during human non-rapid eye movement sleep. J Neurosci. 2010;30(34):11379-11387. doi:10.1523/JNEUROSCI.2015-10.2010.
- Pedersen M, Omidvarnia A, Walz JM, Zalesky A, Jackson GD. Spontaneous brain network activity: Analysis of its temporal complexity. Netw Neurosci. 2017;1(2):100-115. doi:10.1162/NETN_a_00006.
Figures
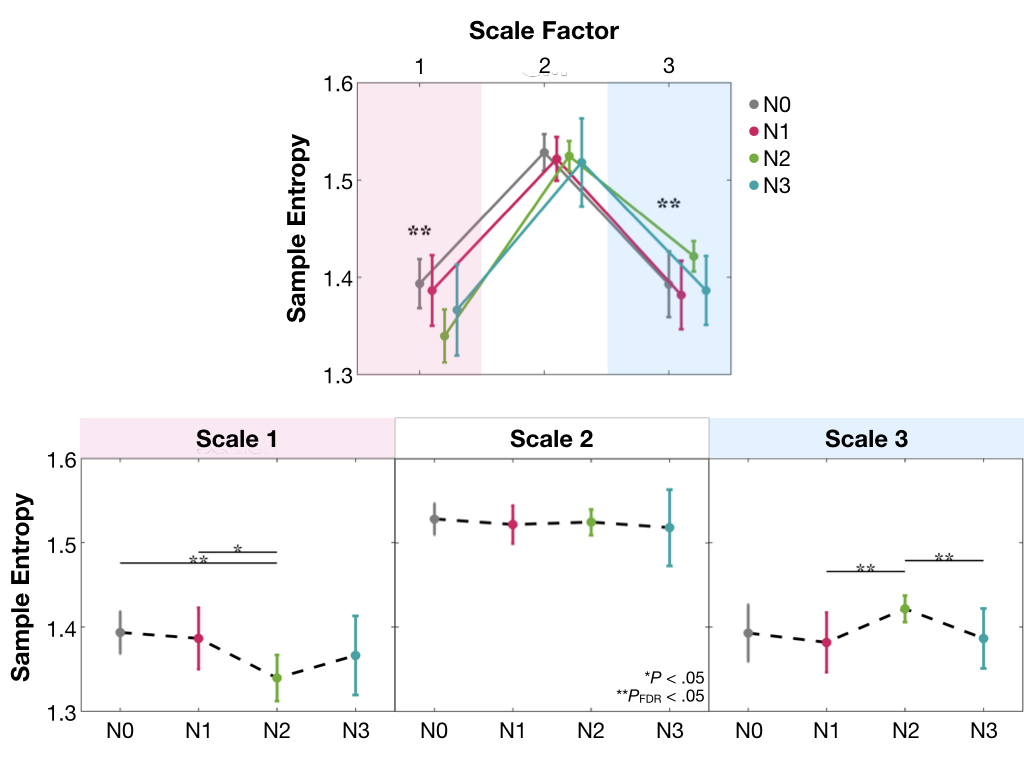
MSE alteration of gray matter across NREM sleep stages.
(*sig. difference and **sig. presents meaningful
differences for repeated measure AVNOVA with FDR corrected and uncorrected P < .05, respectively)
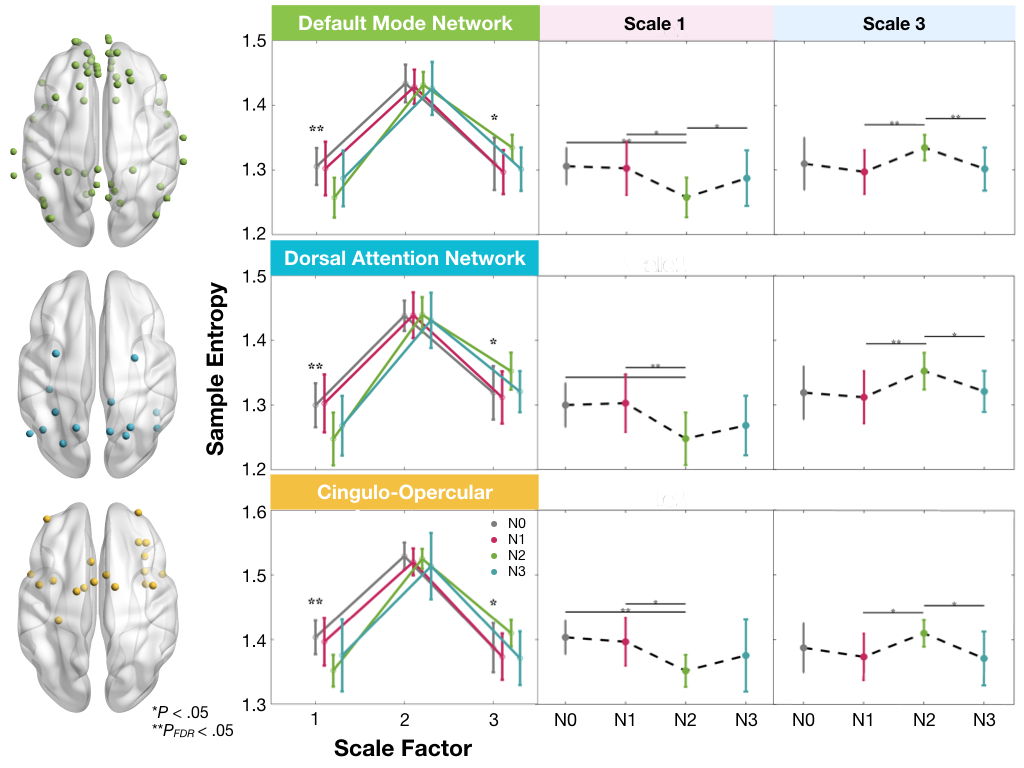
MSE alteration in sleep-related networks. (*sig. difference and **sig. presents meaningful differences for repeated measure AVNOVA
with FDR corrected and uncorrected P < .05, respectively)