3908
Hemodialysis is associated with more severe disrupted brain functional networks in patients with end-stage renal disease1Huaxi MR Research Center (HMRRC), Department of Radiology, West China Hospital of Sichuan University, Chengdu, China, 2Department of Nuclear Medicine, West China Hospital of Sichuan University, Chengdu, China, 3Department of Psychology, School of Public Administration, Sichuan University, Chengdu, China
Synopsis
Although patients with end-stage renal disease (ESRD) have shown brain structural and functional alterations, the change patterns of the whole-brain functional networks remain largely unknown. We aimed to explore the brain functional topologic organization differences among ESRD patients with hemodialysis (HD) and without dialysis and healthy controls (HCs) using graph-based network analysis. Compared with HCs, ESRD patients showed aberrant global and local topologic organizations, which is more obvious in HD patients. Furthermore, some topologic parameters were associated with cognitive performances and clinical markers.
Introduction
Cognitive impairment is common in patients with end-stage renal disease (ESRD) 1, especially in those undergoing hemodialysis (HD) 2-4. Previous studies have found brain structural and functional alterations in ESRD patients, which are associated with cognitive impairment. However, the change patterns of the whole-brain functional networks and the effect of HD on network architectures remain largely unknown. Therefore, we aimed to study the differences of global and local topologic properties among ESRD patients with HD and without dialysis and controls to identify the patterns of topologic organization of brain functional networks in HD patients using graph-based network analysis of resting-state functional magnetic resonance imaging (RS-fMRI). In addition, the relationships between the topologic parameters and clinical markers were further analyzed.Methods
51 patients with ESRD including 25 patients undergoing HD (HD group) and 26 patients who were not undergoing HD or peritoneal dialysis (Non-dialysis group), and 36 age-, gender-, and education-matched healthy controls (HCs group) were prospectively enrolled. Neurocognitive function was assessed for all subjects and ESRD patients underwent laboratory examinations. All the MR scans were performed on a 3.0 T GE MR750 scanner with a 16-channel head coil. The RS-fMRI data was obtained using a gradient-echo echo-planar (GRE-EPI) sequence. After data preprocessing using DPABI software, we used the toolbox GRETNA to perform network construction based on an automated anatomical labeling (AAL) atlas 5. Then graph theoretical analysis was used to calculate the network parameters including characteristic path length (Lp), clustering coefficient (Cp), normalized characteristic path length (λ), normalized clustering coefficient (γ), small-worldness (σ), global efficiency (Eg) and local efficiency (Eloc). The area under the curve (AUC) values of the network parameters were compared using one-way analysis of variance (ANOVA). If the ANOVA test found significant differences, a post-hoc test was performed to assess the inter-group differences with the Bonferroni correction for multiple comparisons. Pearson analysis was used to evaluate the relationships between the topologic parameters and the neuropsychological test results and clinical variables, with the Bonferroni correction for multiple comparisons.Results
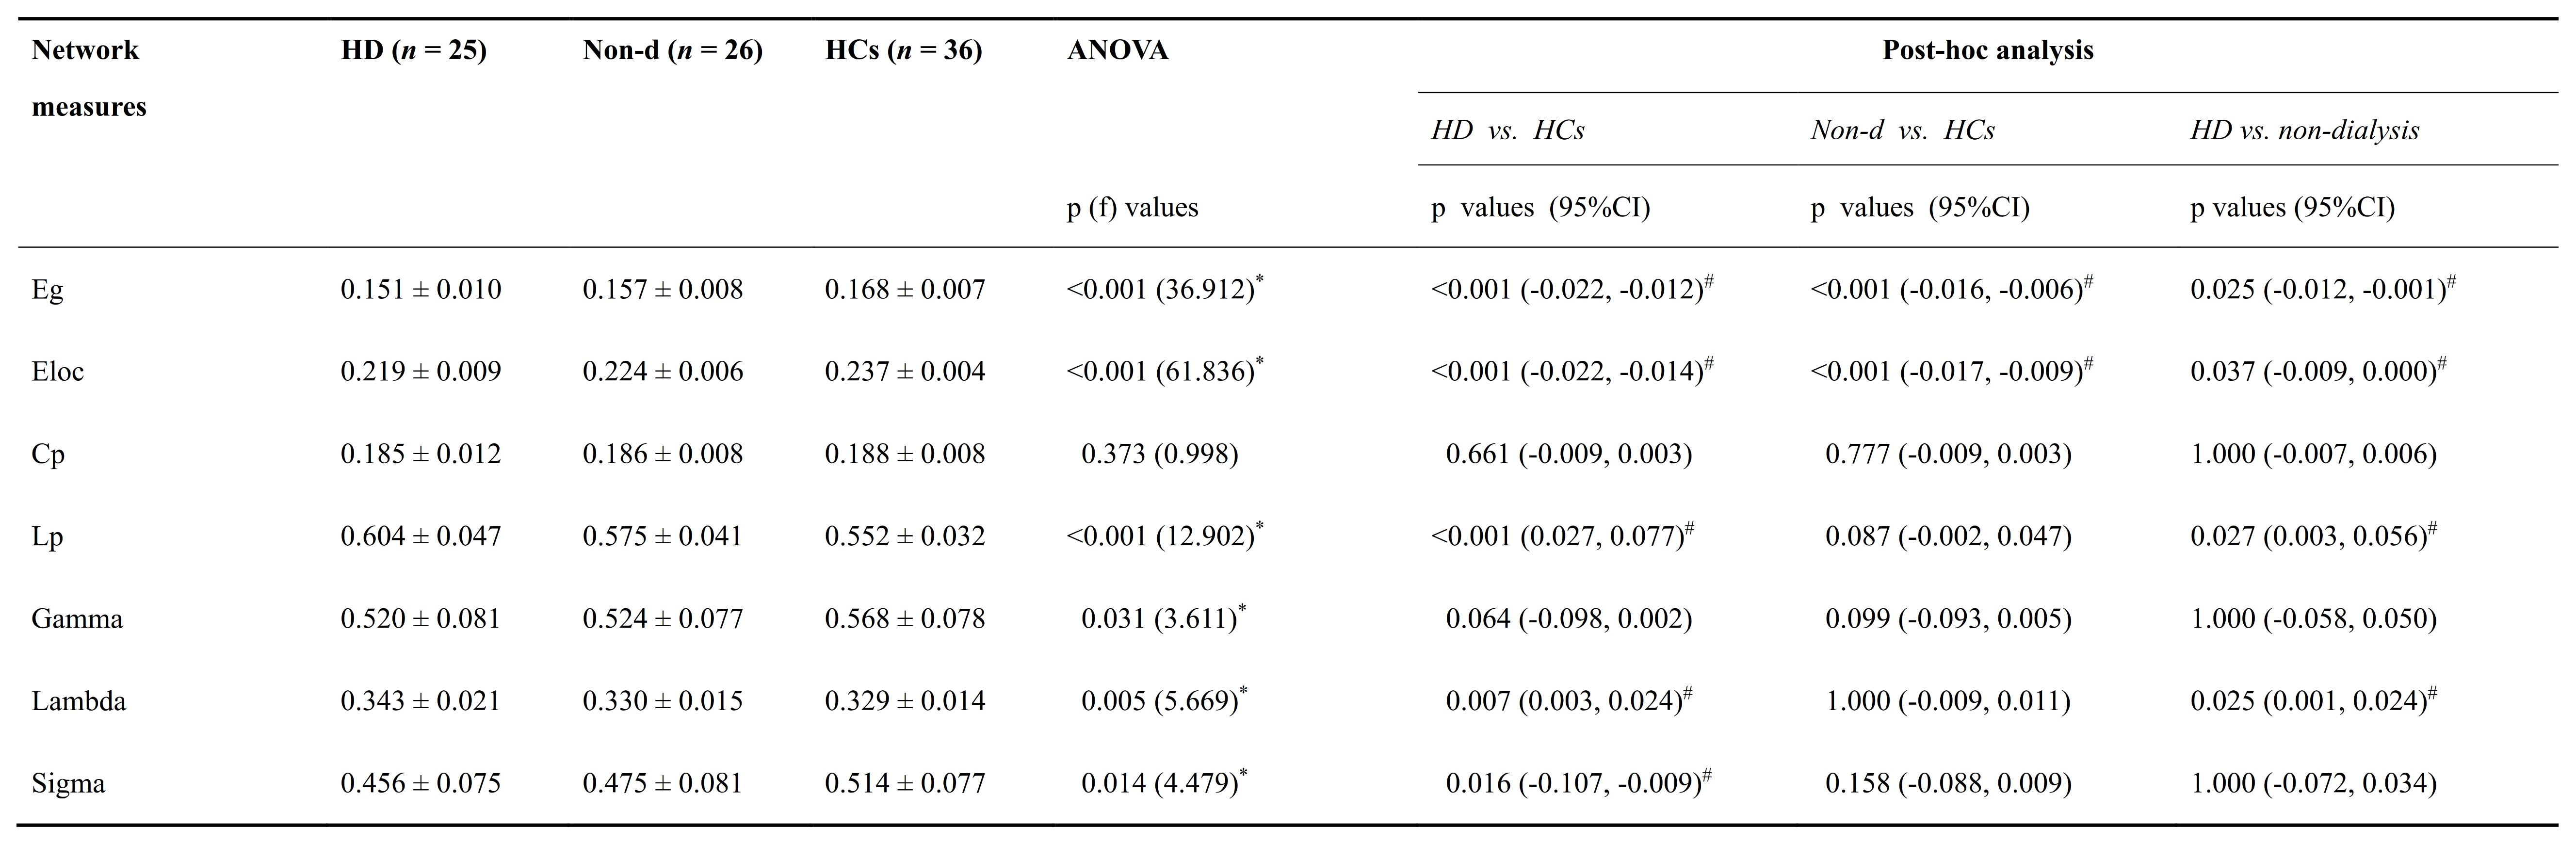
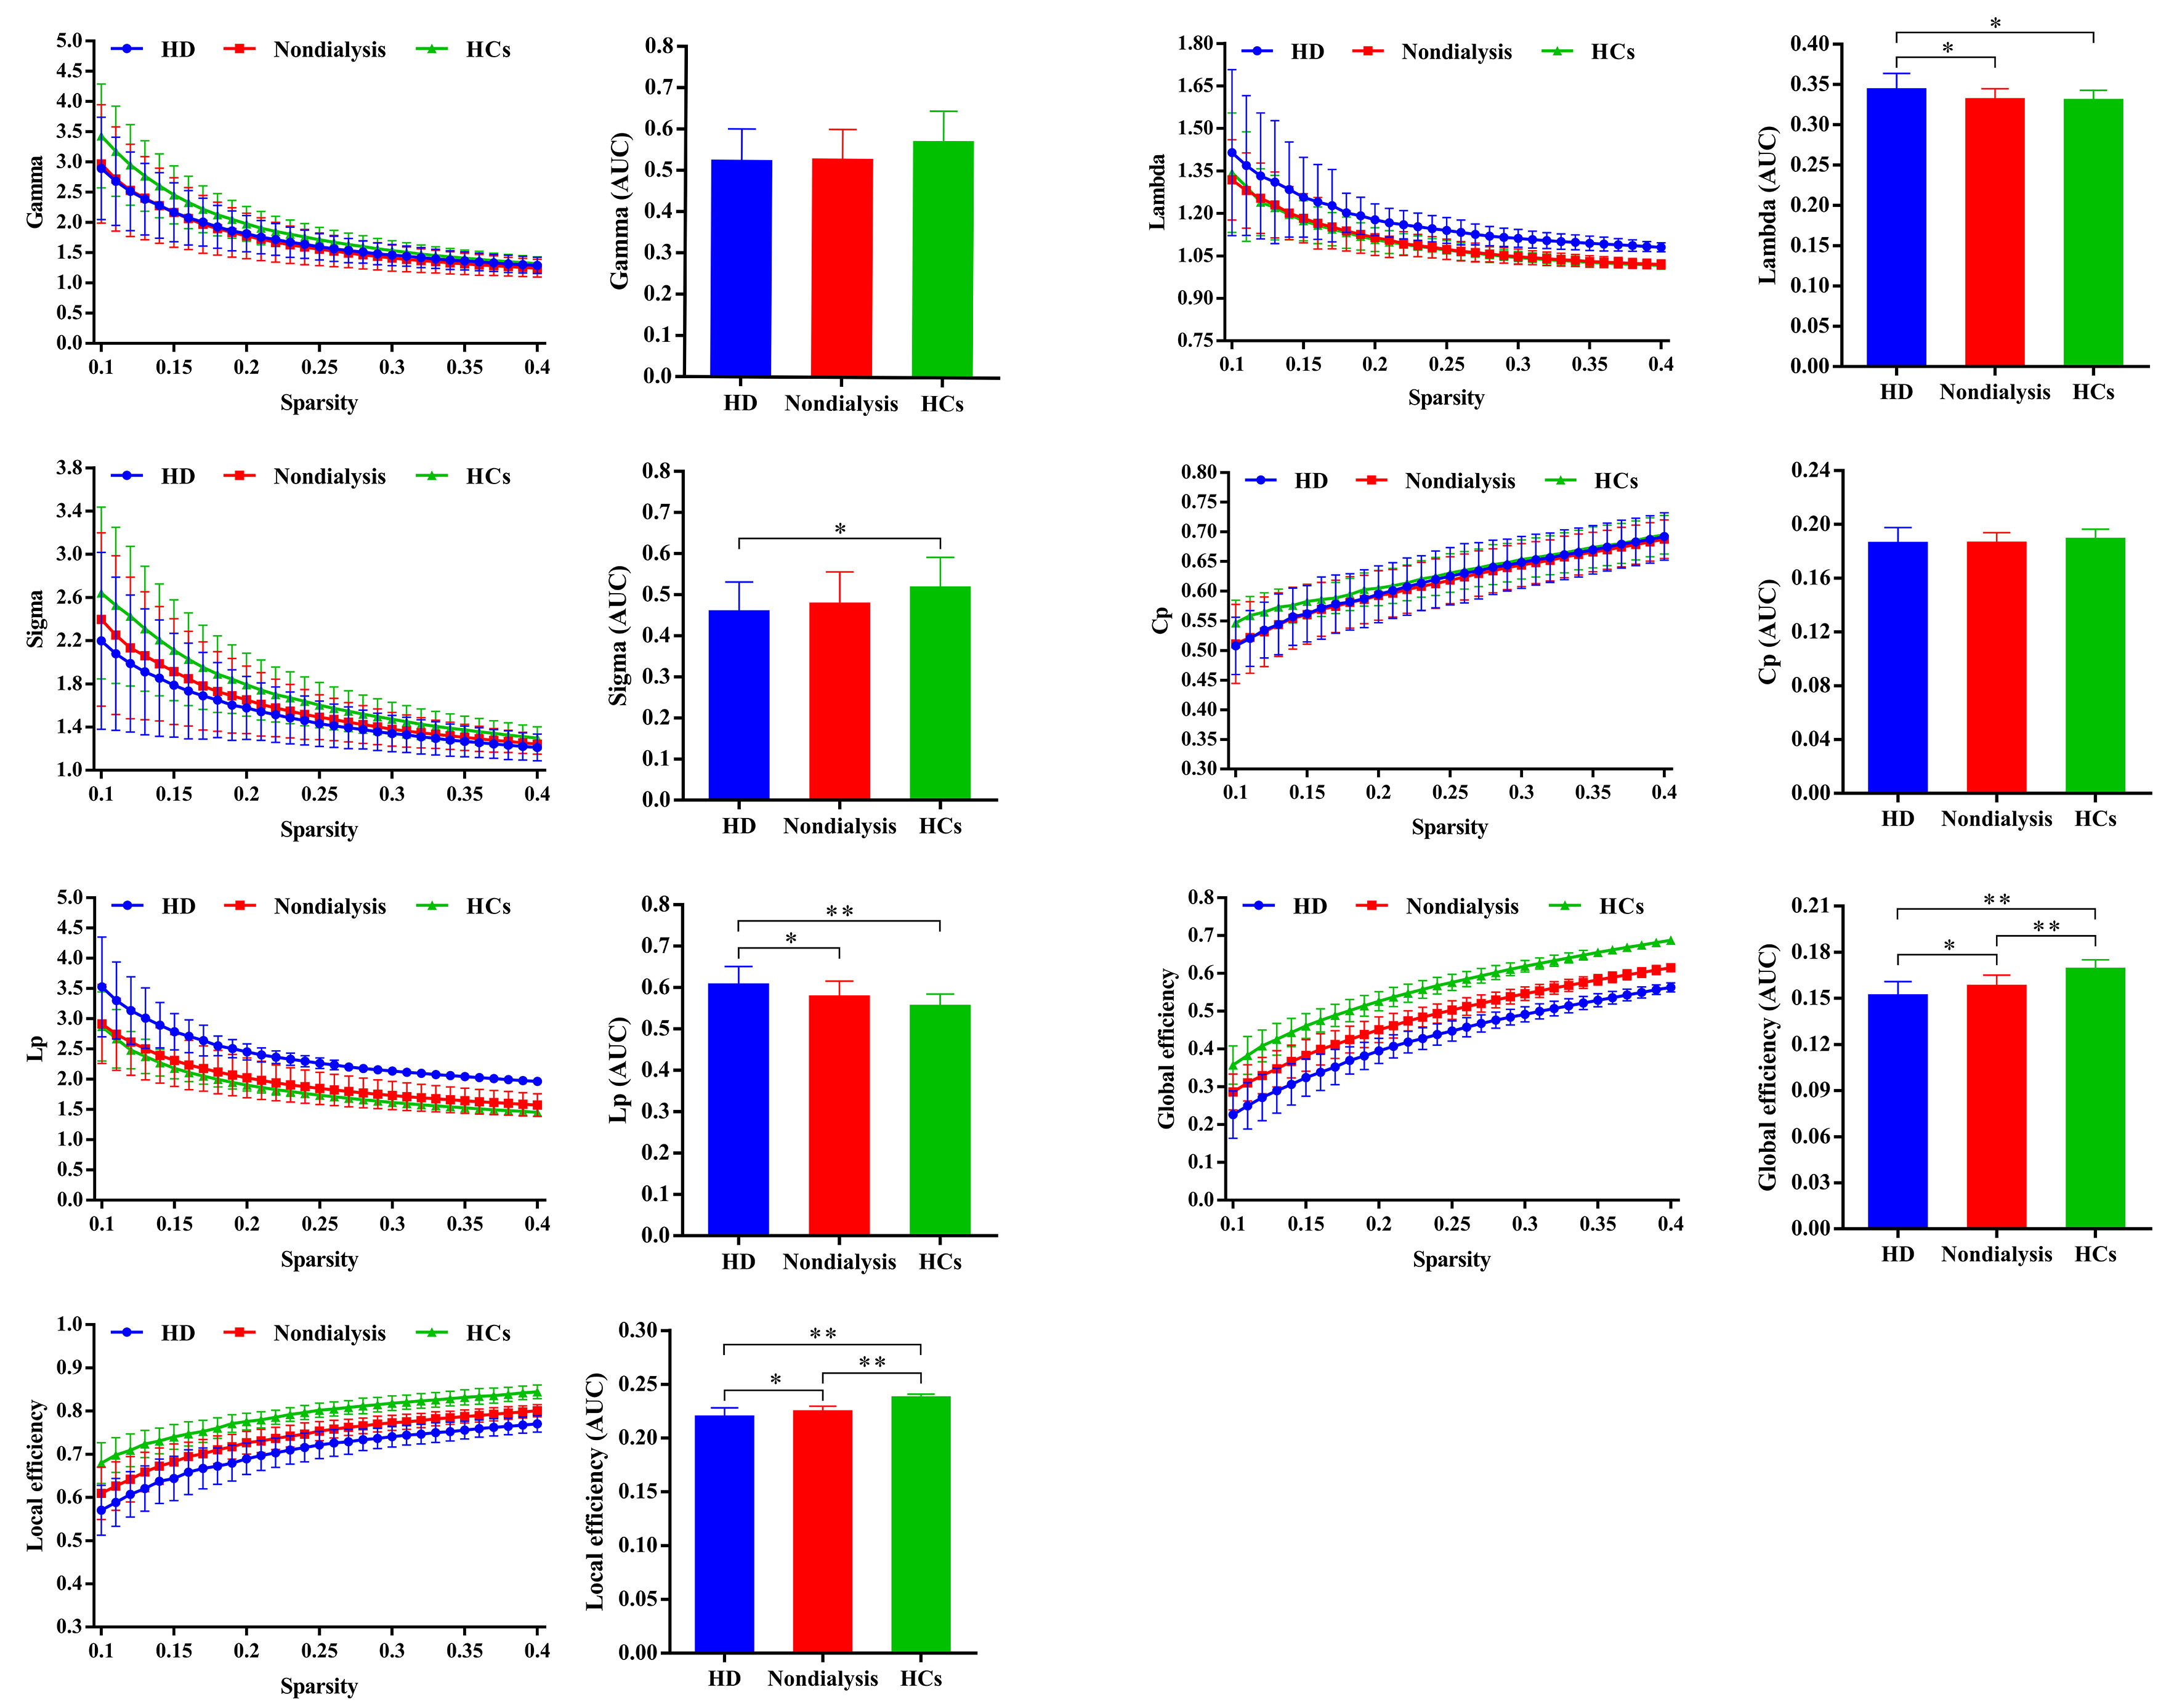
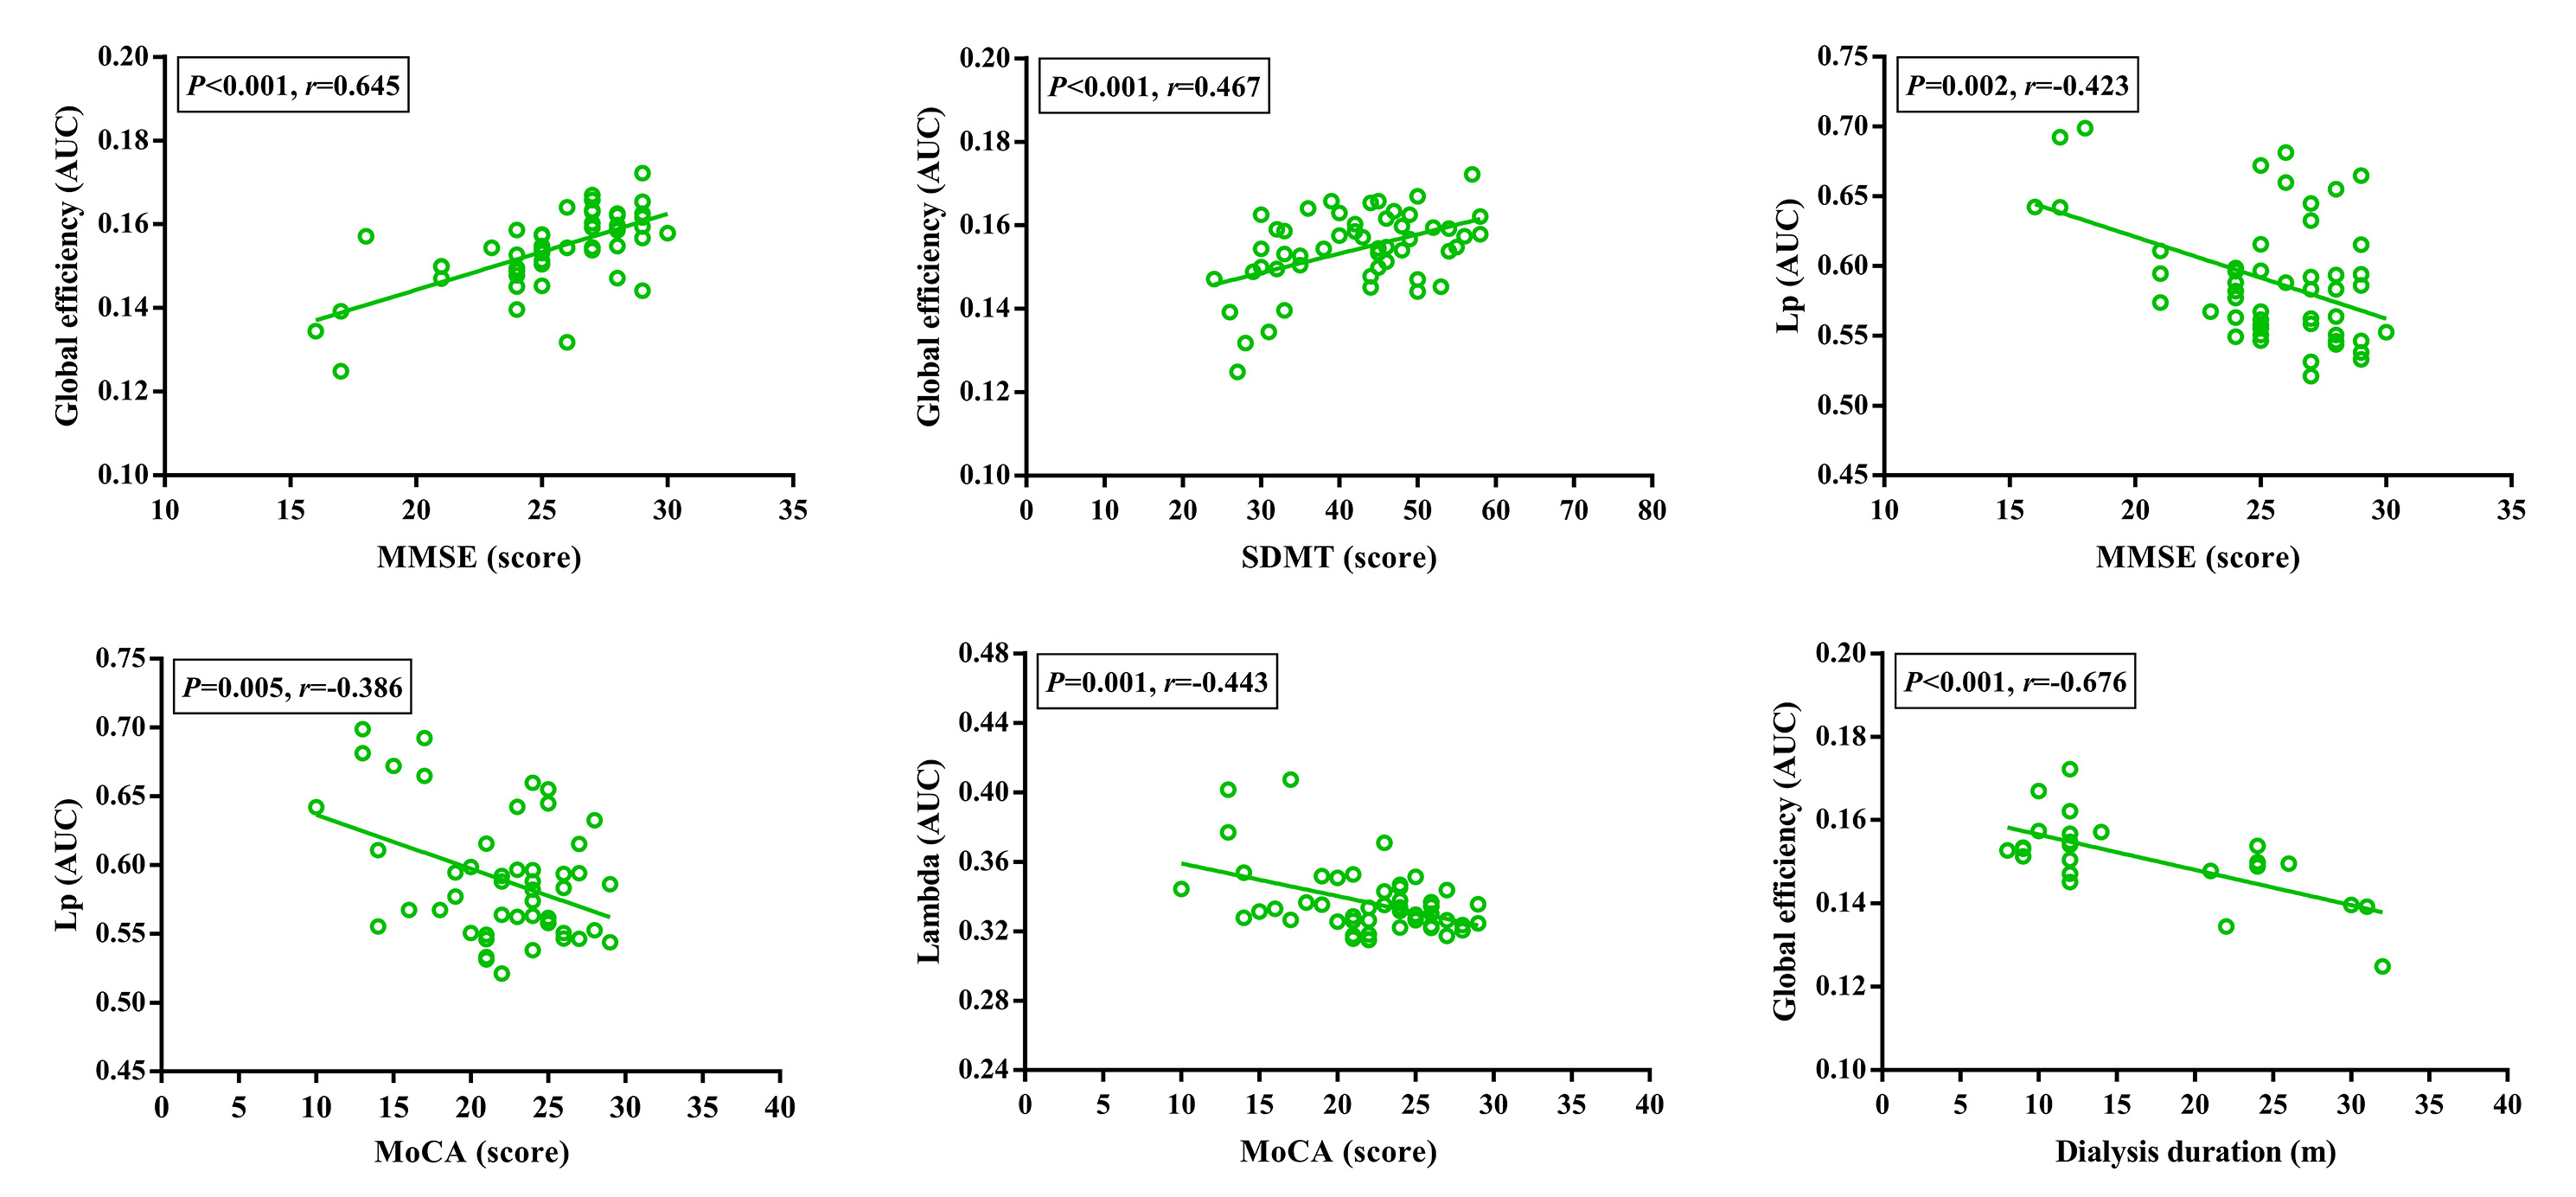
Demographics and clinical data for ESRD patients and HCs were shown in Fig. 1. An economical small-world organization was demonstrated in all of the three groups, with γ greater than 1, λ approximately 1 and σ greater than 1. However, the small-world organizations were disrupted in ESRD patients, especially in HD patients. HD patients displayed increased Lp and λ than the other two groups; however, there were no significant differences for Lp and λ between non-dialysis patients and HCs. Moreover, HD patients showed lower small-worldness than HCs, and no differences were found between HD patients and non-dialysis patients and between non-dialysis patients and HCs. In addition, both the two patient groups showed significant decreased Eg and Eloc than the HCs group. Moreover, there was a further significant decrease of Eg and Eloc in HD patients than those in non-dialysis patients (all p < 0.05 after Bonferroni corrected; Fig. 2 and Fig. 3). Furthermore, some topologic parameters were associated with clinical variables and cognitive performances (Fig. 4).Discussion
Our results revealed that both HD patients and non-dialysis patients showed disrupted functional brain networks compared with HCs, which were associated with cognitive impairment. Particularly, a much more severe disruption of functional brain networks was shown in HD patients. The alterations of global and local topologic properties suggest that ESRD patients not only have a decreased capacity for transmitting information at the local level, but also exhibit a lower ability to integrating and transmitting information at the global level. These abnormalities may lead to cognitive impairment in ESRD patients. Small-world architectures can not only support specific modular information and fast global information processing, but also maximize the efficiency of brain network 6. In the current study, although HD patients still had small-world properties (γ > 1, λ ≈ 1 and σ > 1), a lower σ and a longer λ were found in these patients rather than non-dialysis patients, which revealed that the optimal topologic characteristics of the small-world network were significantly weakened.Conclusion
The current study indicates that ESRD patients exhibit disruption of brain functional networks, which is more severe in HD patients, and these alterations correlate with cognitive performances and clinical markers. These findings may provide new perspectives for understanding the potential neuropathogenesis of cognitive impairment in ESRD patients.Acknowledgements
This study was supported by the National Natural Science Foundation (Grant Nos. 81971595, 81771812, 81761128023 and 81621003). Program for Changjiang Scholars and Innovative Research Team in University (PCSIRT, Grant No. IRT16R52) of China, and the Science and Technology Department of Sichuan Province (2018SZ0391) and the Innovation Spark Project of Sichuan University (No. 2019SCUH0003).References
1. Webster AC, Nagler EV, Morton RL, Masson P. Chronic Kidney Disease. Lancet (London, England) 2017;389:1238-1252.
2. Sehgal, Ashwini R., Grey, Scott F., Deoreo, Peter B., Whitehouse, Peter J. Prevalence, recognition, and implications of mental impairment among hemodialysis patients. American Journal of Kidney Diseases 1997;30:41-49.
3. Manjula K, Chertow GM, Jennifer L, Kristine Y. Cognitive impairment in chronic kidney disease. Journal of the American Geriatrics Society 2014;36:116-117.
4. Manjula K, Jennifer L, Kristine Y, Chertow GM. Validation of the Kidney Disease Quality of Life (KDQOL) cognitive function subscale. Kidney international 2004;66:2361-2367.
5. Tzourio-Mazoyer N, Landeau B, Papathanassiou D, et al. Automated Anatomical Labeling of Activations in SPM Using a Macroscopic Anatomical Parcellation of the MNI MRI Single-Subject Brain. NeuroImage 2002;15:273-289.
6. He Y, Evans A. Graph theoretical modeling of brain connectivity. Current opinion in neurology 2010;23:341-350.
Figures
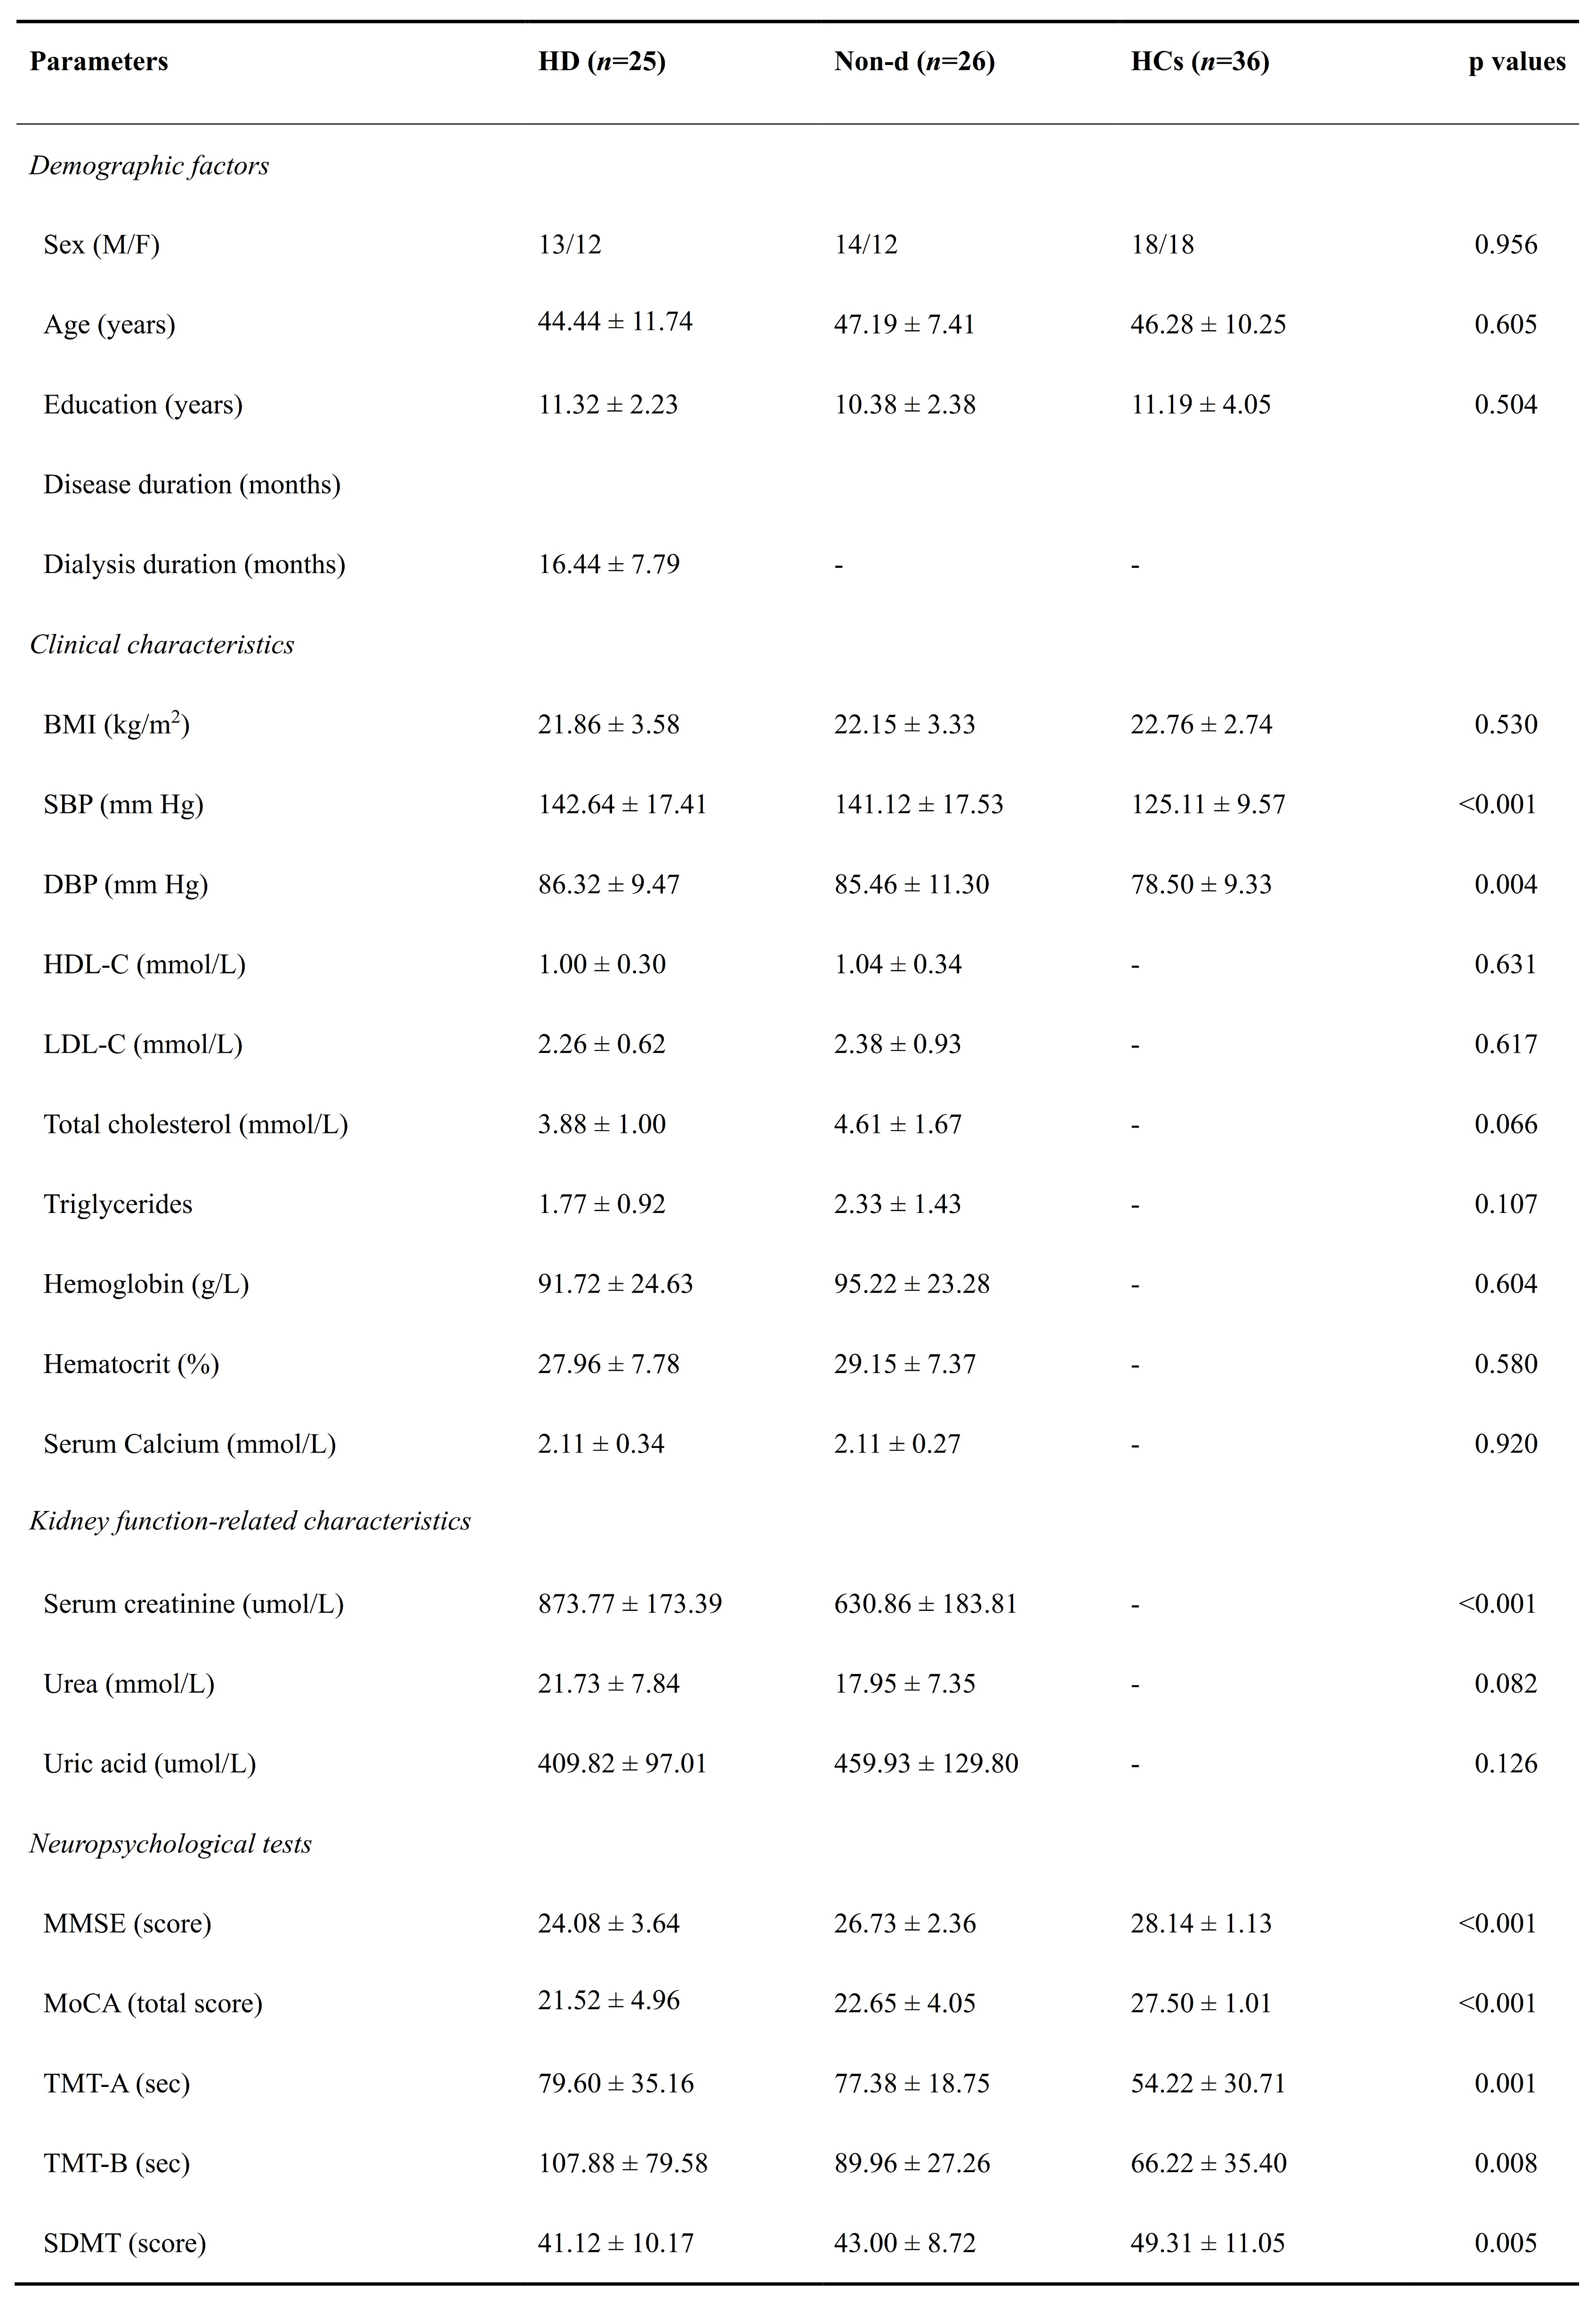
Fig. 1 Demographics and clinical data of patients with ESRD and HCs. ESRD, end-stage renal disease; HD, hemodialysis; Non-d, non-dialysis; HCs, healthy controls; BMI, body mass index; SBP, systolic pressure; DBP, diastolic pressure; HDL-C, high-density lipoprotein cholesterol; LDL-C, low-density lipoprotein cholesterol; MMSE, mini-mental state examination; MoCA, Montreal cognitive assessment; TMT-A, trail making test A; TMT-B, trail making test A; SDMT, symbol digit modalities test.