3907
Assessing somatotopic and mototopic organisation in Focal Hand Dystonia using high-resolution 7T-fMRI1Sir Peter Mansfield Imaging Centre, University of Nottingham, Nottingham, United Kingdom, 2Psychology, University of Nottingham, Nottingham, United Kingdom, 3Nottingham Trust University Hospitals, University of Nottingham, Nottingham, United Kingdom, 4Wellcome Centre for Human Neuroimaging, UCL, London, United Kingdom
Synopsis
Six patients with Focal Hand Dystonia (FHD) were scanned at 7T both 4 weeks and 3 months after Botox treatment, along with age-matched healthy controls (HCs). Behaviourally, spatial acuity was raised in the FHD patients compared to HCs. Travelling wave fMRI data were collected to assess somatotopy and mototopy. Compared to age-matched healthy controls and a healthy probabilistic atlas, FHD patients show little difference in somatotopy. Spatial overlap of digits was not found to be significantly different between FHD patients and HCs. In both groups there was high spatial overlap of somatosensory and motor responses in the post-central gyrus.
Introduction
Somatotopic mapping of the digits using a travelling-wave (TW) fMRI paradigm at 7T is highly reproducible in human primary somatosensory cortex of healthy subjects [1]. Focal hand dystonia (FHD) patients have been suggested to have reduced inter-digit distances and increased overlapping activity compared to healthy controls [2], as well as raised temporal and spatial discrimination thresholds [3], [4]. Here, FHD patients were scanned 4 weeks after (POST-Botox) and again 3 months after (PRE-Botox) treatment with Botulinum-Toxin-A (Botox), a symptomatic steroid injected into the nerve [5]. The fMRI scan session comprised resting state measures, TW somatosensory mapping of both hands, and a mototopy TW. A behavioural battery was also performed in both visits.Methods
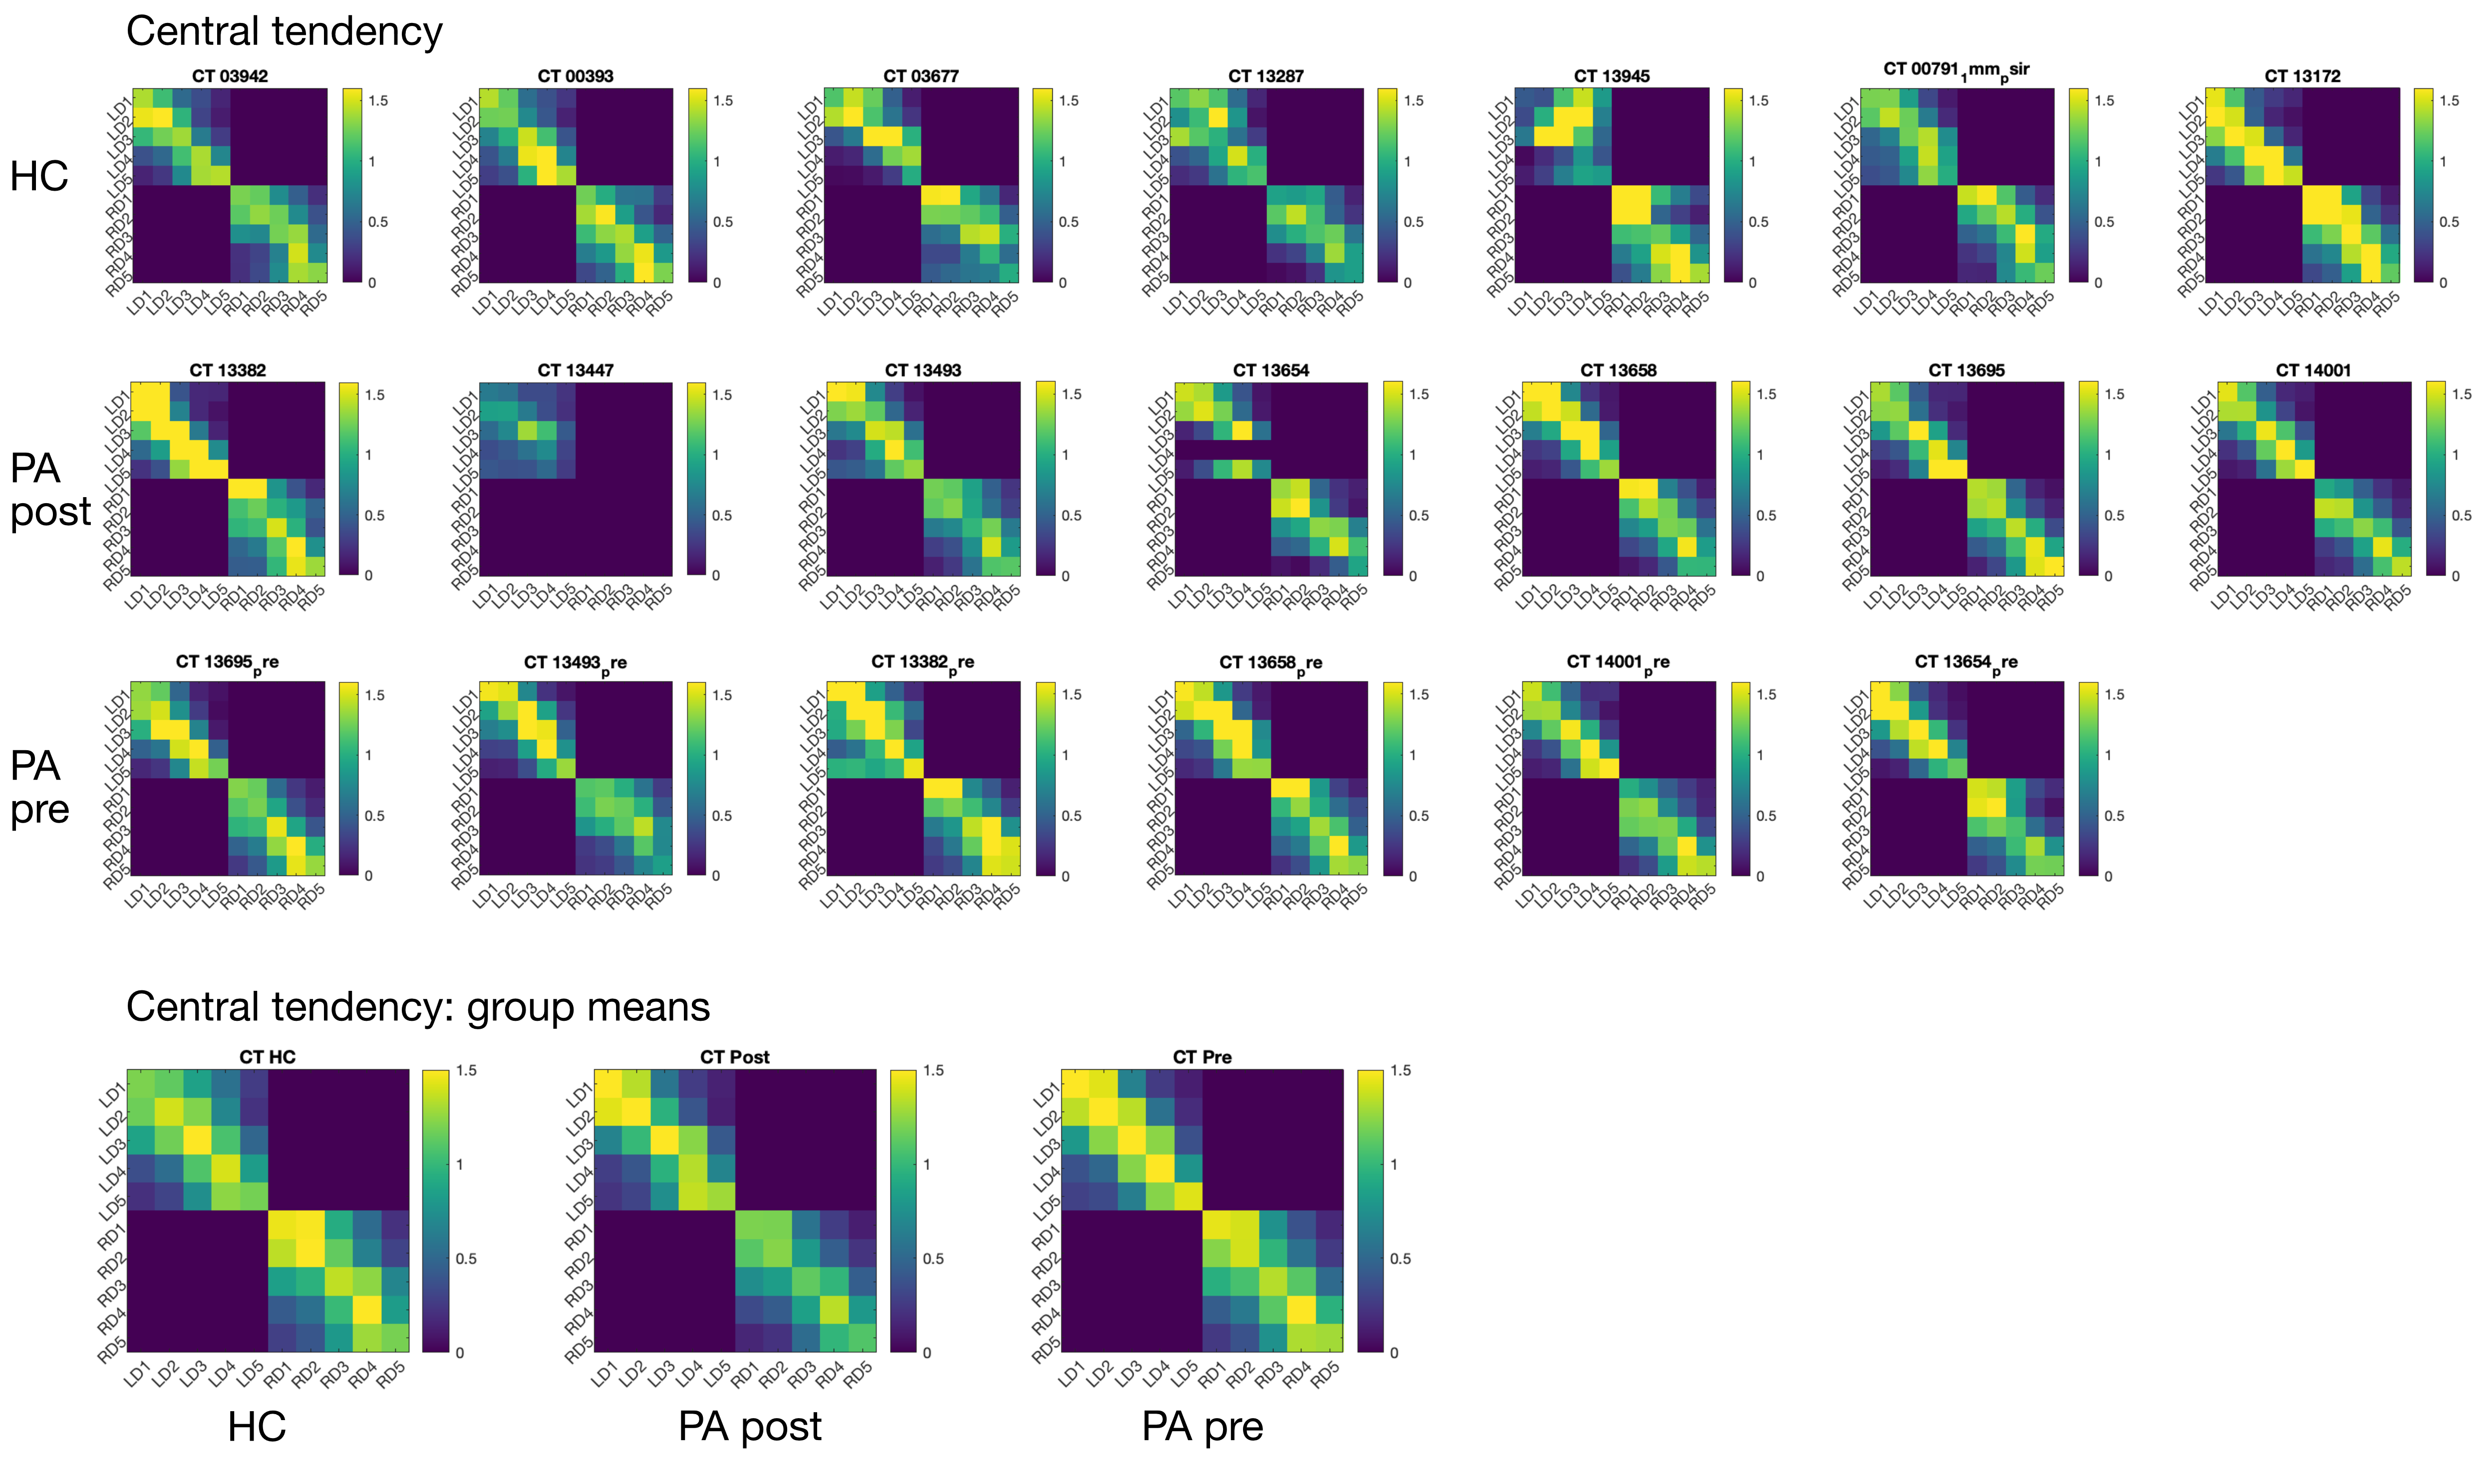
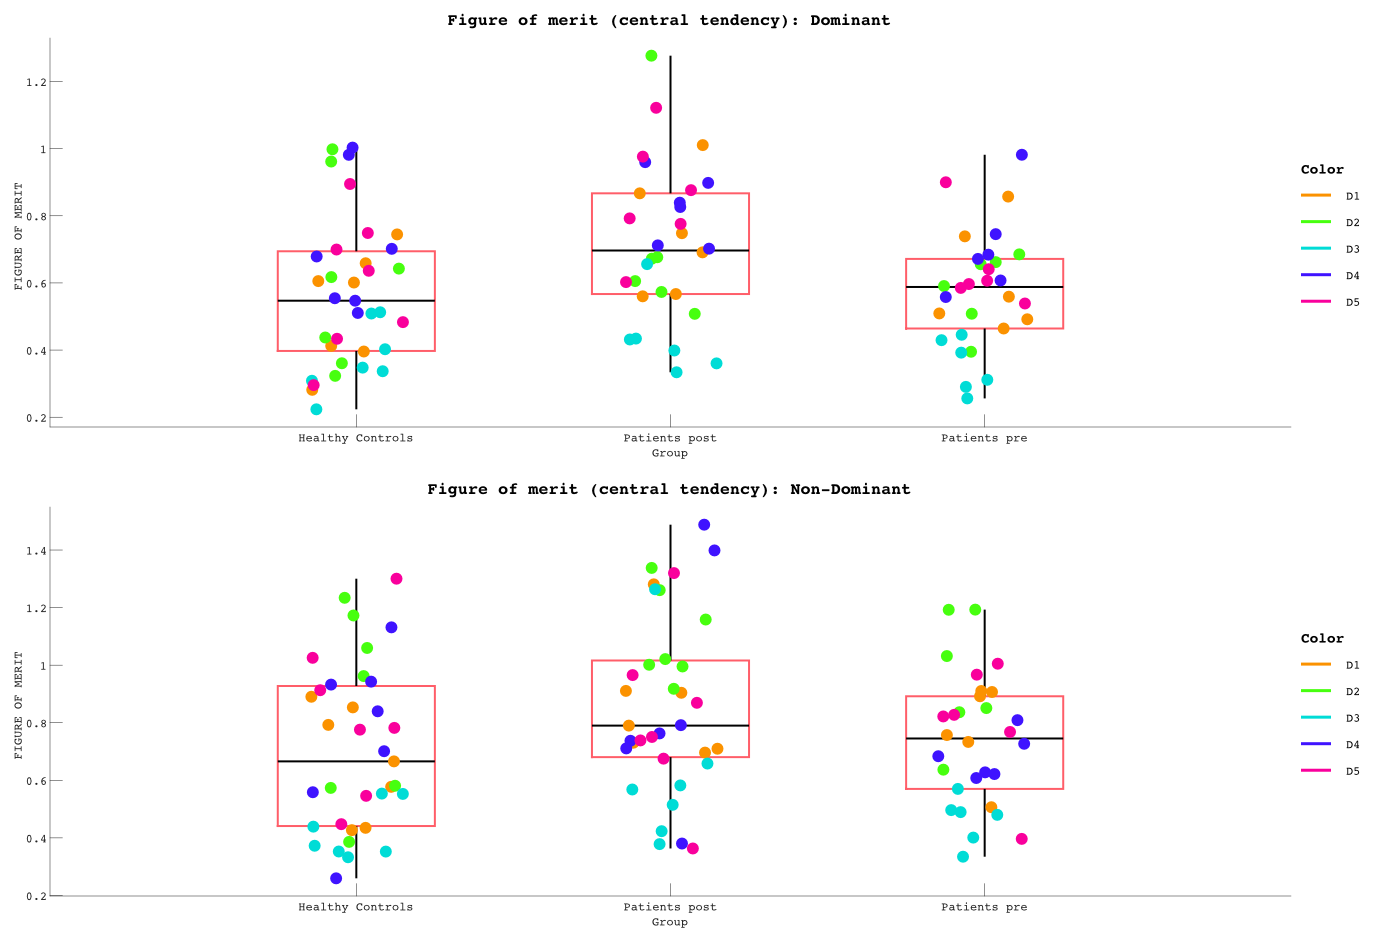
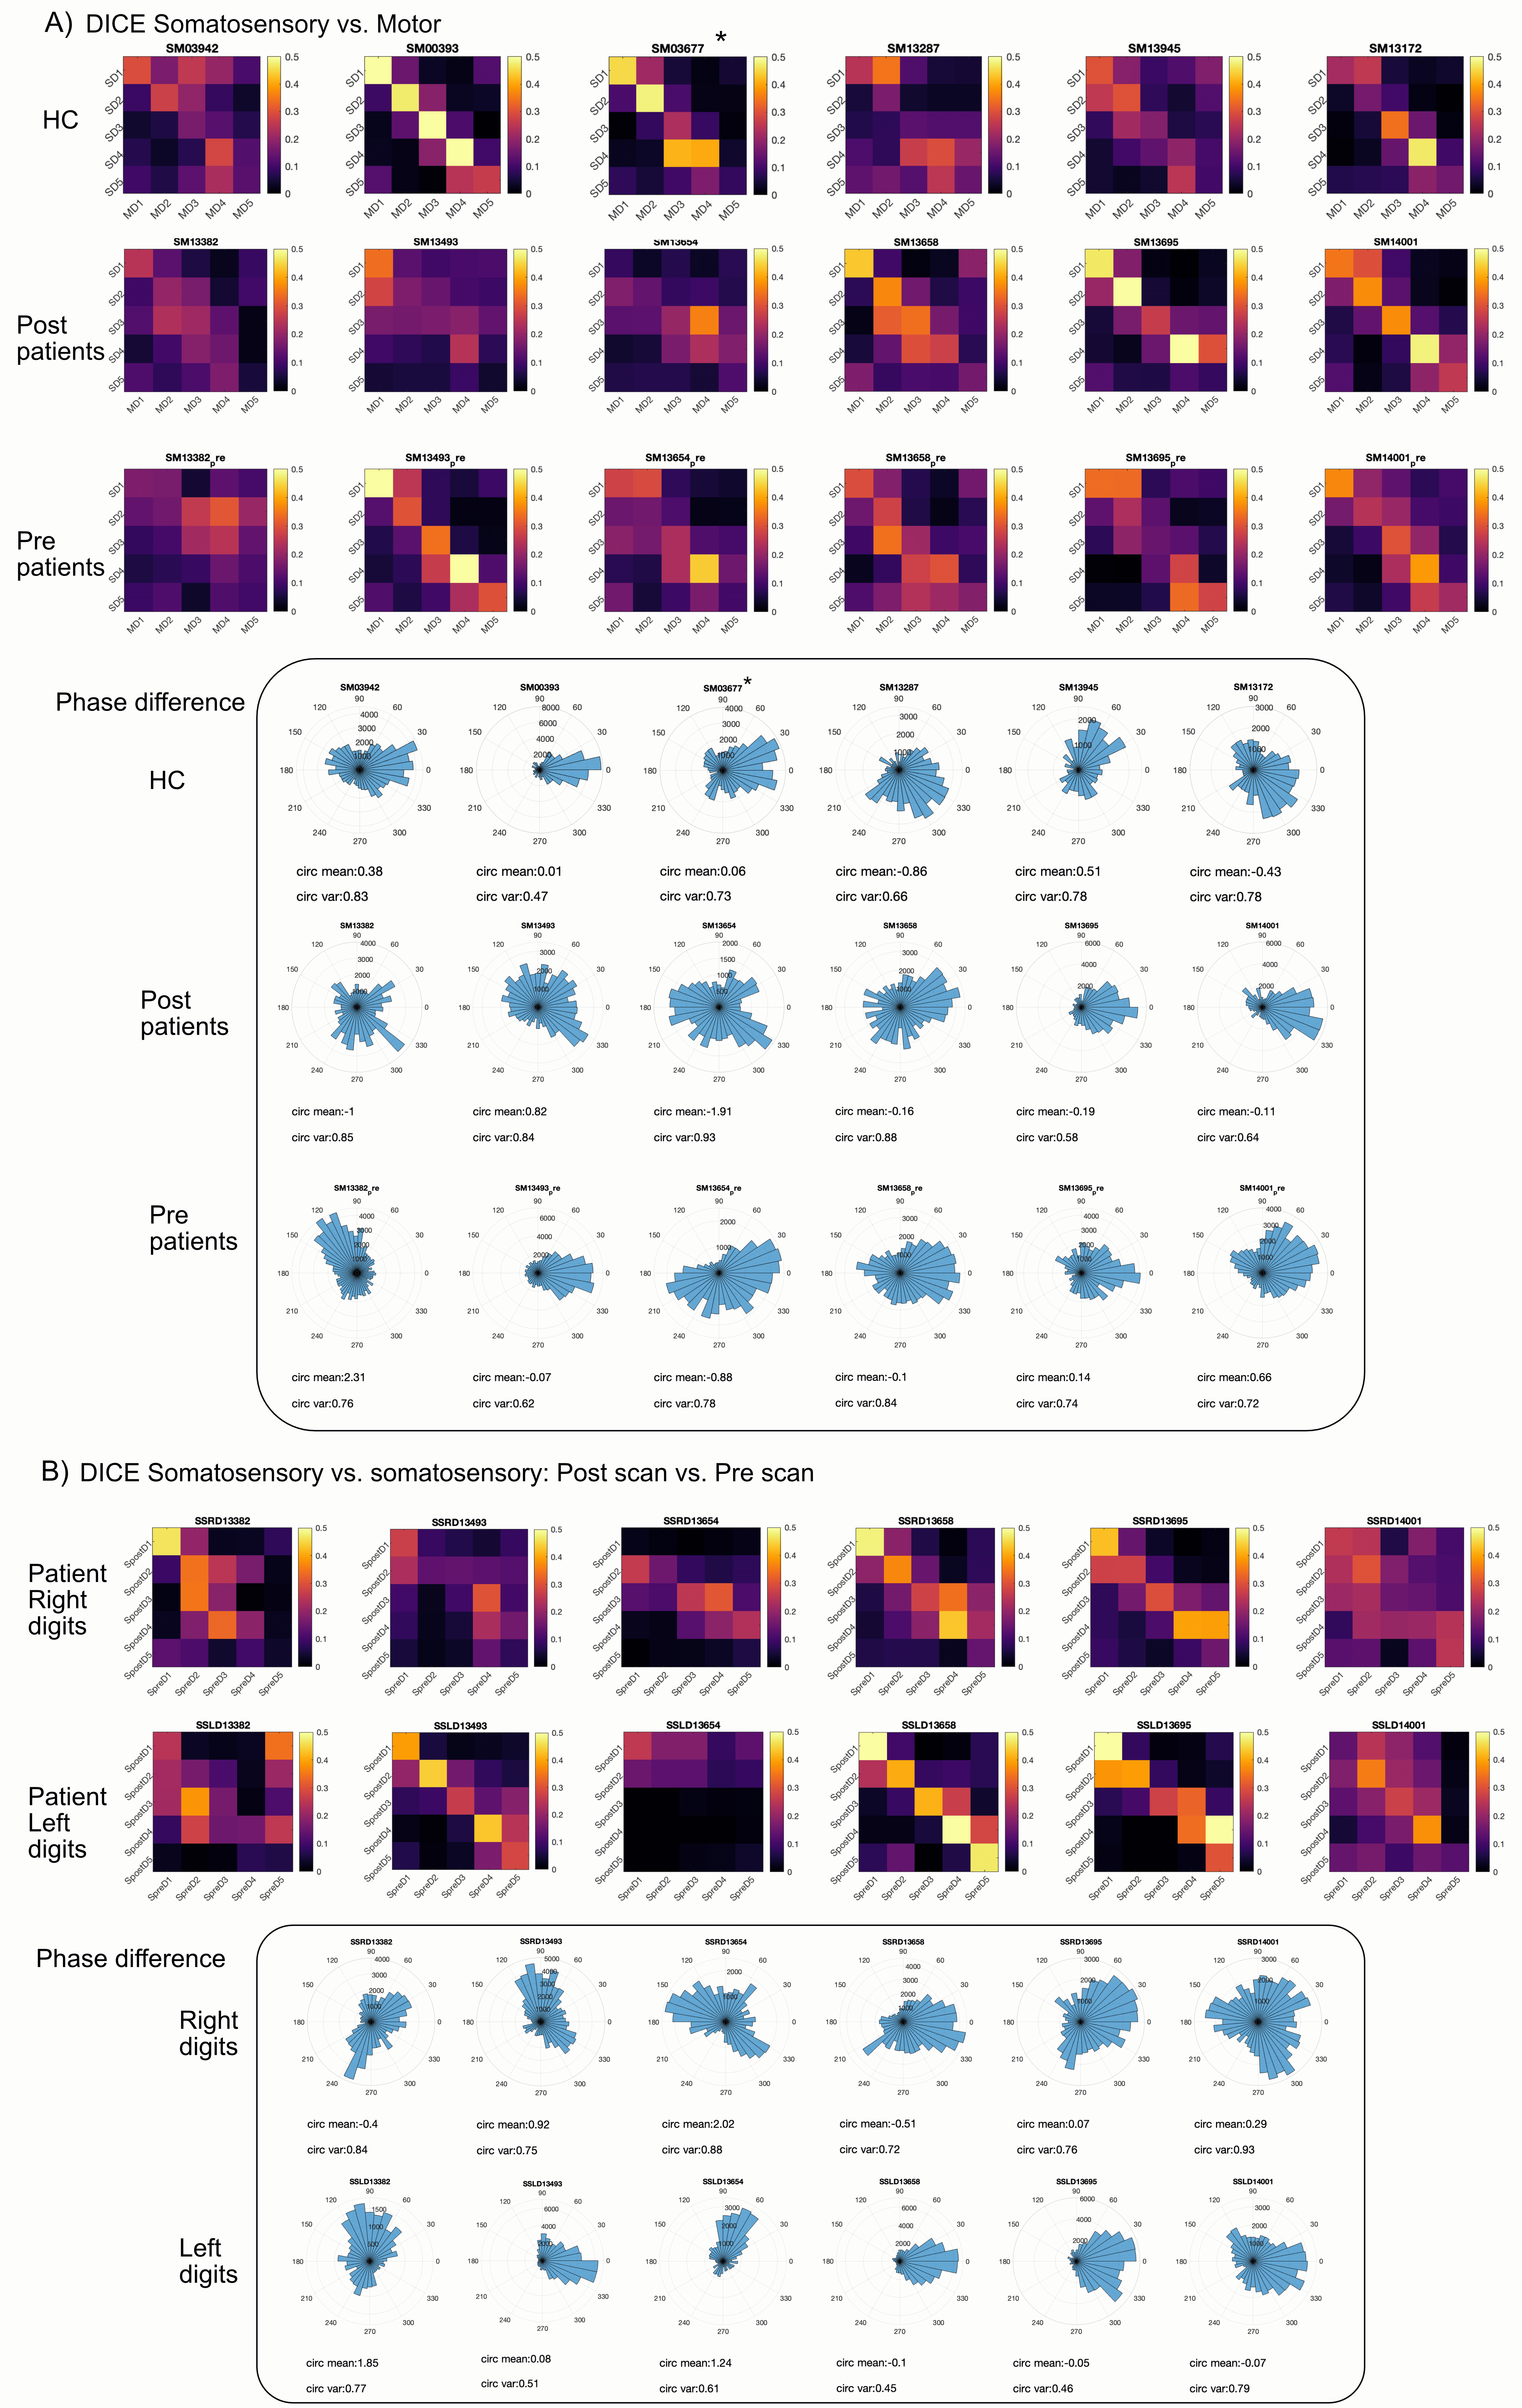
Data Acquisition: Six patients underwent the fMRI protocol (7T Philips Achieva, 32-channel receive coil), along with 6 age/gender-matched health controls (HC). We additionally include data from a 7th healthy and a POST-Botox amputee. Functional data were collected using GE-EPI-BOLD: Resting state (200 dynamics, TR=1.5s, Multiband=4, 1.5mm isotropic); Somatotopy TW and Mototopy TW (both 80 dynamics, TR=2s, Multiband=3, 1.5mm isotropic). Structural data (T2*-weighted-FLASH (0.5×0.5×1.5mm3); MPRAGE (1×1×1mm3) and PSIR (0.7x0.7x0.7mm3)) were also collected. Vibrotactile stimuli were delivered to the digit tips via MR-compatible piezo-electric stimulators (Dancer Design, UK) on each fingertip. Stimulation was performed in forward and reverse directions (4s/digit, 20s/cycle, 8 cycles). Somatotopic maps were formed for both hands. Mototopy was performed in the dominant hand, by tapping in air, visually cued by 5 blinking (1Hz) circles, with the same timings as the somatosensory TW. An accelerometer glove was worn to track movement. Behavioural data included temporal discrimination, amplitude thresholding and spatial acuity tasks. Data Analysis: Fourier analysis was performed in mrTools [6], producing coherence and phase maps of somatotopy and mototopy data. TW somatosensory maps were smoothed by 2mm in native space. The mototopy was not smoothed as it had an intrinsically higher SNR. ROIs of each digit were extracted, normalized to standard-space (fsaverage) and compared to a somatosensory probabilistic atlas developed in-house [7]. Central tendency (CT) was measured between the patient digits and the atlas digits [8]. CT defines how centrally located a digit is relative to a probabilistic atlas digit (1=perfect overlap, >1=resides centrally, <1=resides peripherally). The figure of merit [9] was then calculated from these values to define how well the patients’ digits mapped to the probabilistic atlas - figure of merit penalises both representation (CT score) and degeneracy (selectivity for a digit). Mototopy data were additionally analysed using a GLM to assess digit overlap. Each digit was modelled in a separate GLM utilising the exact timings of movement onset and offset from the accelerometer glove. Inspecting digit-wise beta weights provided an estimate of digit overlap. Individual digit activations were combined in a “winner-take-all” map which was compared to the TW Fourier analysis.Results
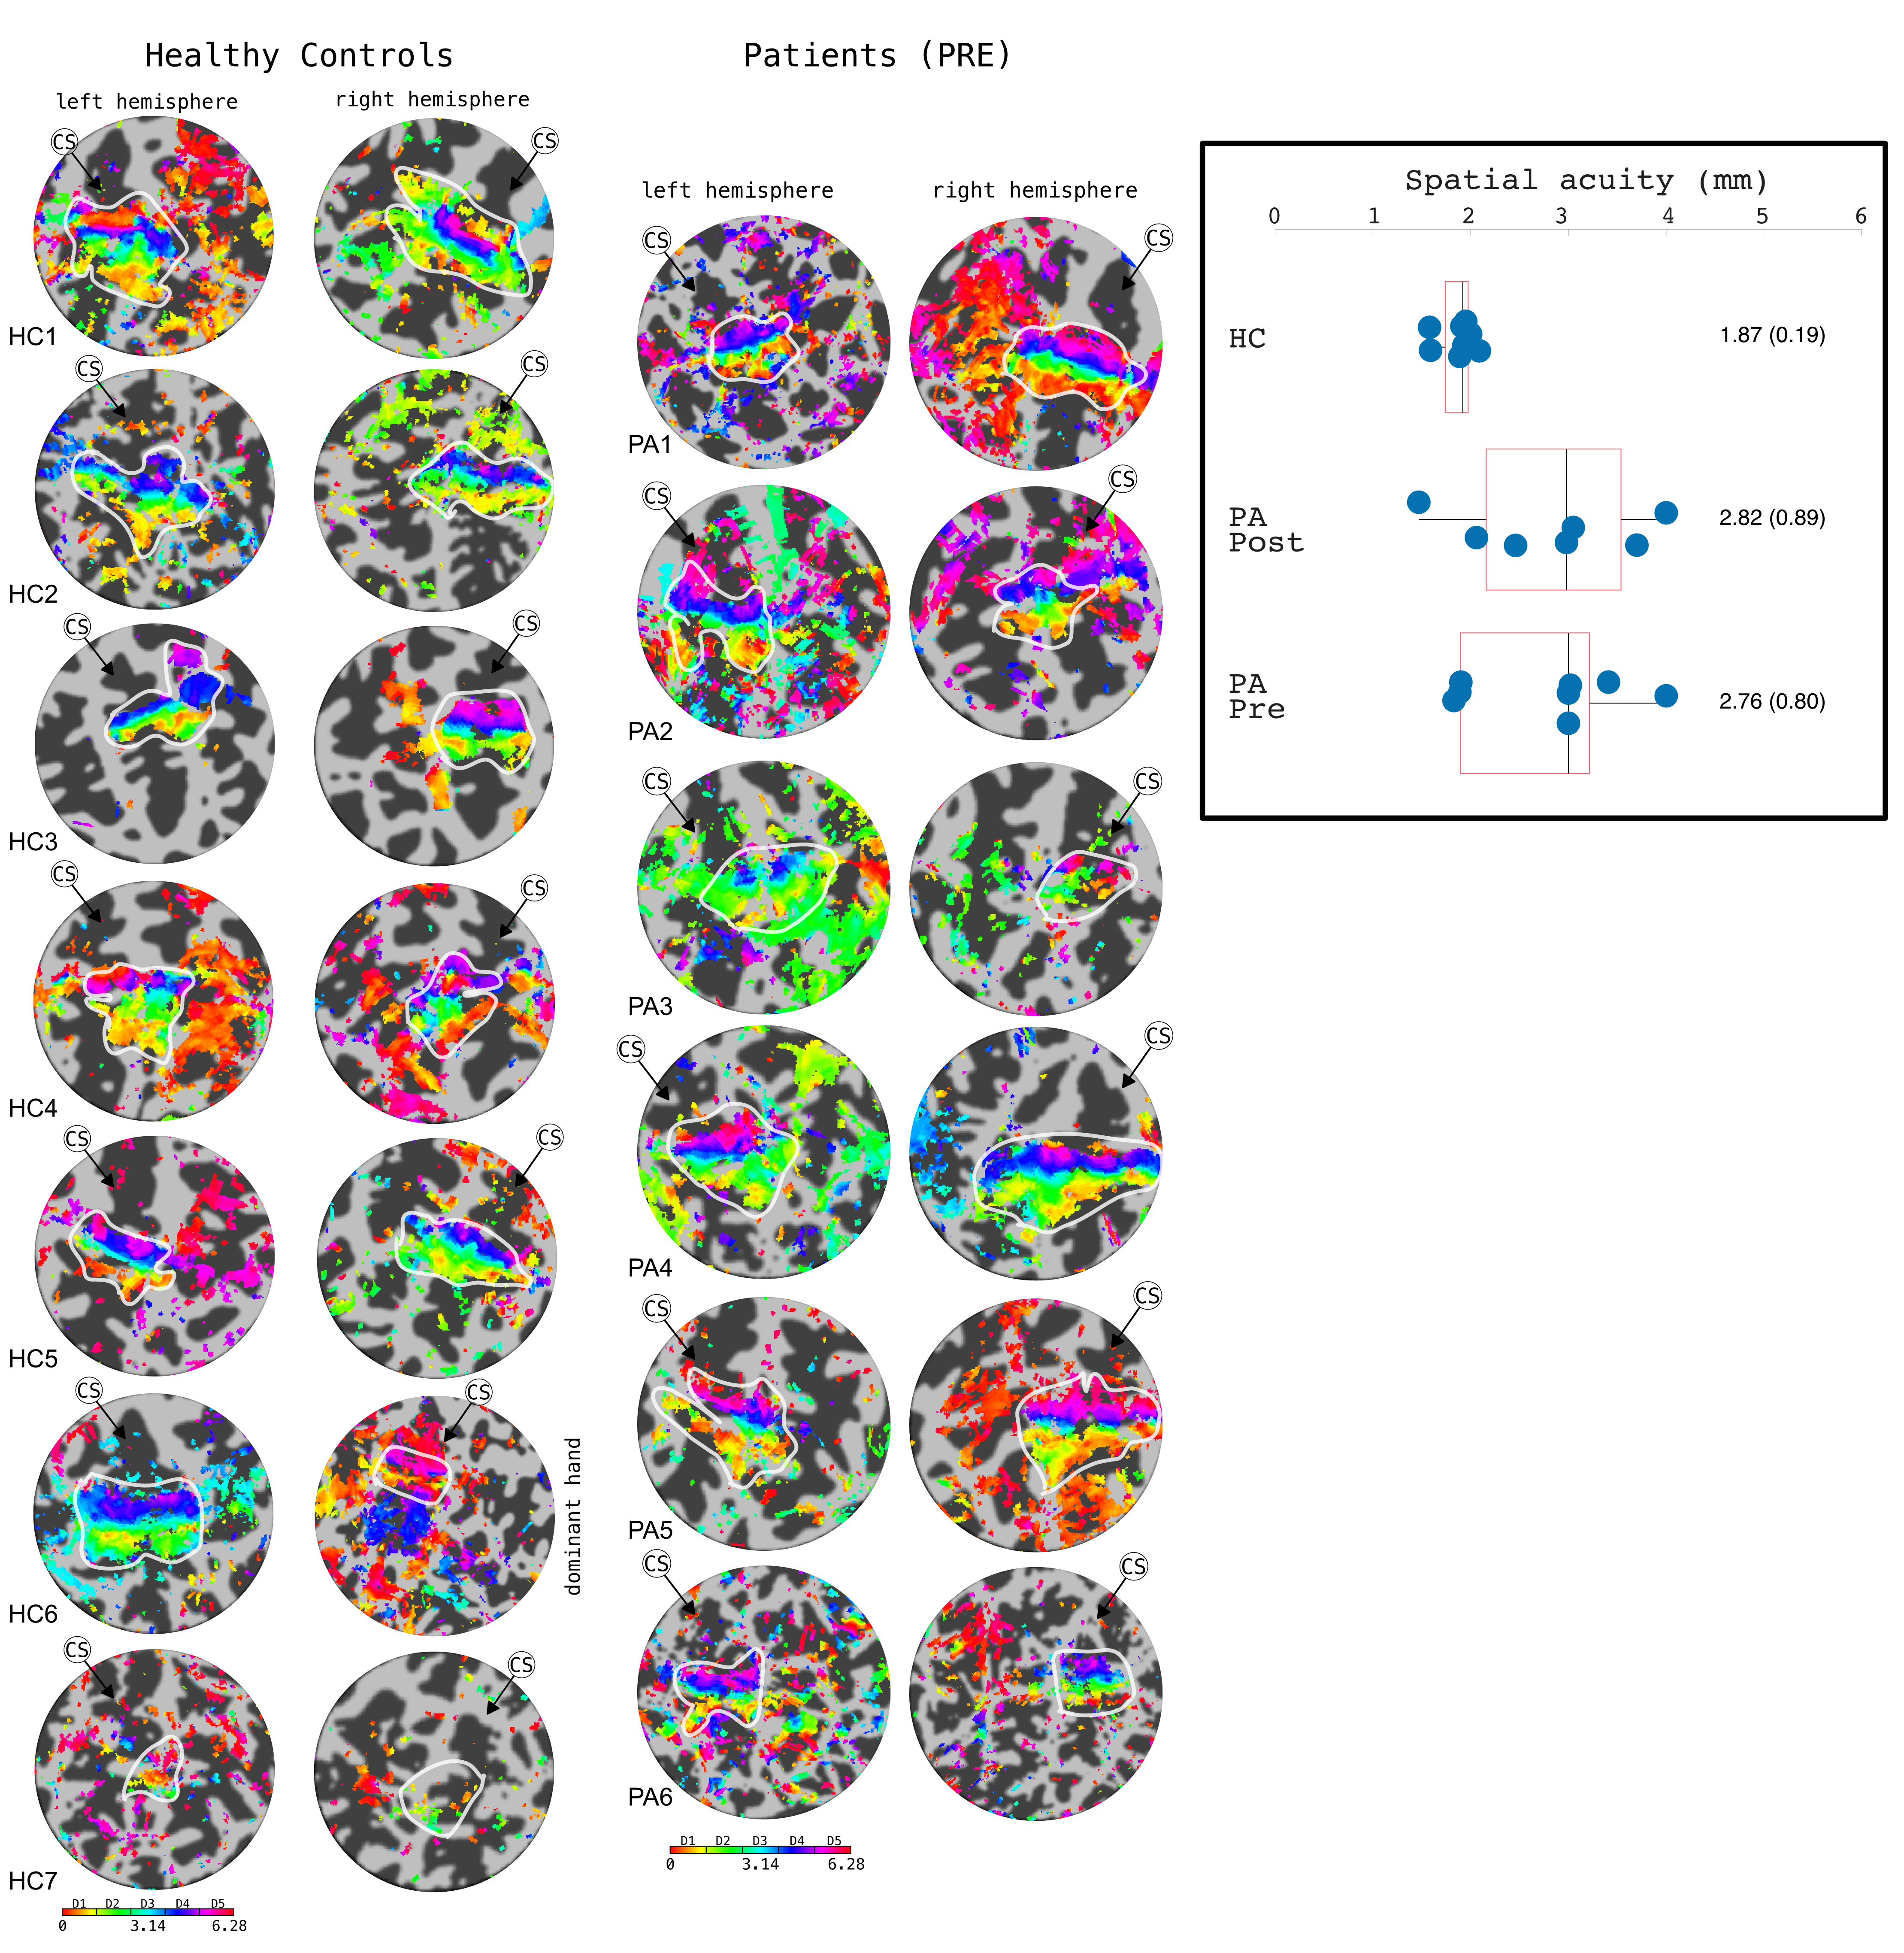
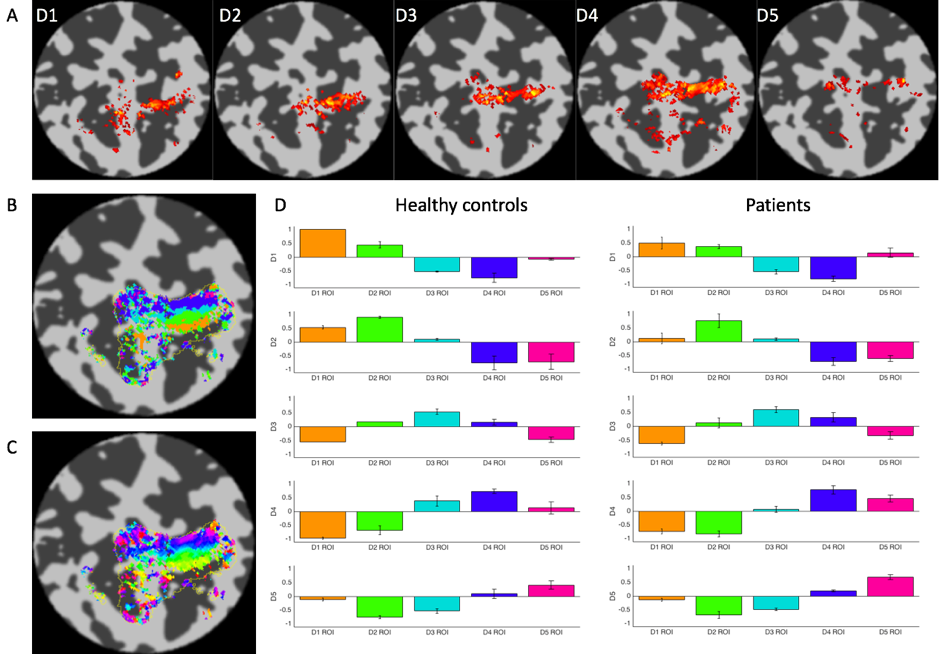
Behaviourally, a higher spatial acuity was found in the FHD patients at both visits, compared to HCs (Anova,F=3.52,p=0.053)(Fig.1). Figure 1 shows that most subjects had clear TW maps with good digit delineation, in the contralateral hemisphere to digit stimulation. The central tendency scores were similar across all subjects (Fig.2). There was little difference in trends between dominant and non-dominant hands, or across groups for the figure of merit (Fig.3); D3 tended to have the lowest figure of merit in all groups. Dice coefficients [10] indicate strong overlap of somatosensory TW data with mototopy TW data in the postcentral gyrus (Fig.4A), illustrated by polar histograms of phase difference (somato vs motor). Circular variance (CV) of the phase difference was similar across all groups (mean CV: HC 0.68, POST-Botox 0.85, PRE-Botox 0.74). Note, unsmoothed somatotopy TW data were used to match the mototopy data. Comparison of somatosensory TW data between POST-Botox and PRE-Botox patients scans was also consistent in terms of dice coefficient and circular variance of phase difference histograms (mean CV: POST-Botox 0.63, PRE-Botox 0.78) (Fig.4B). Winner-take-all somatotopy maps (Fig.5) showed good agreement to the TW maps obtained by Fourier-analysis. Assessing the overlap of digits (Fig.5D), both groups show beta weights that are significantly different from zero for the stimulated and the adjacent digits, but there was no difference in degree of overlap between patients and HCs.Discussion
The raised spatial acuity in FHD patients is consistent with literature and is considered an endophenotype of FHD [11]. fMRI analyses show similar results between HCs, FHD patients 4 weeks and 3 months after Botox. The similarity of both HCs and FHD patients’ central tendency scores compared to a somatosensory probabilistic atlas supports the lack of differences observed in this study. Dice coefficients and phase difference histograms are further consistent with this observation. An interesting finding is the high spatial overlap of somatosensory and motor fMRI responses in the post-central gyrus (see also [12]). There was little difference in overlap between the HCs and POST-Botox patient group (but this data is currently analysed in a subset of 3 matched subjects only).Conclusion
Here, somatotopic and mototopic representation in HCs and FHD patients PRE- and POST-Botox was assessed using 7T fMRI. Across this group we find no significant differences in cortical representations.Acknowledgements
No acknowledgement found.References
[1] R. M. Sanchez-Panchuelo et al., “Regional structural differences across functionally parcellated Brodmann areas of human primary somatosensory cortex,” Neuroimage, vol. 93, pp. 221–230, 2014.
[2] S. Butterworth, S. Francis, E. Kelly, F. McGlone, R. Bowtell, and G. V. Sawle, “Abnormal cortical sensory activation in dystonia: An fMRI study,” Mov. Disord., vol. 18, no. 6, pp. 673–682, 2003.
[3] F. M. Molloy, T. D. Carr, K. E. Zeuner, J. M. Dambrosia, and M. Hallett, “Abnormalities of spatial discrimination in focal and generalized dystonia,” Brain, vol. 126, no. 10, pp. 2175–2182, 2003.
[4] T. D. Sanger, D. Tarsy, and A. Pascual-Leone, “Abnormalities of spatial and temporal sensory discrimination in writer’s cramp,” Mov. Disord., vol. 16, no. 1, pp. 94–99, 2001.
[5] L. G. Cohen, M. Hallett, B. D. Geller, and F. Hochberg, “Treatment of focal dystonias of the hand with botulinum toxin injections.,” J. Neurol. Neurosurg. Psychiatry, vol. 52, no. 3, pp. 355–63, 1989.
[6] J. L. Gardner, E. P. Merriam, D. Schluppeck, J. Besle, and D. J. Heeger, “mrTools: Analysis and visualization package for functional magnetic resonance imaging data,” Jun. 2018.
[7] A. Sengupta, D. Schluppeck, E. Barratt, J. Besle, S. Francis, and R. Sanchez-Panchuelo, “A Probabilistic Atlas of Digit Somatotopy in the Human Primary Somatosensory Cortex,” in Proc Intl Soc Mag Reson Med, 2018.
[8] S. B. Eickhoff et al., “Assignment of functional activations to probabilistic cytoarchitectonic areas revisited,” Neuroimage, vol. 36, no. 3, pp. 511–521, 2007.
[9] G. C. O’Neill et al., “Measurement of dynamic task related functional networks using MEG,” Neuroimage, vol. 146, pp. 667–678, 2017.
[10] J. Kolasinski, T. R. Makin, S. Jbabdi, S. Clare, C. J. Stagg, and H. Johansen-Berg, “Investigating the Stability of Fine-Grain Digit Somatotopy in Individual Human Participants,” J. Neurosci., vol. 36, no. 4, pp. 1113–1127, 2016.
[11] G. Defazio, A. Berardelli, and M. Hallett, “Do primary adult-onset focal dystonias share aetiological factors?,” Brain, vol. 130, no. 5, pp. 1183–1193, 2007.
[12] W. Schellekens, N. Petridou, and N. F. Ramsey, “Detailed somatotopy in primary motor and somatosensory cortex revealed by Gaussian population receptive fields.,” Neuroimage, Press., vol. 179, no. June, pp. 337–347, 2017.
Figures