3906
An automated pneumatic tactile stimulator for somatotopic mapping1Radiology, University of Alabama at Birmingham, Birmingham, AL, United States
Synopsis
An MR-safe pneumatic tactile stimulator was developed and tested for automated somatotopic mapping using functional MRI. The device was used in a non-invasive fMRI experiment to perform basic somatotopic mapping on three healthy volunteers. Results from fMRI are consistent with maps of S1 obtained from cortical stimulation studies done in surgical patients, and the technique shows promise for future studies.
Introduction
Noninvasive measurement of somatosensory activation has possible applications in basic neuroscience, presurgical planning, and clinical evaluation.1–3 Somatotopic mapping was first accomplished by Penfield et al. by direct electrical stimulation of the human cerebral cortex during surgery in patients.4 Recently, there has been renewed scientific interest in the layout of S1,5–7 and rigorous comparison of somatotopic maps acquired from a large set of individuals with diverse backgrounds and medical histories would be possible with noninvasive functional MRI. The technique has also shown promise for identifying critical areas of cortex in patients before undergoing surgical procedures to adjacent tissue.1,8 Such a method may also be useful for evaluation of neuropathy and functional plasticity in patients. Functional MR imaging (fMRI) of the somatosensory nervous system is difficult because of the MR environment. To ensure quality data that will lead to accurate activation maps, tactile stimuli must be presented in a temporally consistent way that is synchronized to image acquisition. Strong magnetic fields prevent the use of automated setups that use readily available, simple to deploy components like electromagnetic motors.Methods
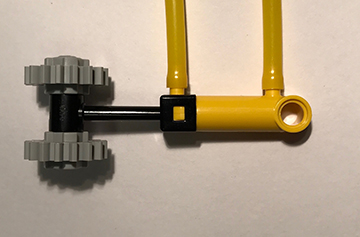
A pneumatic device was developed and built to automate and synchronize tactile stimulation. A touch stimulus was produced by alternatingly pressurizing and depressurizing opposite ends of a plastic pneumatic cylinder and driving a plastic piston back and forth. The prototype described here used 8 of the stimulators shown in Figure 1, each using a pneumatic cylinder (LEGO part x189x01) with a stroke length of 20 mm. Each cylinder was driven with a 5 port, 2-way valve connected using lengths of polyurethane tubing. The state of each valve was switched independently with a 24V solenoid using a microcontroller and 5V relays. Constant air pressure of 200 kPa was provided to each valve by an air compressor. The beginning of a stimulation sequence was triggered by a TTL pulse output from the MRI scanner at the start of fMRI volume acquisition, ensuring synchronicity between stimulus presentation and functional data. The only elements of the system that needed to be placed in the MRI scanning room were the stimulators and the pneumatic tubing, both made of nonmagnetic plastic. We performed fMRI somatotopy experiments on 3 healthy volunteers (1 male, 2 female, ages 21-33 years old). The experiments were performed at 3T on a Siemens Prisma scanner using a 20-channel head and neck coil array. Eight minutes of functional data with 60 transverse slices were collected with a multi-band echo planar imaging sequence for blood oxygen level dependent (BOLD) contrast (TR = 1500 ms, TE = 37 ms, PE anterior to posterior, multi-band acceleration factor = 4). The device was tested on the left side of each subjects body using body parts outside and inside the field of view. Stimulators were activated in a different pseudorandom order for each functional scan, which consisted of alternating 30 second stimulation and rest blocks. During each stimulation block, one piston was activated and oscillated with a period of 1.5 s. Each subject completed three of the 8-minute functional scans. fMRI analysis was carried out using FEAT (Version 6.00), part of FSL (www.fmrib.ox.ac.uk/fsl) and FreeSurfer (http://surfer.nmr.mgh.harvard.edu/) software packages.9–11 Time series were analyzed according to the general linear model consisting of a double-gamma hemodynamic response function convolved over the stimulus intervals. z statistic images were thresholded using clusters determined by z > 3.1 and a cluster significance threshold of p = 0.05.11 Higher-level analysis between scanning sessions and individuals to find mean activation for each body part was done using a fixed effects model.Results
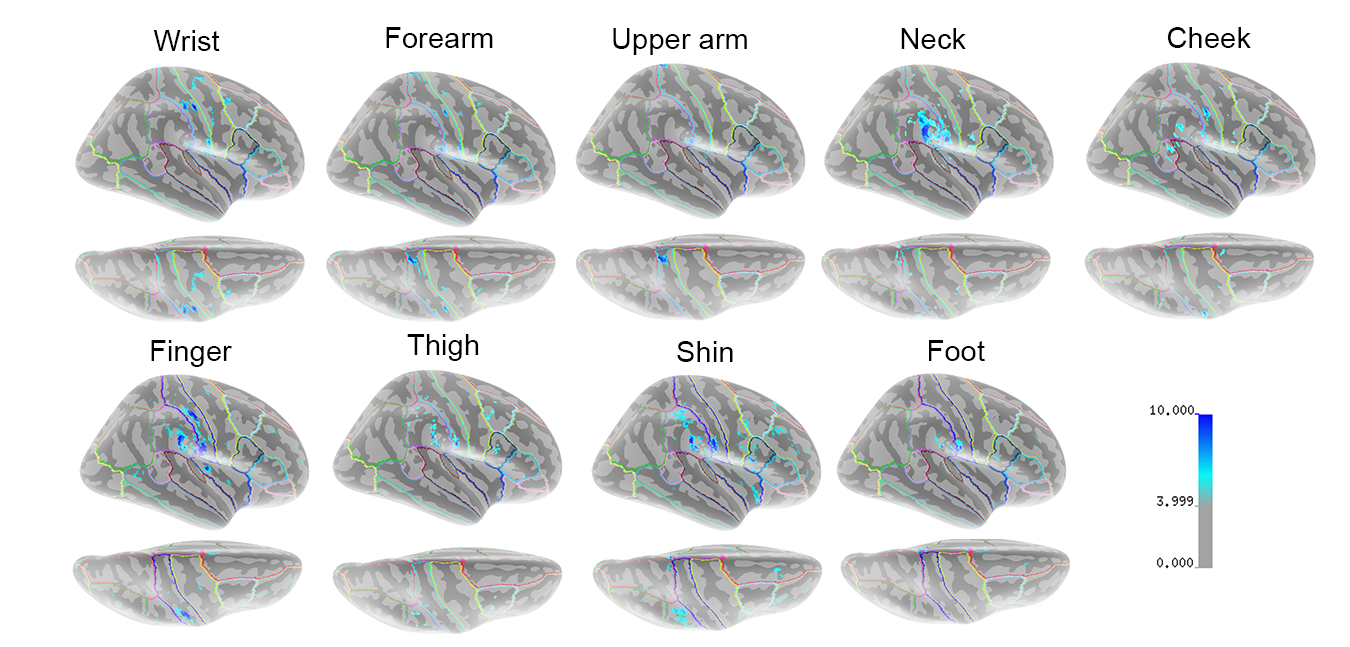
Stimulators in the face and neck areas were not visible in the T1-weighted anatomical images or the T2* functional images that were collected. A summary of the results of the initial study are shown in the parametric map of the MNI152 surface in Figure 2. Areas of light to dark blue represent lesser to greater statistical significance of measured BOLD activity in that area of the brain. Tactile stimulation of each body part produced some amount of activation in S1 on the postcentral gyrus. Stimulation of more sensitive areas, including the fingertips, shins, and neck produced activation in the secondary somatosensory cortex (S2) along the lateral sulcus, and in the temporal lobe, particularly on the supramarginal gyrus. Ipsilateral activation was also measured for several body parts (not shown).Discussion
The cortical representation of each body part in S1 appears to be consistent with the Penfield model of the homunculus, and further studies on a larger numnber of individuals would be needed to definitively determine if there are any discprencies between mapping using different modalities. It was surprising that such a short amount of scan time produced such robust activation for different stimulated body parts and is encouraging for ongoing work using the device.Conclusion
Somatotopic mapping of the cerebral cortex is possible using an automated, MR-safe method that employs plastic pneumatic actuators. Preliminary results are consistent with the homunculus model of localization of sensory processing the brain. Further somatotopic mapping is ongoing in healthy volunteers, and future work is planned to examine subcortical maps and maps compared to patients that exhibit sensory deficits.Acknowledgements
This work was supported by a pilot grant from the UAB Department of Radiology.References
1. Bittar, R. G. et al. Presurgical motor and somatosensory cortex mapping with functional magnetic resonance imaging and positron emission tomography. J. Neurosurg. 91, 915–921 (2009).
2. Bannister, L. C., Crewther, S. G., Gavrilescu, M. & Carey, L. M. Improvement in touch sensation after stroke is associated with resting functional connectivity changes. Front. Neurol. 6, 1–15 (2015). 3. Carey, L. M. et al. Same Intervention-Different Reorganization: The Impact of Lesion Location on Training-Facilitated Somatosensory Recovery after Stroke. Neurorehabil. Neural Repair 30, 988–1000 (2016).
4. Penfield, W. & Boldrey, E. Somatic Motor and Sensory Representation in Man. Brain 389–443 (1937). doi:10.1093/brain/60.4.389
5. Schluppeck, D., Sanchez-Panchuelo, R. M. & Francis, S. T. Exploring structure and function of sensory cortex with 7 T MRI. Neuroimage 164, 10–17 (2018).
6. Beugels, J. et al. Somatotopic mapping of the human breast using 7 T functional MRI. Neuroimage 204, 116201 (2019).
7. Yu, Y. et al. Layer-specific activation of sensory input and predictive feedback in the human primary somatosensory cortex. Sci. Adv. 5, 1–9 (2019).
8. Alahmadi, A. A. S. et al. Differential involvement of cortical and cerebellar areas using dominant and nondominant hands: An FMRI study. Hum. Brain Mapp. 36, 5079–5100 (2015).
9. Worsley, K. J. Statistical analysis of activation images. in Functional Magnetic Resonance Imaging (Oxford University Press, 2001).
10. Woolrich, M. W. et al. Bayesian analysis of neuroimaging data in FSL. Neuroimage 45, S173–S186 (2009).
11. Woolrich, M. W., Ripley, B. D., Brady, M. & Smith, S. M. Temporal autocorrelation in univariate linear modeling of FMRI data. Neuroimage 14, 1370–1386 (2001).
Figures